. 2025 Jul 1;16(1):5758.
doi: 10.1038/s41467-025-60831-0.

Pancreatic islet β-cell subtypes are derived from biochemically-distinct and nutritionally-regulated islet progenitors

Affiliations

Pancreatic islet β-cell subtypes are derived from biochemically-distinct and nutritionally-regulated islet progenitors

Monica E Brown et al. Nat Commun. .

Abstract

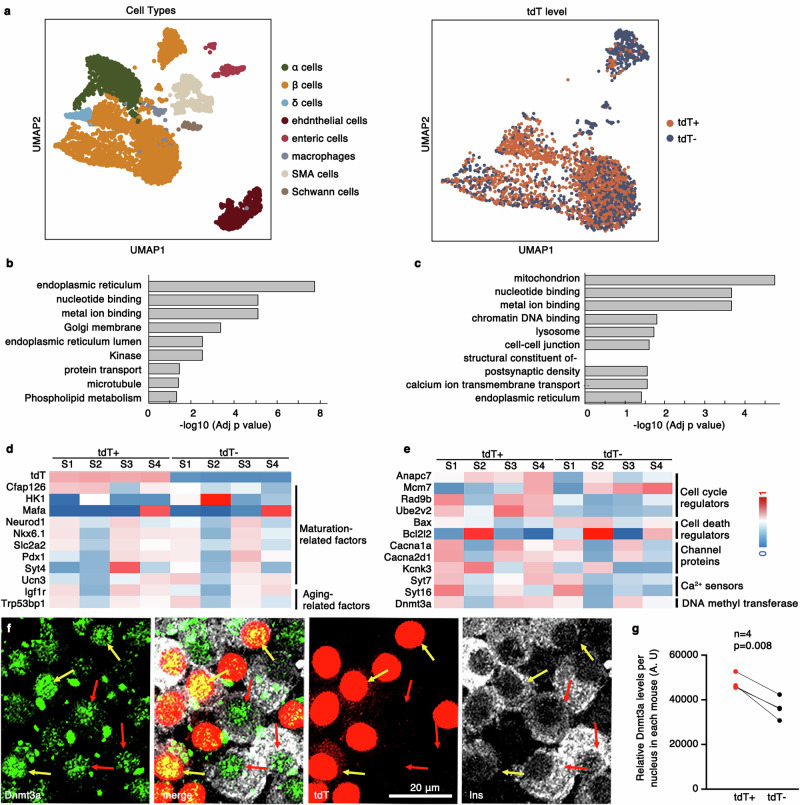
Endocrine islet β cells comprise heterogenous subtypes with different gene expression and function levels. Here we study when/how this heterogeneity is induced and how long each subtype maintains its characteristic properties. We show that islet progenitors with distinct gene expression and DNA methylation patterns produce β-cell subtypes of different secretory function, proliferation rate, and viability in male and female mice. These subtypes have differential gene expression that regulates insulin vesicle production or stimulation-secretion coupling and differential DNA methylation in the putative enhancers of these genes. Maternal obesity, a major diabetes risk factor, reduces the proportion of the β-cell subtype with higher levels of glucose responsiveness. The gene signature that defines mouse β-cell subtypes can reliably divide human cells into two sub-populations, with the one having higher predicted glucose responsiveness reduced in diabetic donors. These results suggest that β-cell subtypes can be derived from islet progenitor subsets modulated by maternal nutrition.


Conflict of interest statement

Competing interests: The authors declare no competing interests.

Figures

Fig. 1
Fig. 1. M+N+ and M-N+ progenitor-derived β cells have different proliferation rate, viability, and secretory function.
a The scheme for M+N+ sub-lineage marking. be β-cell proliferation assays in MNT mice. b An image (single and merged channels) showing P24 β-cell subtype proliferation [tdT+ (red) and tdT-], using Ki67 (white) and insulin (green) co-staining. White arrows, tdT-Ki67+ cells; yellow arrows, tdT+Ki67+ cells. 15 mice were examined, yielding similar results. c The % of Ki67-expressing tdT+ or tdT- β cells in each of the 15 mice (m: males, f: females). d A tdT+ β cell with dividing nuclei (yellow arrow), detectable in all 15 mice. e The proportions (mean + SEM) of tdT+ β cells at P2 and P60, obtained using scRNA-seq (Supplementary_data_file_1). P-values in c and e are from unpaired t-tests with two-sided type-two error. “n” in (e), numbers of mice (4 P2 and 6 P60). fj β-cell apoptosis in MNmG mice. f A β cell (insulin+, white) expressing Casp (green) but not mG (red)(white arrows). Merged and single channels are included. g An mG+Casp3+ β cell (white arrow). (h, i) highlight the mG+Ins+ cell (broken white circle) in the Ins and MG channels of (g). j % of Casp3+ β-cell subtypes. P-value is from a paired student t-test with two-sided type-two error. In (j), 3 P4 and 3 P7 mice were counted (>1500 β cells counted in each). (k-o) Insulin secretion in PSIs from β-cell subtypes of MNT islets. k, l FACS sorting and PSI production of tdT+ and tdT- PSIs (DAPi was used for excluding dead cells). (m-o) Insulin secretion under G2.8, G20, or G20K. The % (mean + SEM) of total insulin secreted was presented. m, n Results of 2-month old MNT female or male mice, respectively. o PSI secretion from 8-month-old MNT mice (males and females). P-values are from unpaired t-test with a two-sided type-two error. Only those p < 0.05 were shown. “n”, the number of individual GSIS assays using different PSIs, done on 2 or 3 days using preps from different mice. Scale bars, 20 μm.
Fig. 2
Fig. 2. ScRNA-seq identifies DEGs in P2 β-cell subtypes.
Islets from P2 MNT mice were isolated, dissociated, and used in inDrop-seq. The β cells were then grouped as tdT+ and tdT- sub-populations for comparison. a UMAPs showing the clustering of different cell types within islets (left) and the β-cell subtypes with tdT expression highlighted (right). b, c Terms enriched in the P2 tdT+ (b) and tdT- (c) β-cell subtypes, analyzed using DAVID. The p-values, from one-sided Fisher’s exact tests, were adjusted using the Benjamini-Hochenberg procedure for multiple comparisons. d, e Heat maps of several genes that are not (d) or are (e) differentially expressed in tdT+ and tdT- β cells. Log-transformed expression levels are presented, normalized against their mean across the four replicates. The samples are grouped based on tdT expression. The results of tdT+ and tdT- cells within each replica (S1-S4) were also marked for pair-wise comparison. The large inter-sample variations between either tdT+ or tdT- cells likely reflect the volatile nature of heterogeneity in individual mouse and batch differences of scRNA-seq. f, g Dnmt3a levels in β-cell subsets at P2. f An example of IF co-staining (average projection from Z-stack confocal images) of Dnmt3a (green) and insulin (white) in MNT islet cells. Yellow and red arrows, tdT+ or tdT- cells, respectively. g The relative IF signal intensity in individual tdT+ or tdT- β cell nuclei (2 batches done on two days, two mice each day), presented as an arbitrary unit (A.U.). Each dot represents an average of IF intensity of all beta cells examined in each mouse prep. “n” in g refers to the number of mice examined. The P-value is from an paired t-test with a two-sided type-two error. Scale bar, 20 μm.
Fig. 3
Fig. 3. DEGs between P60 β-cell subtypes have established roles in β cells.
Islets from P60 MNT mice were hand-picked and used for scRNA-seq. The β cells were then grouped as tdT+ and tdT- sub-populations for comparison. a An UMAP showing sub-clustering of P60 β cells with tdT expression highlighted. b, c Pathways/terms enriched in the tdT+ (b) and tdT- (c) β-cell subtypes using DAVID. The p-values, from one-sided Fisher’s exact tests, were adjusted using the Benjamini-Hochenberg procedure for multiple comparisons. dg The expression levels of several candidate genes in β-cell subtypes using a Kruskal-Wallis test followed by a post hoc Mann-Whitney U test. h Pathways/terms enriched in the DEGs shared by P2 and P60 samples, analyzed using DAVID. The p-values, from one-sided Fisher’s exact tests, were adjusted using the Benjamini-Hochenberg procedure for multiple comparisons. i, j IF staining of Dnmt3a (green) in β cells (white) at P60. i Is an example of IF staining (average projection from Z-stack confocal images) in tdT+ (red staining, yellow arrows) and tdT- β cells (red arrows). j The relative IF signal intensity in tdT+ or tdT- β cells. Each dot represents an averaged IF intensity from all nuclei examined in one of three mice, presented as an arbitrary unit (A.U.). P-value is from a paired t-test, two-sided type-two error. “n” in j refers to the number of mice.
Fig. 4
Fig. 4. M+N+ and M-N+ progenitor-derived β cells have DMRs.
a The flow of DNA methylation assays. b Boxplot distribution of methylated cytosine fraction in eYFP+ or eYFP- β-cell subtypes. Center line, median; box limits, upper and lower quartiles; whiskers, upper and lower limit range; points, outliers. c The proportional distribution of DMRs in gene promoter, intron, exon, intergenic regions, etc. d DMRs near the Arx locus. Two methylation tracks (eYFP- and eYFP+ β cells) are shown. The two DMRs have higher (red bar) or lower (orange bars) methylation levels in eYFP+ cells. The number following “X:” indicates the number of CpG dinucleotides within the DMR. A few predicted motifs specific to the two DMRs are labeled. e Predicted DNA motifs enriched in the DMRs between P2 β-cell subtypes using HOMER. The p-values were determined by a two-sided hypergeometric test and displayed. f, g Pathways/terms that are enriched in the DMR-associated genes (analyzed using DAVID), with either lower- (f) or higher levels of (g) methylation. The p-values, from one-sided Fisher’s exact tests, were adjusted using the Benjamini-Hochenberg procedure for multiple comparisons. h P2 DEGs (down- or up-regulated) associated with P2 DMRs (with lower or higher methylation in eYFP+ cells). P-values were from a two-sided Fisher exact test. i A DMR in the first intron of Syt7 with a lower methylation in eYFP+ β cells (orange bar). Two motifs associated with this DMR are labeled (Tcf4 and Mafb). jl The effects of Syt7 DMR manipulation. j An U6 promoter was used to express a guide RNAto bring dCas9-DNMT3a (reported by eGFP expression) to methylate DNA close by. k The effects of co-expressing a Syt7 gRNA anddCas9-DNMT3a (green) on Syt7 (red) levels in MIN6 cells. Three experiments were done with similar findings. Scale bar, 20 μm. l Real-time RT-PCR assays of three samples (mean + SEM, 3 RNA samples isolated from different plates), with p-values from unpaired t-test, two-sided type-two errors.
Fig. 5
Fig. 5. DNA methylomes in postnatal β cells are dynamic, but adult and newly-born β-cell subtypes have DMRs that are associated with a common set of genes.
Genome-wide methylome analysis followed that in Fig. 4. a Clustering of HMRs in P2 and P60 β cells based on their DNA methylation levels. The numbers of HMRs in the six k-means clusters (C1 to C6) are shown. “*”: clusters with >1.8 fold difference in mean methylation. b Boxplot distribution of methylated cytosine fraction across individual DMRs between the P60 β-cell subtypes, with DMRs having higher or lower methylation levels in eYFP+ β cells, respectively. Center line, median; box limits, upper and lower quartiles; whiskers, upper and lower limit range; points, outliers. c DNA motifs enriched in the DMRs between P60 β-cell subtypes identified using HOMER. The p-values were determined by a two-sided hypergeometric test. d P60 DEGs that are associated with P60 DMRs. P-values were from a two-sided Fisher exact test, comparing the up-/down-regulated genes to DMRs with higher or lower methylation levels in eYFP+ β cells. e Terms that are enriched for P60-DMR-associated P60 DEGs (analyzed using DAVID). The DEG groups with lower or higher levels of methylation in eYFP+ cells are combined. The p-values (one-sided Fisher’s exact tests) were adjusted using the Benjamini-Hochenberg procedure. fi DMR/DEG overlaps between P2 and P60 cell subtypes. f The DMRs retained in P2 and P60 cell subtypes. g The overlap between DMR-associated genes at P2 and P60. P-values were from a two-sided hypergeometric test, based on the total 87,792 HMRs detected. hDnmt3a association with DMRs (orange bars) detected at P2 or P60, with their locations shifted. A few motifs that are specific to these DMRs are labeled. The number following “X:” in each DMR indicates the number of CpG dinucleotides within the DMR. i Pathways enriched in the P60 DEGs that are also associated with P2 and P60 DMRs, analyzed using DAVID. The p-values were from one-sided Fisher’s exact test, adjusted using the Benjamini-Hochenberg procedure for multiple comparisons._.
Fig. 6
Fig. 6. DEGs between P60 β-cell subtypes contribute to their functional differences.
a A few DEGs expressed in P60 tdT+ and tdT- β cells in 3 male (MS) and 3 female samples (FS). be Results of Myt TFs haploinsufficiency. b Representative islet IF (insulin: green. Glucagon, red. Somatostatin, white) from 4-weeks old mice, with 4 controls and 4 mutants checked with similar results. c, d IPGTT (mean + SEM) of 6-week old males (c) and 3-month old females (d). C has 7 mutants and 8 controls, while d has 6 mutants and 8 controls. e Insulin secretion induced by G2.8, G20, and G20K (mean + SEM). “n = 6” refers to different samples of different mice. fiSyt7 CRISPRi. f Syt7 was repressed with 2 gRNAs to recruit dCas9-KRAB to its promoter, verified by real-time RT- PCR in islets of 4 controls and 4 mutants (mean + SEM). g Islet morphology (insulin: green. Glucagon, red, somatostatin, white) of 4-week old mice, similar in 4 controls and 4 mutants. h, i Insulin secretion (mean + SEM) of control and Syt7-KD islets. “n”, number of independent assays from different islet preps. h includes 7 mutants and 12 controls, I has 6 mutants and 6 controls. jo Effect of VGCC expression on Ca2+ influx. j Snapshots of real-time Ca2+ influx via CaMP6 (white or green) recording. k, l Quantification in scatter plot or AUC (mean + SEM), with oversaturating cells (white arrows in j) excluded. 161 tdT+ and 129 tdT- β cells (4 males and 4 females) were assayed. m, n Effect of VGCC knock-down on Ca2+ influx in mouse islet cells as scatter plot or AUC (mean + SEM), assayed with Fura2. o Real-time RT-PCR assays of VGCC knockdown (mean + SEM) in 4 independent assays. The numbers of PSI used for (m, n) are: 132 (control) 148 (Cacna1a KD), and 167 (Cacna2d1 KD). In panels (c, d, k, m), p-values were from a 2-way ANOVA. In panels (e, f, h, i, l, n, o), p-values were from unpaired t-tests, two-sided type-two errors. Scale bars, 20 μm.
Fig. 7
Fig. 7. MHFD reduces the proportion of M+N+ progenitors and their descendant β cells before birth while inducing postnatal β-cells proliferation.
a The experimental design. b A few DEGs in Ngn3+ cells with mHFD or control diet (CD) treatment. Shown are the levels of expression normalized against that of CD-treated cells. c, d IF staining showing tdT (red) and Ki67 (white) expression in β cells (green) in MNT mice with CD or mHFD exposure immediately after birth (P1). A merge and the three single channels are presented. White arrows, tdT-Ki67+ β cells. Yellow arrows, tdT+Ki67+ β cells. 9 controls and 12 mHFD mice were examined, with similar results. Bar = 20 μm. e, f The proportion of tdT+ β cells (mean + SEM, (e) and the proliferation rate (mean + SEM, (f) (ki67 expression) of tdT+ and tdT- β-cell subtypes. P-values were calculated using unpaired t-tests with two-sided type-two errors. “n” refers to the number of mice examined (9 controls and 11 mHFD mice).
Fig. 8
Fig. 8. Mouse β-cell subtype enriched markers can divide human β cells into subpopulations whose proportion change corresponds to diabetes development.
af The expression of CD9 (a, green), CD24 (b, green), MAFB (c, green), DNMT3A (d, green), SYT7 (e, green), TPT1 (f, green) in primary human β cells. Shown are average projections from z-stacks of the entire cells. For each marker, a single panel (the marker) and a merged panel showing the marker/insulin (red)/DAPI (blue) co-staining are presented. Also note that three cells (marked 1, 2, 3) are highlighted to show the differential expression of each marker. Scale bar, 5 μm, identical in all panels. Primary islets from 3 healthy donors were examined, producing similar results. g The 20 mouse DEGs selected for human β-cell subpopulation studies. See Table S1 for their selection. h, i UMAPs of human β-cell populations based on the aggregated expression of the 20 genes listed in (g), using available data in Kaestner et al. and Xin et al.. j Gini indices and respective p-values (one-sided Fisher’s exact test) to measure if the distribution of 20 genes was equal amongst all β cells. The null hypothesis is that the distribution was equal. k, l The Processes enriched in Pop. 1 cells of Kaestner et al. (e) or Xin et al. (f). The top 9 processes are presented. The p-values, from one-sided Fisher’s exact test, were adjusted using the Benjamini-Hochenberg procedure for multiple comparisons. m, n Sub-clustering and quantification of β-cell subpopulations from T2D donors. The T2D β cells from Kaestner et al. were used. Presented are (Mean ± SEM). The P-value is from an unpaired t-test for two-sided type-two error. “n” in (n) (31 normal and 17 T2D) refers to the number of donors.
Fig. 9
Fig. 9. The M+N+ progenitor-derived β cells are enriched in reported β-cell subtypes with higher glucose responsiveness.
The scRNA-seq and bulk-RNAseq from (Rubio-Navarro et al., 3023 and Dror et al., 2023) were compared with ours to determine β-cell subtype overlap. a, b UMAPs of β-cell populations reported by Rubio-Navarro based on the aggregated expression of the 20 genes listed in (Fig. 8g). a Is from wild-type untreated samples, while (b) from mHFD-fed mice of Rubbio-Navarro. c Quantification of the proportions of tdT+-equivalent β cells (Pop. 1) in mHFD-fed and control mouse samples. (d, e) Marker expression overlaps between this study and Dror et al.. In (d), we identified the overlap between our P60 DEGs and those reported by Dror et al. with adjusted p < 0.05. e Shows the overlap between our P60 DEGs with that reported by Dror et al. with p < 0.05. Fold enrichment and p-values are from two-sided hypergeometric tests. Note that we only examined the genes with detectable expression (via scRNA-seq) in P60 β cells (a total of 22,060), used as the population size in the hypergeometric tests. This adjusts for the problem associated with comparing gene expression exclusively in β cells. f, g The levels of H3K27me3 (green) in tdT+ (red) and tdT- β-cell subtypes, shown by IF staining and quantification. Pdx1 was used to identify β cells (white). Each dot in panel g represents an averaged IF intensity (arbitrary unit) from all nuclei examined in one mouse. P-value is from a paired t-test with two-sided type-two error. “n” in (g) refers to the number of mice used.

Update of

References

    1. Aguayo-Mazzucato, C. et al. β cell aging markers have heterogeneous distribution and are induced by insulin resistance. Cell Metab.25, 898–910 e895 (2017). - PMC - PubMed
    1. Bader, E. et al. Identification of proliferative and mature beta-cells in the islets of Langerhans. Nature535, 430–434 (2016). - PubMed
    1. Dorrell, C. et al. Human islets contain four distinct subtypes of beta cells. Nat. Commun.7, 11756 (2016). - PMC - PubMed
    1. Dror, E. et al. Epigenetic dosage identifies two major and functionally distinct beta cell subtypes. Cell Metab.35, 821–836.e827 (2023). - PMC - PubMed
    1. Parveen, N. et al. DNA Methylation-Dependent Restriction of Tyrosine Hydroxylase Contributes to Pancreatic beta-Cell Heterogeneity. Diabetes72, 575–589 (2023). - PMC - PubMed

LinkOut - more resources