. 2025 Jul 1;16(1):5747.
doi: 10.1038/s41467-025-61044-1.

Axon targeting of transcriptionally distinct pioneer neurons is regulated by retinoic acid signaling

Affiliations

Axon targeting of transcriptionally distinct pioneer neurons is regulated by retinoic acid signaling

Benjamin M Woodruff et al. Nat Commun. .

Abstract

During nervous system development, pioneer neurons (pioneers) extend their axons toward distant targets, creating a scaffold for follower neurons and defining the initial structure of the nervous system. Despite years of study, whether pioneer neurons are transcriptionally distinct from followers is unknown. To address this question, we performed single-cell RNA sequencing (scRNA-seq) of zebrafish posterior lateral line (pLL) sensory neurons and found that pioneers and followers are transcriptionally distinct populations. Interestingly, expression profiling of differentiating pLL progenitors defines "follower" as the ground state and "pioneer" as a later developmental state, with retinoic acid (RA) signaling active in all pLL progenitors. Modulation of RA signaling within single pLL neurons demonstrated that its downregulation is necessary for expression of a neurotrophic factor receptor ret, which is required for correct targeting of pioneer axons. Our study reveals molecular heterogeneity between pioneers and followers and implicates RA signaling in fidelity of pioneer axonal targeting.


Conflict of interest statement

Competing interests: The authors declare no competing interests. Inclusion & ethics statement: This research aligns with the Inclusion & ethical guidelines embraced by Nature Communications.

Figures

Fig. 1
Fig. 1. scRNA-sequencing identifies two transcriptionally distinct populations of pLL neurons.
AD Schematic of pLL development. A At 14 hpf, the posterior lateral line placode contains both neural and sensory progenitors. B At 22 hpf, the pLLP begins migrating and pioneer axons are already embedded within it. C At 30 hpf, the pLLP and pioneer axons reach halfway down the trunk. D At 48 hpf, the pLLP and lateral line pioneer axons have reached the end of tail. Abbreviations: pLLg – pLL ganglion; L1 - L5 are lateral trunk NMs; Ter – terminal cluster of NMs. Created in BioRender. Lab, N. (2025) https://BioRender.com/vij5z6b. E neurod1:egfp transgene labels a subset of CNS and PNS neurons at 30 hpf, including the pLL,. White arrowheads mark extending pioneer axons in the inset. Scale bar = 200 μm. F UMAP of all 30 hpf, EGFP + sorted and sequenced cells. Major cell types are indicated. Red circle: lateral line neurons. GJ Feature plots showing expression of lateral line specific markers: ret, stmn2a, bmper, and rspo2. Red circle: lateral line neurons. K pLL subclusters: ret+ and ret- populations. LO Feature plots of subpopulations showing several differentially expressed genes in each subcluster. P Dotplot showing genes expressed in all pLL neurons as well differentially expressed genes in each subcluster.
Fig. 2
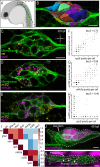
Fig. 2. Validation of scRNA-seq data identifies ret+ neurons as pioneers.
A Schematic of a 30 hpf embryo, a stage utilized for FISH. Membranes are labeled by cldnB:memgfp transgene (green). Created in BioRender. Lab, N. (2025) https://BioRender.com/mdz3df6. B 3D reconstruction of individual pLL neurons by Imaris using membrane-tagged cldnB:memgfp fluorescence. Subsequently, binned fluorescent puncta are counted in each individual cell. CE Representative single Z-slice confocal images through the pLL ganglion showing pairwise FISH of two genes from ret+ and ret- subclusters (ret and rpz5, nr2f2 and rpz5, or nr2f2 and ntrk3a) at 30 hpf. Note that genes from the same clusters are coexpressed, whereas genes from the ret+ and ret- subclusters are largely expressed in different cells. FH Quantification of gene expression shown in 2C–E. Each dot corresponds to a single cell and the axes indicate binned gene expression levels. Each plot shows all cells across 10 embryos. Gene expression within the same pLL subcluster is strongly correlated, whereas gene expression between different pLL subclusters is not. I Heatmap shows pairwise Kendall tau-beta gene correlation coefficients based on examining expression of gene pairs by FISH. Empty squares represent untested probe combinations. J Z-projection of rpz5:mRuby pLLg. Cell membranes are marked by cldnB:memgfp transgene. Note that only a subset of dorsal pLL neurons is mRuby-positive at 40 hpf (n = 6). K Confocal image of the migrating pLL primordium from the same animal shown in (J). Note the presence of mRuby-positive axons embedded within the primordium (dashed outline) indicating that labeled pLL cells are indeed pioneer neurons. mRuby labeling dorsal to pLL primordium is muscle. All scale bars = 10 μm. All images scaled the same.
Fig. 3
Fig. 3. pLL pioneer neurons are required for follower axon extension.
A Schematic depicting ablation strategy. EGFP+ neurons were ablated between 22 and 23 hpf and then imaged live using confocal microscopy. Created in BioRender. Lab, N. (2025) https://BioRender.com/vij5z6b. B Non-ablated pLLg at 22 hpf immediately before timelapse begins. C Stills from timelapse of the control embryo shown in (B) at 23 hpf (C) and 27.8 hpf (C’). D pLLg before and after (D’) ablation of all three EGFP+ neurons. E Stills from timelapse recorded after complete ablation in (D). F pLLg before and after ablation (F’) of three out of five EGFP+ neurons. G Stills from timelapse recorded after partial ablation in (F). White arrowhead = EGFP+ pLL neurons; yellow arrowhead = pLL nerve terminals. All scale bars = 20 μm. All images scaled the same.
Fig. 4
Fig. 4. Live imaging defines cellular events during pLL morphogenesis.
AD Stills from a timeseries (Supplementary Movie 4) visualizing formation of the pLL system between 15 and 23 hpf. The pLL placode is marked by the cldnB:memgfp transgene, while pLL progenitors undergoing neurogenesis are visualized by Tg(neurod1:Zebrabow). The pLL placode, otic placode, and the neural tube are outlined by dashed lines. A At the onset of pLL neurogenesis (15 hpf), neural and sensory progenitors are intermixed within the pLL placode. B Neural and sensory progenitors are in a process of separating form the pLL ganglion and primordium, respectively. C Neural and sensory progenitors separate at 18 hpf, while neurites (arrowheads) from pLL progenitors project toward sensory progenitors. D At 22 hpf, pioneer axons (marked by arrowheads in the inset) extend with the migrating pLLP. Scale bar = 10 μm. All images scaled the same.
Fig. 5
Fig. 5. Follower is a transcriptional ground state of pLL progenitors.
A UMAP plot of all cells derived from 14, 18, 22, 30, and 48 hpf neurod1:egfp embryos. Major cell types are indicated. B UMAP of the pLL progenitors, pioneers, and followers. C, D Feature plots showing neurogenesis marker, neurog1, and neural differentiation marker, snap25b. E Trajectory inference plot showing the predicted differentiation trajectory, consistent with the expression patterns of neurogenesis and differentiation markers in (C, D). F UMAP plot of pLL progenitors, pioneers, and followers grouped by timepoint. The pLL cell counts at each timepoint are as follows: 14 hpf, 23 cells; 18 hpf, 167 cells; 22 hpf, 67 cells; 30 hpf, 340 cells; and 48 hpf, 50 cells. G, H Pioneer markers rpz5 and ret are predominantly expressed in pioneers, but not in progenitors. I, J Follower markers hoxb5a and zfhx3 are expressed in both progenitor and follower populations. K, L Feature plots showing coexpression of pioneer (ret or ntrk1) and follower (zfhx3 or nr2f2) genes during differentiation (14–22 hpf). Note that a subset of cells coexpress both pioneer and follower markers at these stages (white cells): 25 cells co-express ret and zfhx3, and 25 cells co-express ntrk1 and nr2f2. Low expression cut off is set at 3 UMI per cell. M, N Gene signature plots of cells between 14 and 22 hpf. The follower gene signature is present broadly at earlier stages, while the pioneer gene signature is strongest in cells from 22 hpf. O Gene expression over time as cells differentiate from progenitors to followers or pioneers. Note that follower gene expression is similar across stages, whereas pioneer genes are upregulated during later differentiation stages.
Fig. 6
Fig. 6. Pioneer precursors exhibit distinct cellular behavior.
AC A single confocal Z-slice through the pLL ganglion labeled with FISH probes against ntrk1 (yellow) and nr2f2 (cyan) between 14 and 16.5 hpf. Cell membranes are labeled by cldnB:memgfp, whereas pLL neuroblasts are marked by neurod1:mCherry. Dashed line outlines pLL and otic placodes. Arrows mark leading tip cells upregulating pioneer marker ntrk1. Arrowheads mark neuroblasts co-expressing ntrk1 and nr2f2 (two replicas; n = 10 total animals). D, E Quantification of ntrk1 and nr2f2 expression between 14 and 20 hpf (D) or 30 hpf (E). Dashed red lines indicate cells that coexpress both markers. Note the significant number of co-expressing cells at 14–20 hpf (51/300 cells: 17%) compared to 30 hpf (5/285 cells: 1.8%): p = <0.001, Chi-Square test. FH Stills from a time series using neurod1:kaede photoconversion at 16 hpf. FH The first delaminating tip cell was photoconverted and tracked to visualize its peripheral axon. Note that the axon projects into the pLLP. Arrowheads = photoconverted axons, arrows = pioneer axons. IK A photoconversion of a distal cell. Note the labeled axons lagging behind the pLLP. Arrowheads = photoconverted axons, arrows = pioneer axons. L Schematic summary of photoconversions at 16 hpf. Cell location shows the region where it was photoconverted, and color indicates whether it became pioneer or follower. Delaminating tip cells became a pioneer 4 of 4 times. In labeled distal cells, 7 of 9 became followers, and 2 became pioneers. MO Stills from a timeseries of two individually labeled neurons between 17 and 25 hpf. M Anterodorsal neurons appear spindle-shaped with early neurite projections. N Their pioneer neurites localize within the pLLP. O Pioneer neurons extend their axons with the primordium during migration. Pioneer neurites marked by arrowheads. PR Stills from a timeseries of three individually labeled neurons beginning at 17 hpf. Note the absence of neurites in the pLLP through the time series. Follower neurites marked by arrowheads. For experiments shown in (MR), we imaged 7 embryos that contained 4 pioneers and 7 followers. Membrane = cldnB:memgfp (green). All scale bars = 20 μm. All images scaled the same.
Fig. 7
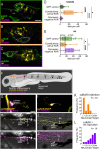
Fig. 7. Retinoic acid regulates pioneer neuron axon targeting.
A Schematic of mosaic labeling strategy. Tg(hsp70l:mCherry, en.silll)nl30 embryos were injected with one of the following plasmids: SILL:EGFP-CAAX, SILL:caRAR-CAAX, or SILL:dnRAR-CAAX at the one-cell stage. Animals were grown to 3 days and assessed for the presence of single EGFP-positive neurons in the pLL ganglion and the location of EGFP-positive axon terminals. Created in BioRender. Lab, N. (2025) https://BioRender.com/vij5z6b. BG Representative confocal images of single labeled neurons in the pLLg and their targets following overexpression of EGFP (B, E), caRAR (C, F), or dnRAR (D, G). The following number of cells were examined in 3 independent experiments (1 cell/animal): EGFP – 34; caRAR – 31, and dnRAR – 14. H Frequency of neuromast targeting along zebrafish trunk by neurons labeled with EGFP, caRAR, or dnRAR. Difference in axon targeting assessed by Chi-Square: EGFP vs. caRAR p = 0.0011; EGFP vs. dnRAR p = 0.0795; caRAR vs dnRAR p = 0.0001. All images are lateral views with anterior to left. Scale bars = 20 μm. All images scaled the same.
Fig. 8
Fig. 8. Retinoic acid negatively regulates ret.
AC Representative single confocal Z-slices of pLL ganglia expressing EGFP (A), caRAR (B), or dnRAR (C) in individual cells (dashed outlines). Expression of ret (yellow) and hoxb5a (magenta) was assessed by FISH. D, E Quantified expression levels of hoxb5a and ret after injection of RAR constructs. We analyzed the following numbers of embryos from two independent experiments: EGFP control: 21; caRAR: 15, dnRAR: 12. Each plot shows minimum, Q1, median, Q3, and maximum. Nonparametric Kruskal–Wallis test values are shown on plots: *p < 0.05; ****p < 0.0001. Exact p-values are as follows: hoxb5a, GFP vs caRAR < 0.0001; GFP vs dnRAR = 0.0340; caRAR vs dnRAR < 0.0001; ret, GFP vs caRAR = 0.0135; GFP vs dnRAR = 0.1024; caRAR vs dnRAR < 0.0001. F Schematic of mosaic labeling using coinjection of two constructs: caRAR-2A-EGFP and mCherry (control) or caRAR-2A-EGFP and ret-mCherry driven by neurod1 promoter. Following injection, embryos were screened at 72 hpf for the position of colabeled axon terminals. Created in BioRender. Lab, N. (2025) https://BioRender.com/vij5z6b. G, H Confocal image of the neuron cell body (G) and its axon terminal (L1) labeled by caRAR and mCherry (H,H’). I, J Confocal image of the neuron cell body (I) and its axon terminal (terminal NMs) labeled by caRAR and ret-mCherry (J,J’). K, L Frequency of NM targeted by labeled neurons coexpressing either caRAR-2A-EGFP+mCherry or caRAR-2A-EGFP + ret-mCherry: p = 0.0002, Chi-square test. The following number of cells were examined in 2 independent experiments (1 cell/animal): caRAR-2A-EGFP + mCherry – 10; caRAR – 10, and caRAR-2A-EGFP + ret-mCherry – 18. All images are lateral views with anterior to the left. Scale bars = 20 μm. All images scaled the same.

Similar articles

References

    1. Bate, C. M. Pioneer neurones in an insect embryo. Nature260, 54–56 (1976). - PubMed
    1. Ho, R. K. & Goodman, C. S. Peripheral pathways are pioneered by an array of central and peripheral neurones in grasshopper embryos. Nature297, 404–406 (1982). - PubMed
    1. Sánchez-Soriano, N. & Prokop, A. The influence of pioneer neurons on a growing motor nerve in drosophila requires the neural cell adhesion molecule homolog fasciclinII. J. Neurosci.25, 78–87 (2005). - PMC - PubMed
    1. Lin, D. M., Auld, V. J. & Goodman, C. S. Targeted neuronal cell ablation in the Drosophila embryo: pathfinding by follower growth cones in the absence of pioneers. Neuron14, 707–715 (1995). - PubMed
    1. Tuttle, A., Drerup, C. M., Marra, M., McGraw, H. & Nechiporuk, A. V. Retrograde Ret signaling controls sensory pioneer axon outgrowth. eLife8, e46092 (2019). - PMC - PubMed

LinkOut - more resources