. 2025 Jul 1;16(1):5947.
doi: 10.1038/s41467-025-61197-z.

Histone serotonylation promotes pancreatic cancer development via lipid metabolism remodeling

Affiliations

Histone serotonylation promotes pancreatic cancer development via lipid metabolism remodeling

Sang Lin et al. Nat Commun. .

Abstract

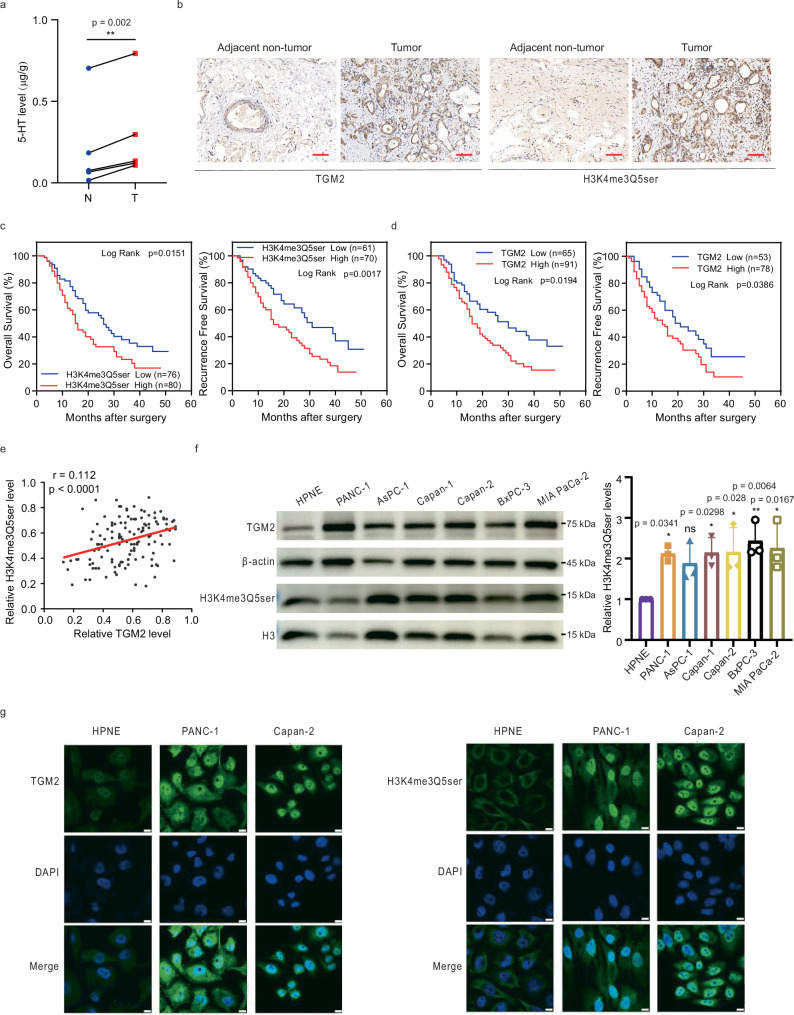
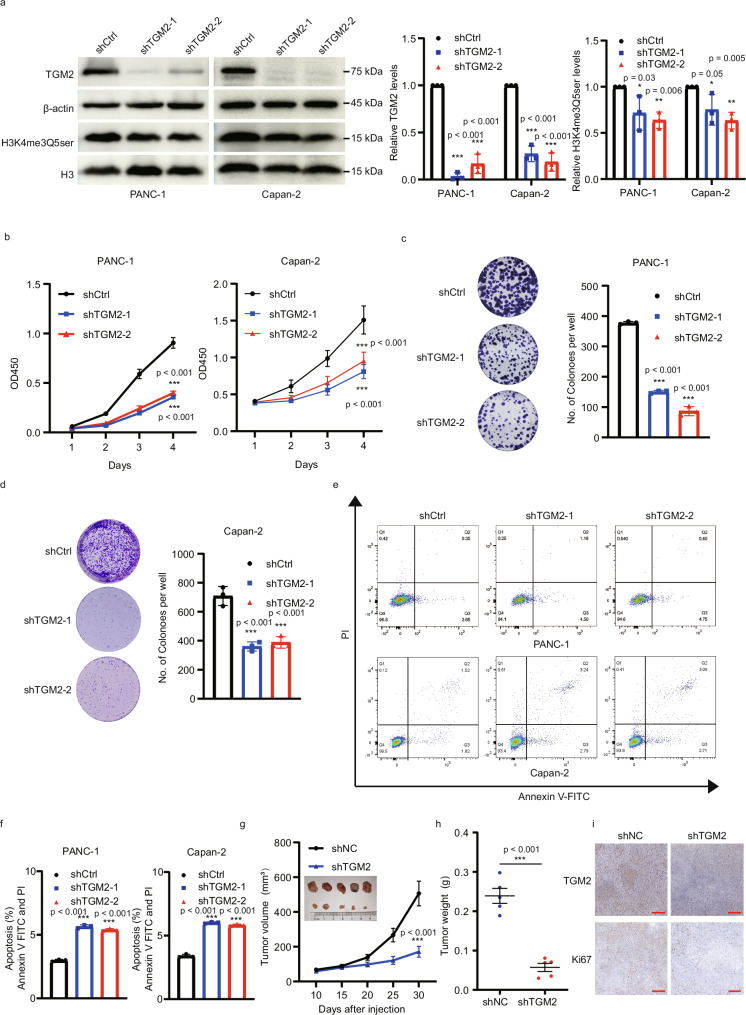
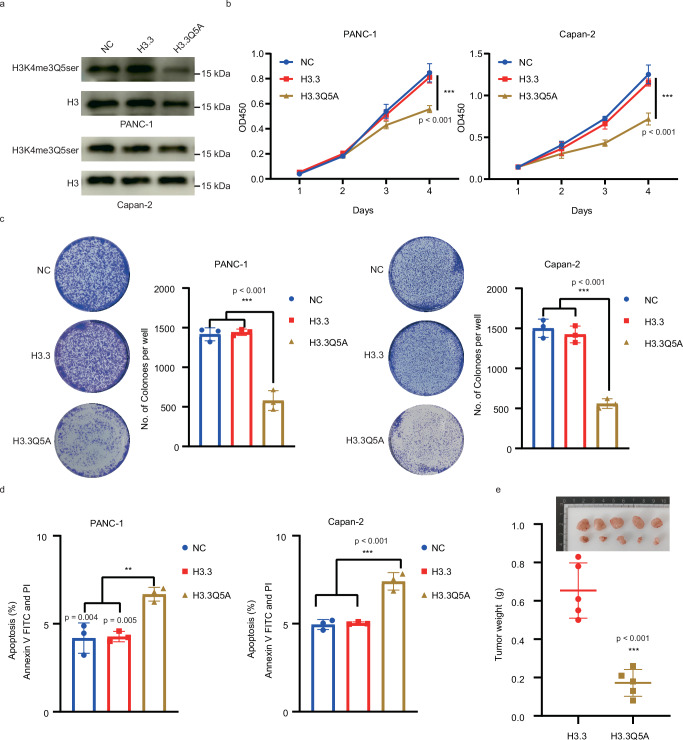
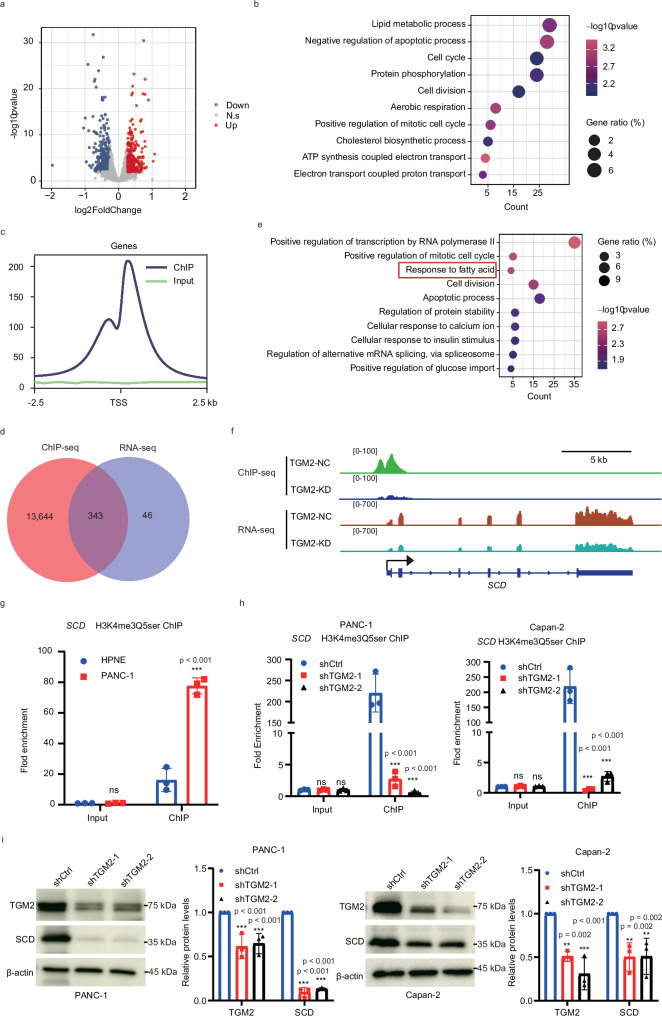
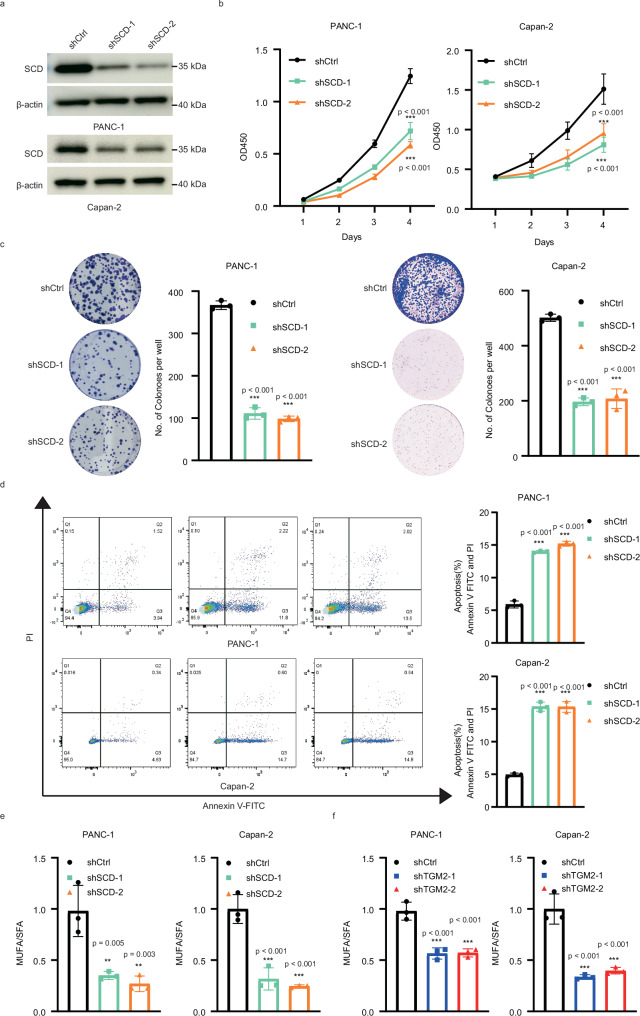
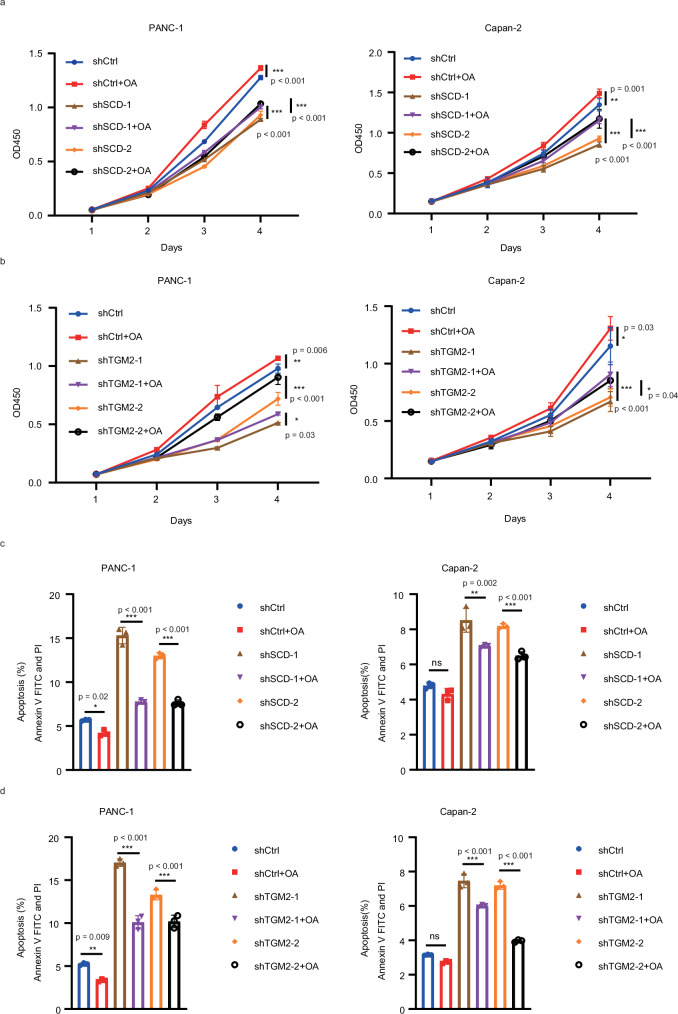
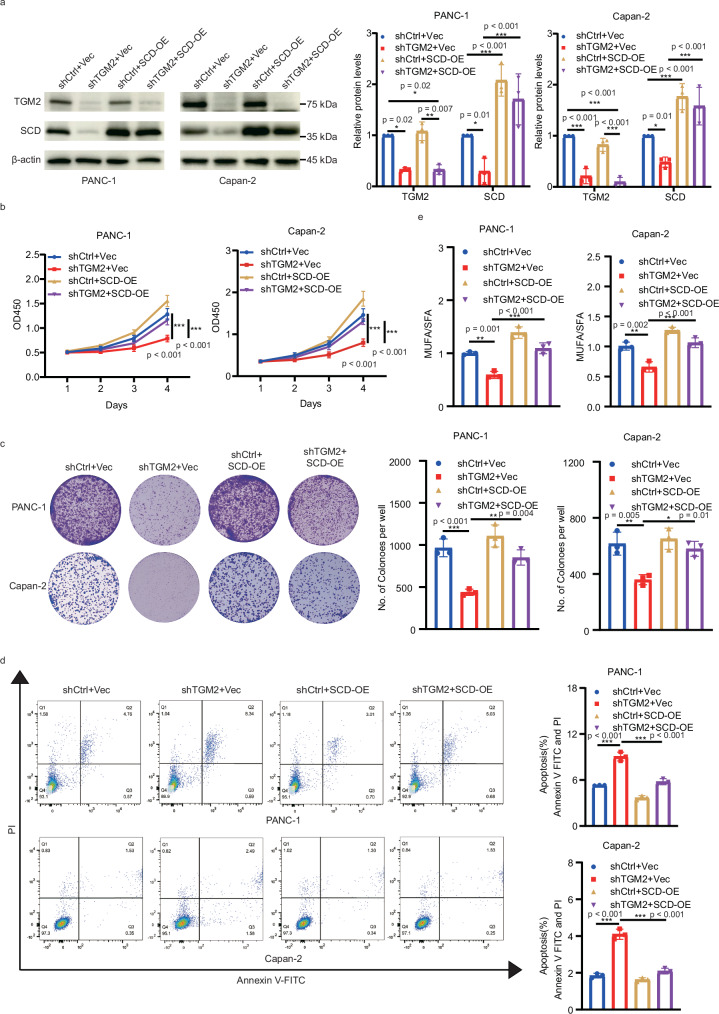
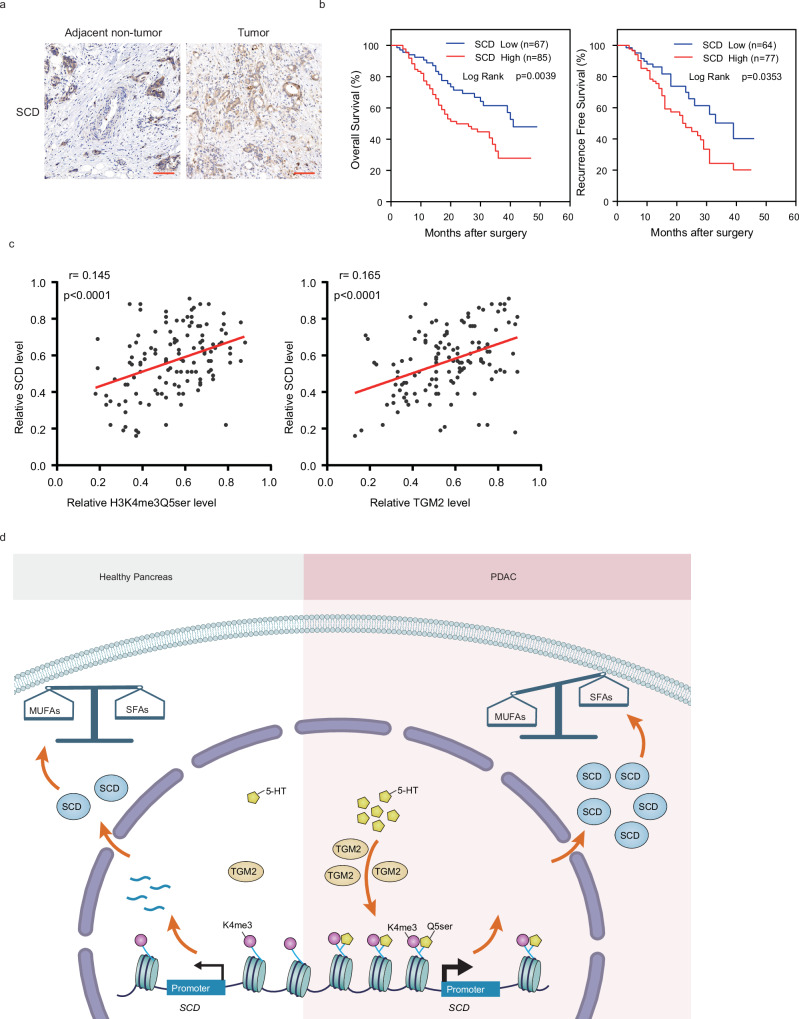
Neurotransmitter serotonin (5-hydroxytryptamine [5-HT]) has emerged to play parallel roles in both neurobiology and oncology. Apart from receptor-mediated signaling transduction pattern, serotonin can be covalently integrated into histone (the post-translational modification known as histone serotonylation) and serve as an epigenetic mark associated with permissive gene expression. However, how histone serotonylation influences tumorigenesis is yet to be understood. In this study, we observe the higher levels of histone serotonylation (H3K4me3Q5ser) and transglutaminases 2 (TGM2, the enzyme catalyzing serotonylation) in both pancreatic ductal adenocarcinoma (PDAC) tissues and cell lines in comparison with their normal counterparts, and inhibition of histone serotonylation suppresses PDAC development. Mechanistically, we demonstrate that TGM2-mediated histone serotonylation at promoter of the gene encoding stearoyl-CoA desaturase (SCD) up-regulates its expression and drives PDAC development by lipid metabolism remodeling. Collectively, this study reveals histone serotonylation as an important driver of PDAC tumorigenesis.


Conflict of interest statement

Competing interests: The authors declare no competing interests.

Figures

Fig. 1
Fig. 1. H3K4me3Q5ser and TGM2 are increased in PDAC and associated with an unfavorable prognosis.
a 5-HT levels in matched adjacent non-tumor (N) and tumor (T) specimens from PDAC patients (n = 5 samples per group). Paired two-sided Student’s t-test with no correction for multiple comparison. b Immunohistochemistry (IHC) staining of H3K4me3Q5ser and TGM2 in PDAC tumor and adjacent non-tumor samples. Scale bars: 50 μm. c Kaplan–Meier curves of H3K4me3Q5ser level with OS and DFS in PDAC patients. d Kaplan–Meier curves of TGM2 level with OS and DFS in PDAC patients. e Pearson correlation analysis of TGM2 expression and H3K4me3Q5ser level in PDAC tumor and adjacent non-tumor samples (n = 130 samples). f Western blot (WB) showed H3K4me3Q5ser and TGM2 levels in PDAC cell lines and the immortalized human pancreatic epithelial cell line HPNE. The statistical graph showed H3K4me3Q5ser and TGM2 relative levels normalized to H3 and β-actin, respectively. Bars represent the mean ± SD (n = 3 independent experiments). g Immunofluorescence (IF) of H3K4me3Q5ser (green), TGM2 (green), and DAPI (blue) in PANC-1, Capan-2 and HPNE. Scale bars: 10 μm. *p < 0.05,**p < 0.01, ns, not significant. Unpaired two-sided Student’s t-test with no correction for multiple comparison. Source data are provided as a Source Data file.
Fig. 2
Fig. 2. TGM2 knockdown decreases H3K4me3Q5ser level and suppresses PDAC progression.
a WB and statistical graph showed TGM2 and H3K4me3Q5ser levels relative to β-actin and H3, respectively. The data were presented the mean ± SD (n = 3 independent experiments). b The CCK-8 assay showed the proliferation ability of PANC-1 and Capan-2 upon TGM2 knockdown. The data were presented as the mean ± SD (n = 3 independent experiments). c, d The colony formation assay showed the growth ability of PANC-1 (c) and Capan-2 (d) upon TGM2 knockdown. The data were presented as the mean ± SD (n = 3 independent experiments). e, f Cell apoptosis analysis of PANC-1 and Capan-2 upon TGM2 knockdown(e). The data were presented as the mean ± SD (n = 3 independent experiments) (f). g, h Quantitative analysis of tumor size of shTGM2 PANC-1 cells or control cells subcutaneously injected into nude mice (n = 5 mice per group), including a representative picture of tumors and tumor volume (g), tumor weight (h). The data were presented as the mean ± SD. i IHC of TGM2 and Ki67 expression in xenografted tumors. Scale bars: 50 μm.*p < 0.05, **p <  0.01, ***p < 0.001. Unpaired two-sided Student’s t-test with no correction for multiple comparison. Source data are provided as a Source Data file.
Fig. 3
Fig. 3. Histone serotonylation regulates PDAC progression.
a WB showed H3K4me3Q5ser level in H3.3 and H3.3Q5A PDAC cells compared to their corresponding controls (n  =  3 independent experiments). b CCK8 assays were performed to determine cell proliferation of H3.3 or H3.3Q5A expressing PDAC cells. c Colony formation assays of H3.3 or H3.3Q5A expressing PDAC cells. d Cell apoptosis analysis of H3.3 or H3.3Q5A expressing PDAC cells. n = 3 independent experiments (bd). e Tumor growth in the xenograft mouse model established with H3.3 or H3.3Q5A expressing PANC-1 cells (n = 5 mice per group). The data were presented as the mean ± SD. **p < 0.01,***p < 0.001. Unpaired two-sided Student’s t-test with no correction for multiple comparison. Source data are provided as a Source Data file.
Fig. 4
Fig. 4. Identification of the H3K4me3Q5ser targets in PDAC cells.
a Volcano plots showed differentially expressed genes (DEGs) identified in TGM2-deficient PANC-1 and control cells. b Gene ontology (GO) enrichment analysis of down-regulated genes in shTGM2 PANC-1 group compared to control. c Distribution of H3K4me3Q5ser sites relative to transcription start site (TSS) across PANC-1 genome. d Venn diagram depicting the down-regulated genes upon TGM2 knockdown and H3K4me3Q5ser-modified genes in PANC-1 cells. e GO analysis of 343 genes described in (d). f IGV tracks for SCD from ChIP-seq and RNA-seq data of TGM2-knockdown PANC-1 and control cells. g ChIP-qPCR detected H3K4me3Q5ser modification at SCD promoter region in HPNE and PANC-1 cell lines. h ChIP-qPCR detected H3K4me3Q5ser modification at SCD promoter region in PDAC cell lines (PANC-1 and Capan-2) upon TGM2 knockdown. i WB showed SCD and TGM2 levels relative to β-actin. All statistical data were presented as the mean ± SD (n = 3 independent experiments). *p < 0.05, **p < 0.01, ***p < 0.001, ns, not significant. Unpaired two-sided Student’s t-test with no correction for multiple comparison. Source data are provided as a Source Data file.
Fig. 5
Fig. 5. SCD promotes PDAC tumorigenesis via lipid metabolism remodeling.
a WB showed SCD expression in SCD knockdown PDAC cell lines (PANC-1 and Capan-2) and their corresponding controls. b CCK8 assays were performed to determine cell proliferation upon SCD knockdown. c Colony formation assays of PANC-1 and Capan-2 cells upon SCD knockdown. d Cell apoptosis analysis of PANC-1 and Capan-2 upon SCD knockdown. e The MUFA/SFA ratios of SCD-knockdown PDAC cell lines and control groups. f The MUFA/SFA ratios of TGM2-knockdown PDAC cell lines and control groups. All statistical data were presented as the mean ± SD (n = 3 independent experiments).*p < 0.05,**p <  0.01,***p < 0.001. Unpaired two-sided Student’s t-test with no correction for multiple comparison. Source data are provided as a Source Data file.
Fig. 6
Fig. 6. Tumor-promoting effect caused by SCD or TGM2 knockdown can be rescued by oleic acid.
a CCK8 assay was performed in SCD-knockdown PDAC cells with supplementation of oleic acid (OA). b CCK8 assay was performed in TGM2-knockdown PDAC cells with supplementation of OA. c Cell apoptosis assay was performed in SCD-knockdown PDAC cells with supplementation of OA. d Cell apoptosis assay was performed in TGM2-knockdown PDAC cells with supplementation of OA. All data were presented as the mean ± SD (n = 3 independent experiments). *p < 0.05, **p < 0.01, ***p < 0.001. unpaired two-sided Student’s t-test with no correction for multiple comparison. Source data are provided as a Source Data file.
Fig. 7
Fig. 7. Histone serotonylation-activated SCD promotes PDAC progression.
a WB showed TGM2 and SCD expression relative to β-actin in SCD-overexpressed PDAC cells upon TGM2 knockdown. b–d CCK8 (b), colony formation (c) and cell apoptosis (d) assays were performed in SCD-overexpressed PDAC cells upon TGM2 knockdown, respectively. e The MUFA/SFA ratios of SCD-overexpressed PDAC cells upon TGM2 knockdown. All statistical data were presented as the mean ± SD (n = 3 independent experiments). *p < 0.05, **p <  0.01, ***p < 0.001. Unpaired two-sided Student’s t-test with no correction for multiple comparison. Source data are provided as a Source Data file.
Fig. 8
Fig. 8. Clinical relevance of SCD expression in PDAC.
a IHC of SCD expression in PDAC tumor and adjacent non-tumor tissues. Scale bars: 50 μm. b Kaplan-Meier analysis of OS and DFS showed the difference between PDAC patients with low and high SCD expression, respectively. c Pearson’s correlation analysis in PDAC patients between SCD levels and the levels of H3K4me3Q5ser and TGM2, respectively (n = 130 samples). Unpaired two-sided Student’s t-test with no correction for multiple comparison. d Working model showing the role of histone serotonylation-mediated SCD up-regulation during PDAC development. This picture was drawn by Figdraw. Source data are provided as a Source Data file.

Similar articles

References

    1. Jiang, S. H. et al. Increased Serotonin Signaling Contributes to the Warburg Effect in Pancreatic Tumor Cells Under Metabolic Stress and Promotes Growth of Pancreatic Tumors in Mice. Gastroenterology153, 277–291.e219 (2017). - PubMed
    1. Zhu, P. et al. 5-hydroxytryptamine produced by enteric serotonergic neurons initiates colorectal cancer stem cell self-renewal and tumorigenesis. Neuron110, 2268–2282.e2264 (2022). - PubMed
    1. Jiang, S. H., Hu, L. P., Wang, X., Li, J. & Zhang, Z. G. Neurotransmitters: emerging targets in cancer. Oncogene39, 503–515 (2020). - PubMed
    1. Balakrishna P., George S., Hatoum H., Mukherjee S. Serotonin Pathway in Cancer. Int. J. Mol. Sci.22, 1268 (2021). - PMC - PubMed
    1. Liu, Y., Zhang, H., Wang, Z., Wu, P. & Gong, W. 5-Hydroxytryptamine1a receptors on tumour cells induce immune evasion in lung adenocarcinoma patients with depression via autophagy/pSTAT3. Eur. J. Cancer114, 8–24 (2019). - PubMed

MeSH terms