. 2025 Jul 1;16(1):6016.
doi: 10.1038/s41467-025-61070-z.

Lipoic acid functions in Paneth cells to prevent human intestinal stem cell aging

Affiliations

Lipoic acid functions in Paneth cells to prevent human intestinal stem cell aging

Zehong Zhang et al. Nat Commun. .

Abstract

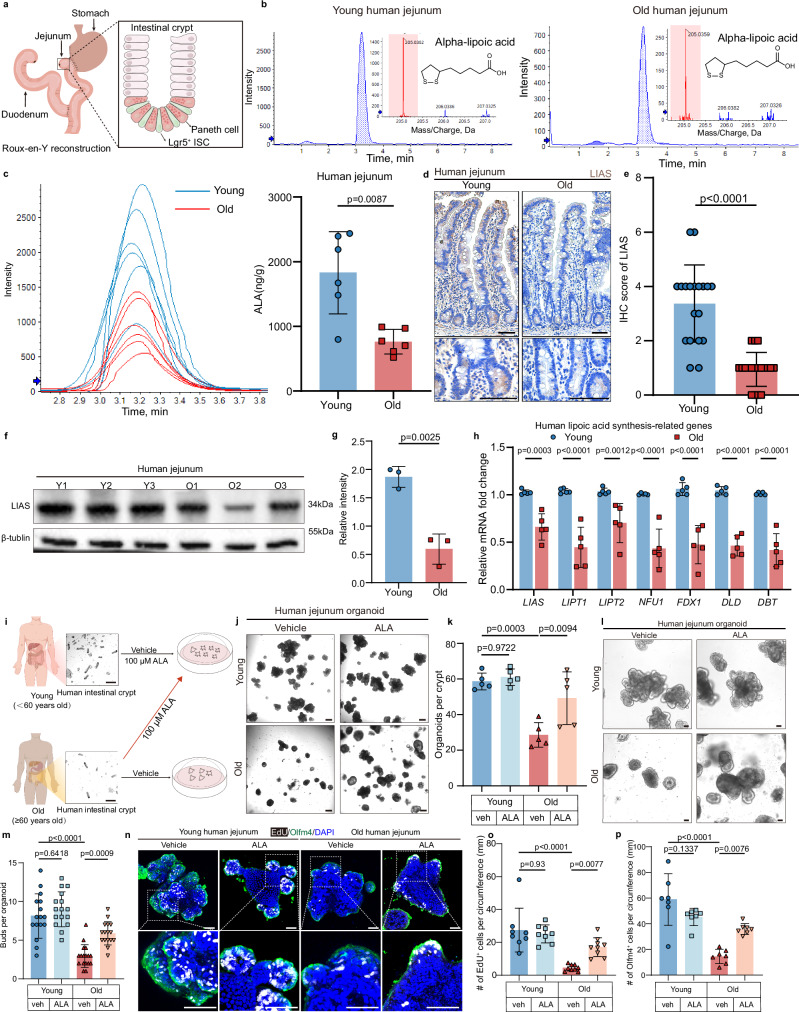
Intestinal stem cell (ISC) aging diminishes the regenerative capacity of the intestinal epithelia, but effective therapeutic strategies to counteract human ISC aging remain elusive. Here, we find that the synthesis of α-lipoic acid (ALA) is reduced in old human small intestine. Notably, ALA supplementation inhibits ISC aging and decreases the number of atypical Paneth cells in old human intestinal organoids and in old mouse small intestines. Importantly, we discern that the effect of ALA on mitigating ISC aging is contingent upon the presence of Paneth cells. Inhibiting the mTOR pathway in Paneth cells with ALA or rapamycin significantly increases cyclic ADP ribose (cADPR) secretion and decreases Notum secretion, which, in turn, enhances ISC functions. In this work, our findings substantiate the role of ALA in inhibiting human ISC aging and present a potential therapeutic approach for managing age-related human intestinal diseases.


Conflict of interest statement

Competing interests: The authors declare no competing interests.

Figures

Fig. 1
Fig. 1. ALA synthesis decreases in small intestines of old human, and ALA supplementation inhibits human ISC aging.
a Schematic of human jejunal tissue collection during Roux-en-Y reconstruction and crypt structure. b LC-ESI-MS/MS chromatograms of ALA in young and old human jejunum. c ALA levels quantified by LC-ESI-MS/MS (n = 6 biologically independent donors per group). d, e Representative LIAS immunohistochemistry (scale bars, 75 μm) in jejunum from young (n = 6) and old (n = 8) donors (d) and quantification (n = 19 crypts per group, from 6 donors) (e). f, g Immunoblot (f) and quantification (g) of LIAS (n = 3 donors per group). h RT-qPCR of LIAS-pathway genes (n = 5 donors per group). i Schematic diagram (scale bars, 250 μm) of small intsetinal organoid culture from young and old human crypts. The figure was created by figdraw.com. jp Organoids from young and old donors treated with vehicle or ALA (100 μM) for 7 days. Representative organoid images (scale bars, 250μm) (j), Organoid number per crypt (n = 6 biologically independent donors/group) (k), representative images of organoid buds (l, scale bars, 75 μm), buds per organoid (n = 16 organoids/group, from 6 donors) (m), organoids stained with DAPI (blue), Olfm4 (green), EdU (white) (scale bars, 100μm) (n), and EdU⁺ cell quantification, from left to right, n = 8, 8, 9, 9 in (o), from 6 donors. Olfm4⁺ cells per organoid (n = 7 organoids, from 6 donors) (p). Each organoid is considered a technical replicate; Human donor is the biological replicate. Data information: Error bars s.d. P values: One-way ANOVA with Tukey’s test (k, m, o, p): (m), p = 1e–8 for young vs old; (o), p = 5e–6 for young vs old; (p), p = 6e–7 for young vs old. Two-way ANOVA analysis followed by Sidak’s multiple comparisons test (h), p = 1e–8 for LIPT1 and DBT, p = 3e–8 for NFU1, p = 2e–8 for FDX1 and DLD. Two-tailed Mann–Whitney U test (c, e), p = 3e–7 for (e). and unpaired, two-tailed t test (g). Source data are provided as a Source Data file.
Fig. 2
Fig. 2. ALA inhibits ISC aging and promotes epithelial regeneration in old mice.
ag Young and old mice were treated with vehicle (veh) or ALA (100 mg/kg/day) in drinking water for 3 months. Experimental design (a), EdU (red) and SOX9(green) staining (b, scale bars, 25μm), yellow arrow: ISCs, and quantification of crypts (ce, n = 16 crypts/group from 7 mice;). TEM analysis of ISC mitochondria (f, scale bars: 1μm and 500 nm; (g), n = 15 ISCs/group from 3 mice). Yellow dashed lines: ISCs; M (red), ISC mitochondria; N (blue), nucleus. hp Crypts from young and old mice were cultured with vehicle or ALA (100 μM) for 6 days. Experimental design (h), representative images of intestinal organoids (i, scale bars, 250 μm), organoid number(j, n = 7 mice/group, each biological replicate represents an independent organoid culture from one mouse), bud morphology (k, scale bars, 50μm), and quantification (l, n = 26 organoids/group from 7 mice), RT-qPCR of Lgr5, Olfm4, and Ascl2 (n = 6 mice/group) (m), staining of DAPI, Olfm4, and EdU (n, scale bars, 50μm); quantification of EdU⁺ and Olfm4⁺ cells (o, p, n = 14 organoids/group from 7 mice) qu Young and old mice were injected with indomethacin (10 mg/kg) for 1 day followed by 7 days vehicle or ALA. Experimental design (q). H&E staining and histology scores (r, s, scale bars, 75μm; n = 5 mice/group), TEM images of crypts (t, 1 μm and 500 nm) and mitochondrial integrity quantification (u, n = 15 cells from 3 mice/group). Yellow lines: ISCs; N (blue), nucleus; M (red), mitochondria. Data are mean ± SD. One-way ANOVA with Tukey’s test (ce, j, l, o, p): (c), p  =  4e–9 (young vs old), 8e–9 (old vs old+ALA); (l), p  =  2e–9 (young vs old); (p), p  =  6e–10 (young vs old), 3e–7 (old vs old+ALA). Two-way ANOVA with Tukey’s (g, m) or Sidak’s test (s, u): (g) within 0–50% mitochondrial integrity, p = 8e–9 (young vs old), 1e–10 (young vs old+ALA, old vs old+ALA); (m) p = 8e–6 for Olfm4 (old vs old+ALA); (u) at 0–50% integrity, p = 2e–7; at 0%, p = 1e–15. Source data are provided as a Source Data file.
Fig. 3
Fig. 3. ALA supplementation restores abnormal Paneth cell accumulation in human and mouse intestines upon aging.
a, b Representative images of Paneth cells (a, scale bars, 50 μm) and quantification in young and old human crypts (b, n = 27 crypts/group from 6 independent donors). ce Diagram of lysozyme distribution patterns: normal (D0), disordered (D1), diminished (D2), diffuse (D3), excluded (D4), enlarged (D5) (c). Representative staining showing lysozyme granules (d, scale bars, 25 μm); white/yellow arrowheads indicate normal/abnormal granules. Quantification of distribution patterns (e, n = 15 crypts/group from independent 6 donors). fj Young and old mice were administered drinking water with vehicle or ALA (100 mg/kg/day) for 3 months. Representative images of Paneth cells (f, scale bars, 75 μm), and quantification (g, n = 33 crypts/group from 7 biologically independent mice), Representative images showing lysozyme granules (h, scale bars, 10 μm; white/yellow arrowheads indicate normal/abnormal granules in Paneth cells). Distribution of lysozyme patterns (i, n = 14 crypts/group from 7 mice). Representative TEM images of Paneth cells (j, scale bars, 1μm; yellow/red stars indicate normal/abnormal granules). k, l Intestinal crypts from young and old humans were cultured with vehicle or ALA (100 μM) for 7 days. Representative lysozyme staining in organoids (k, scale bars, 75μm) and Paneth cell quantification (l, n = 7 organoids/group from 3 independent human donors). mp Mouse intestinal crypts were cultured with vehicle or ALA (100 μM) for 6 days. Representative lysozyme staining (m, scale bars, 75μm) and Paneth cell quantification (n, n = 18 organoids/group from 7 mice). ELISA of Reg3g and Defa6 in organoid supernatants (o, p, n = 3 biological replicates/group). All data are mean ± SD. P values were calculated by unpaired two-tailed t test (b), one-way ANOVA with Tukey’s test (g, l, n, o, p); for (n), p = 6e–9 (young vs old), 8e–5 (old vs old+ALA). Two-way ANOVA with Sidak’s test (e); for (e), p = 2e–8 (young vs old within D0 and D1–D5). Two-way ANOVA with Tukey’s test (i). Source data are provided as a Source Data file.
Fig. 4
Fig. 4. ALA biosynthesis suppression mimics intestinal aging in young mice.
ac Crypts from young mice were cultured for 6 days with vehicle, elesclomol, PF9366, with/without ALA. Schematic of treatment groups (a). LC-ESI-MS/MS chromatograms (b), and ALA quantification (c, n = 3 mice/group). di Representative images (d) (scale bars: 250 μm/50 μm) and quantitation of organoid number (e, n = 5 mice/group) and buds (f, veh: n = 13, elesclomol: n = 16, elesclomol+ALA and PF9366: n = 14, PF9366 + ALA: n = 15 organoids, all from 5 mice). Immunofluorescence for Lgr5-EGFP (green), Lysozyme (red). (g, scale bars, 50 μm, n = 6 mice/group). Quantification of Lysozyme⁺ (h, veh and PF9366 + ALA: n = 25, elesclomol: n = 35, elesclomol+ALA: n = 29, PF9366: n = 22 organoids) and Lgr5⁺ cells (i, veh, elesclomol+ALA, PF9366 + ALA: n = 19 organoids; elesclomol, PF9366: n = 18 organoids, all from 6 mice). jr Young and old mice were injected with veh or elesclomol (j). SOX9⁺ staining (k, scale bars: 25 μm) and quantification (l, n = 10 crypts/group). Lysozyme staining (m, scale bars, 75 μm) and Paneth cell counts (n, n = 15 crypts/group, from 6 mice). Representative lysozyme granule images (o, scale bars, 10 μm; white arrowheads: normal, yellow: abnormal). Percentage of abnormal Paneth cells (p, n = 14 crypts/group). TEM of intestinal crypts (q, red dashed: Paneth cells; yellow: ISCs; yellow/red stars: normal/ abnormal granules; N, nucleus; L, lumen; M, mitochondria; scale bars: 5μm, 1μm) and mitochondrial integrity quantification (r, n = 15 cells/group from 3 mice). Data represent mean ± SD. P values: one-way ANOVA with Tukey’s test (c, e, f, h, i, l, n); f p = 5e−11 (vehicle vs elesclomol), 1e−12 (vehicle vs PF9366); h, p = 4e−10 (veh vs elesclomol), 1e−11 (veh vs PF9366); 4e−13 (elesclomol vs elesclomol+ALA), 4e−11 (PF9366 vs PF9366 + ALA); i, p = 1e−7 (veh vs elesclomol), 7e−8 (veh vs PF9366), 3e−6 (PF9366 vs PF9366 + ALA). Two-way ANOVA with Sidak’s test (p) and Tukey’s test (r); p, within D0, p = 1e–9 for young vs old; within D1–D3, p = 1e–9 for young vs old; r, within the 0–50%, p = 5e–6 (young vs young+elesclomol); within 50–100%, p = 2e–13 (young vs young+elesclomol); Source data are provided as a Source Data file.
Fig. 5
Fig. 5. ALA delays ISC aging through a Paneth cell-dependent mechanism.
af Lgr5hi cells from young Lgr5-EGFP mice and CD24+ Paneth cells from both young and old mice were sorted and co-cultured in matrigel. Schematic diagram illustrating the sorting procedure of ISCs and Paneth cells using flow cytometry (a). Representative FACS plots of Lgr5-EGFP+ cells and CD24+ Paneth cells from the intestinal organoids of young Lgr5-EGFP mice and old C57BL/6 mice (b). (n = 3 biologically independent mice per group). Representative images of Lgr5hi ISCs co-cultured with Paneth cells from young and old mice at day 3 (c) and 8 (d). (scale bars: 250 μm). The number of colonies (e) and buds (f) at day 8. (e): n = 3 biologically independent co-culture replicates per group. (f): n = 9 organoids/group, obtained from 3 biologically independent mice. gk The diagram (g) showing the workflow for preparing conditioned media from organoids of young and old mice. Lgr5hi cells were cultured with conditioned media or conditioned media+ALA. Representative images (h, i, scale bars, 250 μm) of organoids derived from young Lgr5hi ISCs. Quantification of organoids (j) and organoid buds (k) in each group. (j): n = 4 biologically independent mice replicates per group. (k): n = 12 organoids/group, obtained from 4 biologically independent mice. Unless otherwise indicated, data are presented as the mean ± SD. one-way ANOVA with Tukey’s multiple comparison test (e, f, j, k); for (k), p = 1e−7 for young CM vs old CM. Source data are provided as a Source Data file.
Fig. 6
Fig. 6. mTOR pathway activity in Paneth cells of old mice is inhibited by ALA.
af Intestinal organoids of old mice cultured with or without ALA were used for RNA sequencing and RT-qPCR. (n = 3 biologically independent mice per group). Principal-component analysis (PCA) (a) of the transcriptomes. KEGG (b) and GO (c) enrichment analysis of differentially expressed genes. Volcano plot (d). Each dot represents a gene; Blue symbols represent significantly down-regulated mass bins (Log2 FC < −0.4 and p < 0.05), red symbols represent significantly upregulated mass bins (Log2 FC > 0.4 and p < 0.05), while gray symbols indicate non-significantly altered mass bins. Heatmap showing the expression of key genes related to the mTOR signaling pathway (e). The color code shows the Z score for each gene along the whole dataset. mRNA expression of indicated genes (f) (n = 4 biologically independent mice per group). g Crypts isolated from young and old mice were cultured with/without ALA for 6 days (n = 4 biologically independent mice per group). Representative images (scale bars, 50 μm) of immunostaining with pS6 (green), Lysozyme (red) and DAPI (blue) in each group. The dotted circle indicates Paneth cells. h The expression of lysozyme (red) and pS6 (green) was detected in mouse intestinal crypts from different groups by immunofluorescence (scale bars, 100 μm). The dotted circle denotes Paneth cells (n = 7 biologically independent mice per group). i, j Paneth cells were sorted from young and old mice treated with or without ALA (n = 3 biologically independent mice per group). Representative immunoblots of indicated proteins in Paneth cells (i) and quantification of p4E-BP1 and pS6 expression (j) (n = 3 biologically independent mice per group). All data are shown as mean ± SD. Statistical significance was determined by two-way ANOVA analysis followed by Tukey’s multiple comparisons test (j) and Sidak’s multiple comparisons test (f). Source data are provided as a Source Data file.
Fig. 7
Fig. 7. ALA supplementation inhibits ISC aging by regulating the mTOR-dependent cADPR paracrine in Paneth cells.
a Schematic model of stem cell maintenance by Paneth cells in ISC niche. The solid arrows indicate activation and the blunt-ended arrows represent inhibition. b Intracellular cADPR in the sorting Paneth cells using an ELISA kit. Amounts of cADPR were normalized to total protein (n = 3 biologically independent mice per group). c Endogenous cADPR levels in organoids treated with rapamycin, ALA, and MHY1485 were measured using an ELISA kit (n = 3 biologically independent mice per group). di Crypts isolated from old mice were cultured with rapamycin, MHY1485, cADPR and 8-Br-cADPR together with/without ALA. Representative images (scale bars, 250 μm) of mouse intestinal organoids (d), quantification of organoid amount (n = 7 biologically independent mice per group) (e), representative images (scale bars, 50 μm) of organoid buds (f), quantification of bud per organoid (n = 13 organoids/group, obtained from 7 biologically independent mice) (g), representative staining (scale bars, 50μm) of EdU cells (h), quantification of EdU+ cell amount in mouse intestinal organoids(i). (n = 10 organoids/group, obtained from 7 biologically independent mice). j Schematic models of ALA functions in Paneth cells to prevent ISC aging. Data are displayed as mean ± SD. One-way ANOVA analysis followed by Tukey’s multiple comparisons test was used in (b, c, e, g, i). Source data are provided as a Source Data file.

Similar articles

References

    1. Barker, N. Adult intestinal stem cells: critical drivers of epithelial homeostasis and regeneration. Nat. Rev. Mol. Cell Biol.15, 19–33 (2014). - PubMed
    1. Chen, L. et al. Hepatic cytochrome P450 8B1 and cholic acid potentiate intestinal epithelial injury in colitis by suppressing intestinal stem cell renewal. Cell Stem Cell29, 1366–1381 e1369 (2022). - PMC - PubMed
    1. He, D. et al. Gut stem cell aging is driven by mTORC1 via a p38 MAPK-p53 pathway. Nat. Commun.11, 37 (2020). - PMC - PubMed
    1. Nalapareddy, K., Zheng, Y. & Geiger, H. Aging of intestinal stem cells. Stem Cell Rep.17, 734–740 (2022). - PMC - PubMed
    1. Qi, Y. et al. Heat-inactivated Bifidobacterium adolescentis ameliorates colon senescence through Paneth-like-cell-mediated stem cell activation. Nat. Commun.14, 6121 (2023). - PMC - PubMed

MeSH terms

LinkOut - more resources