. 2025 Jul 1;16(1):5835.
doi: 10.1038/s41467-025-60976-y.

Myosin-dependent short actin filaments contribute to peripheral widening in developing stereocilia

Affiliations

Myosin-dependent short actin filaments contribute to peripheral widening in developing stereocilia

Xiayi Liao et al. Nat Commun. .

Abstract

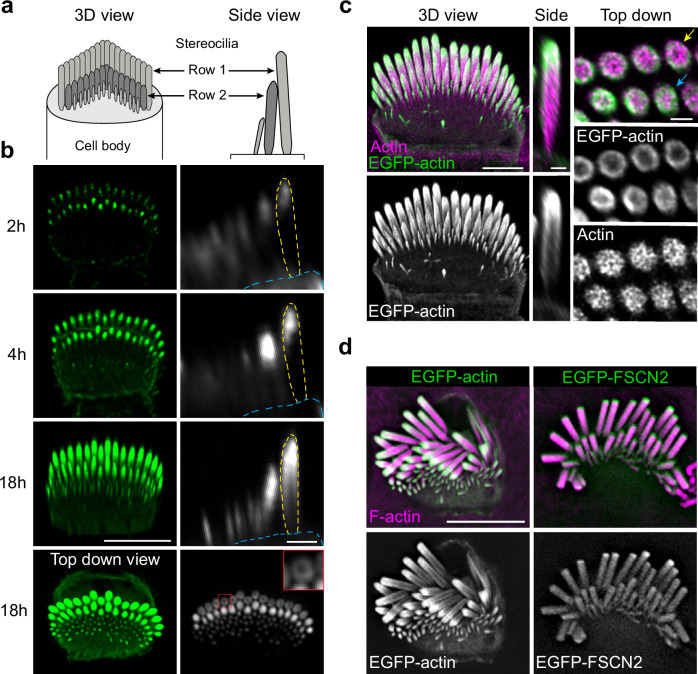
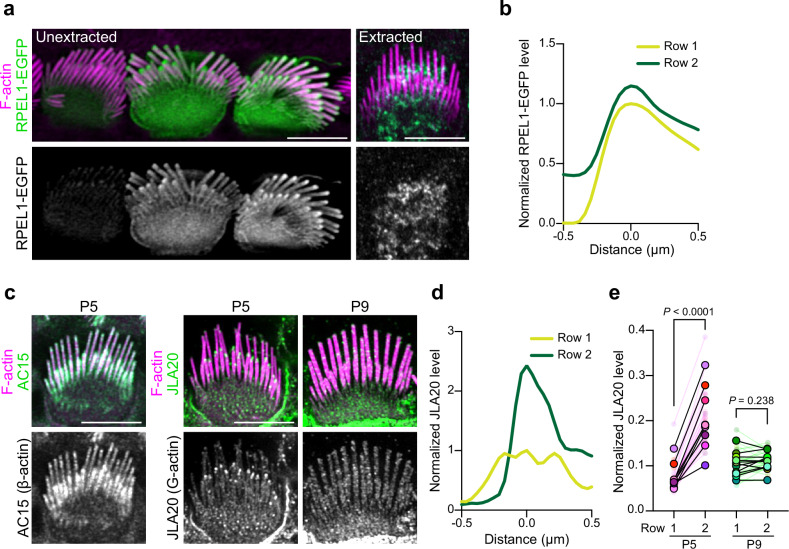
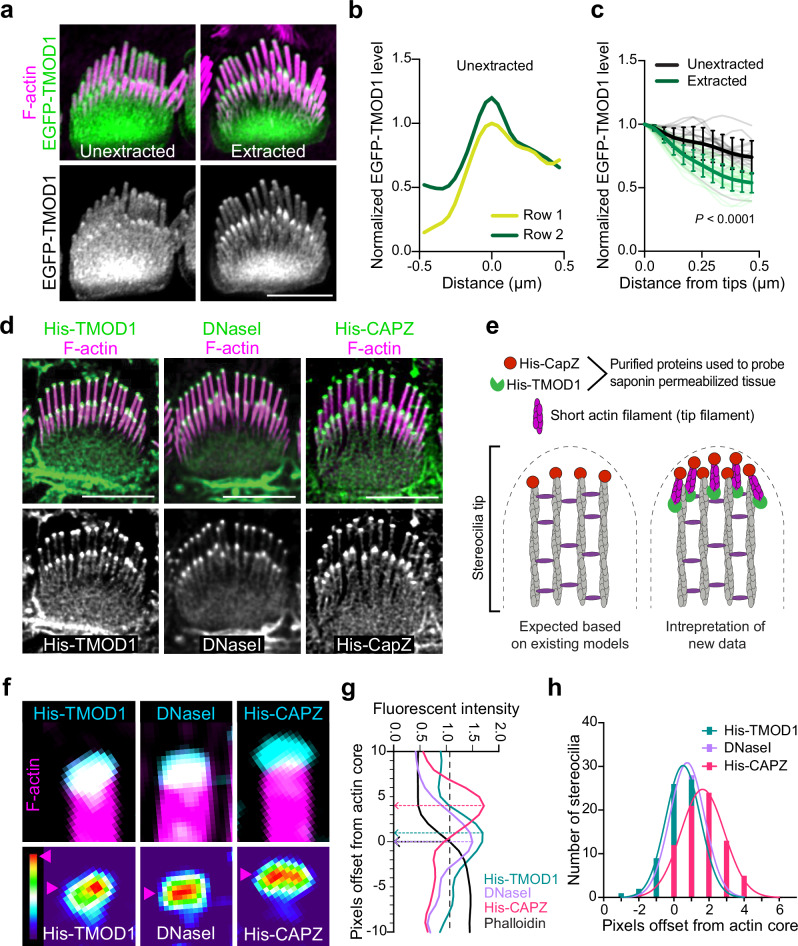
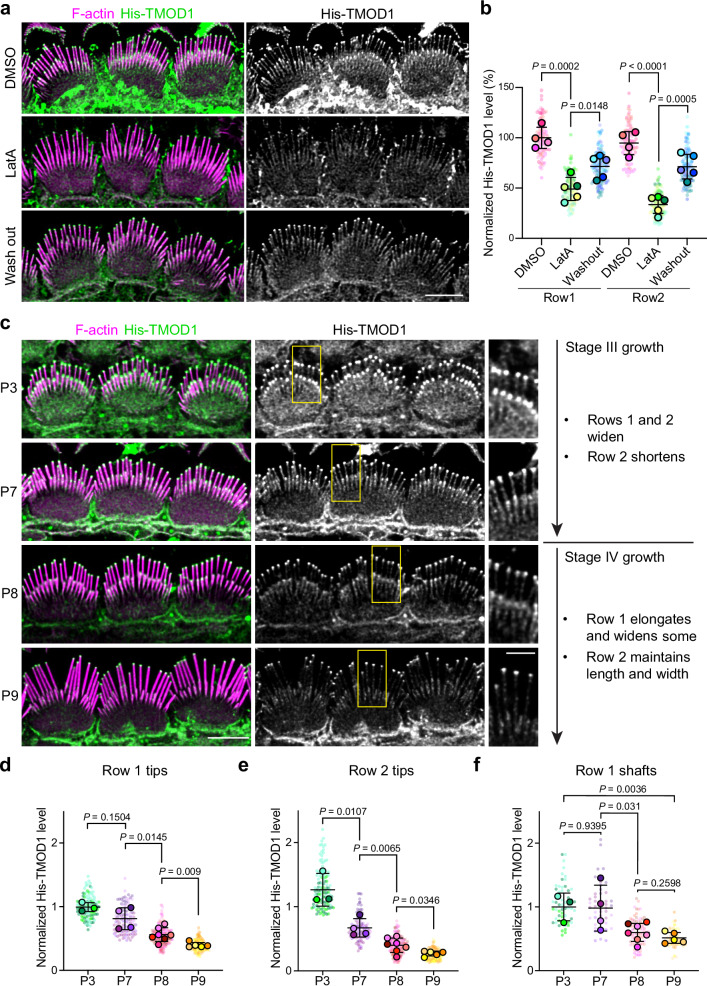
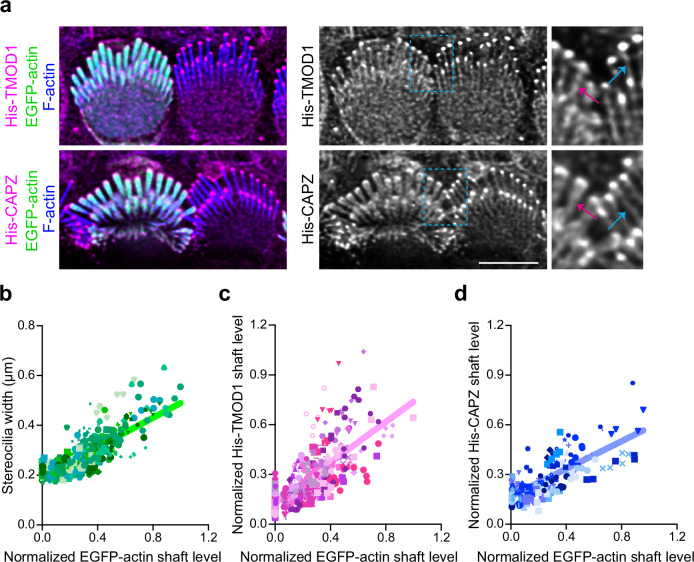
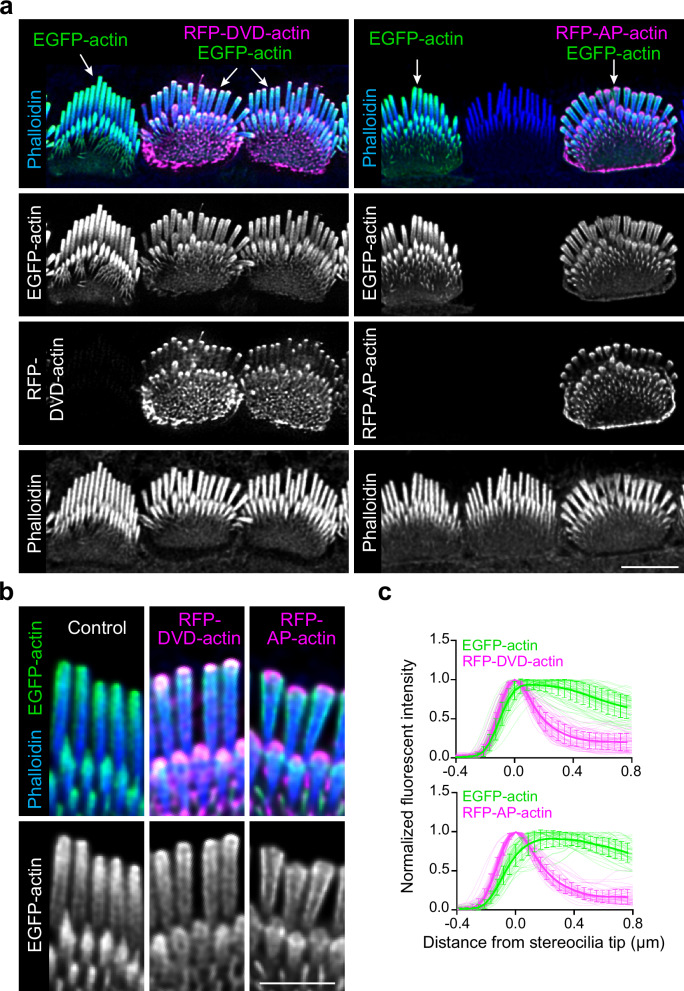
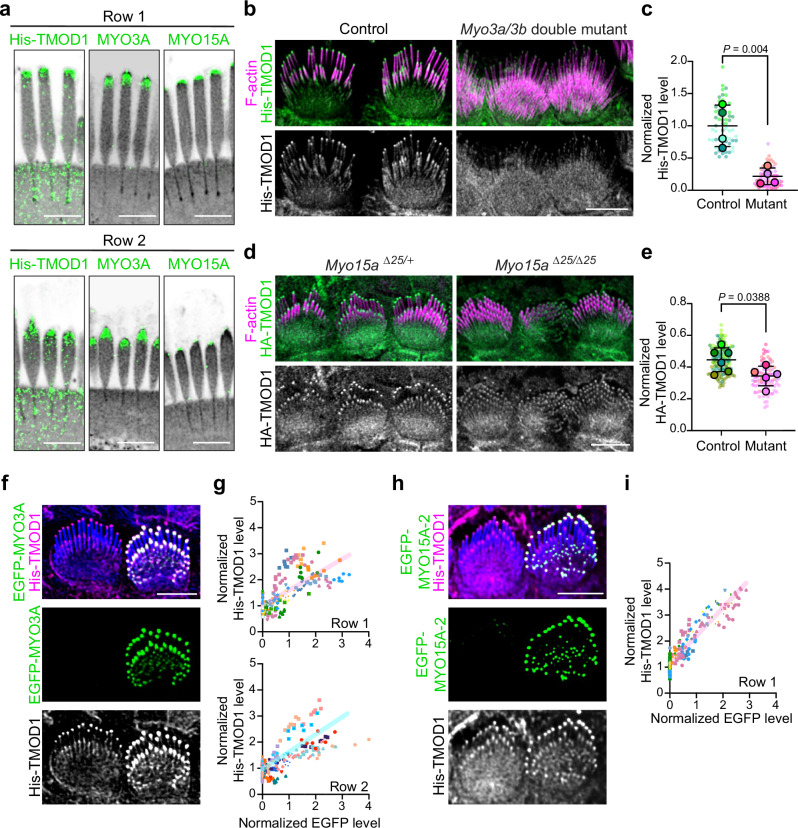
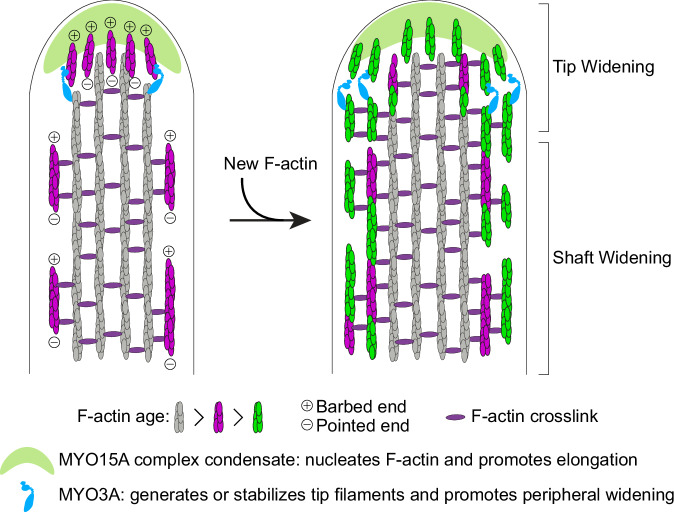
Stereocilia, the actin-based mechanosensory protrusions of inner ear sensory hair cells, require precise dimensional control for proper mechanotransduction, yet the mechanisms governing actin assembly during development remain unclear. Their size and shape are determined by a stable core of long, parallel, unbranched filamentous (F-) actin. We find that during stereocilia widening, which is a key process for function and stability, newly expressed actin first integrates at the tip, then along the periphery of the core. To understand how actin assembles, we probe for globular (G-) actin, F-actin barbed ends, and pointed ends, and identify a tip-enriched population of short actin filaments. Overexpressing actin increases these filaments at the stereocilia periphery, suggesting a role in widening. In addition, the tip-localized myosins MYO3A/B and MYO15A, essential for normal growth, generate or stabilize short filaments. We propose that these short filaments are intermediates that mature into the long F-actin known to comprise the stereocilia core.


Conflict of interest statement

Competing interests: The authors declare no competing interests.

Figures

Fig. 1
Fig. 1. EGFP-actin incorporation pattern during stereocilia widening.
a Diagrams of inner hair cell (IHC) stereocilia, oriented en face in a 3D view and as a side view. b A single P6 IHC imaged at timepoints (from 2 to 18 h) after transfection with EGFP-actin. Left panels are 3D reconstructions oriented en face except for the final image, which is a top-down view (scale bar represents 5 μm). Right panels are side views of stereocilia made from x-z reslices (scale bar represents 1 μm). The outline of a row 1 stereocilium is traced by yellow dashed lines and the cuticular plate is denoted by blue dashed lines. The lowest panel is an x-y slice showing stereocilia in cross-section mid-way down row 1 stereocilia. The inset (1 ×1 μm), a magnified region marked by a red box, demonstrates peripheral EGFP-actin localization around row 1 stereocilia. c P5 IHC 18 h post EGFP-actin transfection imaged by expansion microscopy, stained with antibodies against β-actin (ACTB) (magenta) and EGFP (green). Panels show a 3D reconstruction (Scale bar represents 10 μm), a x-z reslice through the center of stereocilia, and a top-down view of x-y slice (Scale bars represent 2 μm). Yellow and blue arrows indicate row 1 and row 2, respectively. d Lattice SIM images of EGFP-actin or EGFP-FSCN2 (green and grey) from P5 IHCs 18 h post transfection with phalloidin-stained F-actin (magenta). Scale bar represents 5 μm. bd The experiments were repeated three times with similar results.
Fig. 2
Fig. 2. G-actin is enriched at stereocilia tips.
a IHCs 18 h post transfection with RPEL1-EGFP, unextracted or extracted by saponin before fixation. F-actin was stained with phalloidin (magenta). The experiments were repeated three times with similar results. b Representative line scans drawn down the center of stereocilia in RPEL1-EGFP transfected, unextracted IHCs at P5. In (b) and (d), line scans were drawn from tip towards the base down the center of stereocilia, the peak fluorescent signal was set as 0 on x axis, and the fluorescent intensity was normalized to the row 1 maximum. c Images of IHCs from saponin-permeabilized P5 or P9 mouse organ of Corti that was probed before fixation with antibodies against β-actin (AC15) or G-actin (JLA20) (green and grey); F-actin was counterstained post-fixation with phalloidin (magenta). d Representative line scans of JLA20 stained P5 IHC stereocilia. e Quantification of JLA20 level at stereocilia tips normalized to the average intensity of cell junctions. Sample size (cells, cochleae): P5 (24, 9), P9 (33, 11). Smaller circles represent the average value of stereocilia tips from individual cells. Larger open circles represent the average value of cells from one individual cochlea (N). P values from two-tailed paired t tests based on N are indicated. P < 0.05 is considered statistically significant. Scale bars represent 5 μm. Source data are provided as a Source Data file.
Fig. 3
Fig. 3. F-actin barbed ends and F-actin pointed ends are present at stereocilia tips.
a EGFP-TMOD1 transfected P5 IHCs, either unextracted or extracted by saponin before fixation, that were also stained with phalloidin for F-actin (magenta). b Representative line scans drawn down the center of stereocilia of EGFP-TMOD1 transfected, unextracted P5 IHCs. The peak EGFP level was set as 0 on x axis and the fluorescence intensity was normalized to the maximal fluorescence intensity of row 1. c Line scans quantifying EGFP-TMOD1 levels from stereocilia tips toward shafts in saponin-extracted or unextracted P5 IHCs. Sample size (stereocilia, cells, cochleae): unextracted (18, 6, 2), extracted (33, 11, 3). The shadow lines represent individual stereocilia; the thick solid lines are the average level of all stereocilia. The data were plotted as mean ± SD and analyzed by two-way ANOVA (P < 0.0001 for the effects of extraction, distance from stereocilia tips, and interactions between these parameters, based on stereocilia). d His-TMOD1, DNaseI, or His-CAPZ (green, grey) localization after probing permeabilized IHCs at P5-6. F-actin was stained with phalloidin (magenta). The experiments were repeated three times with similar results. e Diagrams of potential actin structures in stereocilia with F-actin barbed and pointed ends bound by His-CAPZ and His-TMOD1, respectively. f Lattice SIM images of His-TMOD1, DNaseI, and His-CAPZ (cyan, thermal lookup table) at row 1 stereocilia tips with phalloidin-stained F-actin (magenta), which were quantified in (g, h). Magenta arrowheads denote the position of peak fluorescence intensity. g Representative line scans drawn down the center of stereocilia showing the intensity of His-TMOD1 (blue), DNaseI (purple), His-CAPZ (red), and F-actin actin (black). The stereocilia tip is indicated by black dashed arrow. Peak intensities for His-TMOD1, DNaseI, and His-CAPZ are indicated by colored dashed arrows. The offsets of the probe centers from the stereocilia tips were determined and plotted in (h). h A frequency histogram showing the pixel offsets of His-TMOD1 (blue), DNaseI (purple), and His-CAPZ (red) from the stereocilia tip. Sample size (stereocilia, cells, cochleae) of each probe (75, 15, 3). The histogram of each probe is fitted with a Gaussian curve. Mean offsets for peak of the Gaussian curves based on the pixel size (31 nm x 31 nm): His-TMOD1, 16 nm; DNaseI, 24 nm; His-CAPZ, 51 nm. R-squared value of the fit: His-TMOD1, 0.996; DNaseI, 0.976; His-CAPZ, 0.982. Scale bars represent 5 μm. Source data are provided as a Source Data file.
Fig. 4
Fig. 4. Tip filament levels during development of apical IHCs.
a His-TMOD1 staining (green, grey) of P5 IHCs after 1-hour latrunculin A (LatA) treatment and 4-hour recovery following washout; F-actin stained with phalloidin (magenta). b Quantification of His-TMOD1 level from row 1 and row 2 stereocilia tips. Sample size (stereocilia, cells, cochleae): DMSO (100, 20, 4), LatA or washout (125, 25, 5). The fluorescence intensity was normalized to the average fluorescence intensity of row 1 stereocilia from DMSO-treated samples and plotted as mean ± SD based on cochleae. Scale bar represents 5 μm. c Left panels are His-TMOD1 labeling (green, grey) of apical IHCs at P3, 7, 8, and 9. F-actin in stereocilia was stained with phalloidin (magenta). Scale bar represents 5 μm. Regions marked by yellow boxes are magnified to the side (Scale bar represents 2 μm). The timeline on the right is of IHC bundle development in mouse cochlea showing the growth details of specific rows during stage III and IV. d, e Quantification of His-TMOD1 level from stereocilia tips at P3, 7, 8, and 9. Sample size (stereocilia, cells, cochleae): P3 (119, 17, 3), P7 (112, 16, 4), P8 (189, 27, 7), P9 (126, 18, 5). Row 1 and 2 are separately plotted. f Quantification of His-TMOD1 level from row 1 stereocilia shafts at P3, 7, 8, and 9. Sample size (stereocilia, cells, cochleae): P3 (57, 19, 3), P7 (48, 16, 4), P8 (81, 27, 7), P9 (54, 18, 5). Fluorescence quantifications from (d) to (f) were normalized to the average fluorescence intensity of the row 1 level from P3 samples and plotted as mean ± SD based on cochleae. In (b) and (df), Normalized His-TMOD1 level from individual stereocilia were plotted as small dots with the color corresponding to their cochleae, represented as larger open circles. P values from two-tailed unpaired t tests comparing cochlea averages are indicated. P < 0.05 is considered statistically significant. Source data are provided as a Source Data file.
Fig. 5
Fig. 5. Stereocilia widening correlates with increased F-actin barbed and pointed levels in the shaft.
a His-TMOD1 or His-CAPZ (magenta, grey) labeling in permeabilized IHCs 18 h after transfection with EGFP-actin (green). F-actin is stained with phalloidin (blue) to show stereocilia. Regions of interest are denoted by light blue dashed boxes and magnified to the right. For comparison, stereocilia shaft labeling of His-TMOD1 or His-CAPZ is indicated by blue arrows in untransfected cells and magenta arrows in EGFP-actin transfected cells. bd Graphs showing the linear correlation of the EGFP-actin level in the stereocilia shaft with stereocilia width (b), His-TMOD1 shaft staining (c), and His-CAPZ shaft staining (d). Stereocilia are plotted as individual symbols and those from the same cell are represented by identical color and shape. Simple linear regression analysis was applied to the data. R-squared values for linear regressions from (b) to (d) are 0.66, 0.52, 0.55, respectively. Sample size (stereocilia, cells, cochleae): Width (592, 119, 22), His-TMOD1 (420, 84, 13), His-CAPZ (172, 35, 9). Scale bar represents 5 μm. Source data are provided as a Source Data file.
Fig. 6
Fig. 6. Polymerization-incompetent mutant actin disrupts the incorporation of wild-type actin at stereocilia tips.
a IHCs 18 h after transfection with EGFP-actin (green) and mutant actins (magenta). Left panels: IHCs transfected with EGFP-actin alone or in combination with RFP-DVD-actin; Right panels: IHC transfected with EGFP-actin alone or in combination with RFP-AP-actin, adjacent to an untransfected IHC. White arrows denote the transfected constructs; selected regions are magnified in (b). Scale bar represents 5 μm. b Magnified insets from left to right: expression of EGFP-actin only, co-expression of EGFP-actin with RFP-DVD-actin or RFP-AP-actin. Scale bar represents 1 μm. c Line scans quantifying the fluorescence distribution of RFP-mutant actin relative to EGFP-actin from the co-transfected IHCs. The peak RFP level was set as 0 on x axis and the fluorescence intensity was normalized to the maximal fluorescence intensity of row 1. The line scan results were collected from −0.4 μm (above tips) to 0.8 μm (below tips) on x axis as described. The shadow lines represent individual stereocilia; the thick solid lines with error bars are the average level of all stereocilia with SD. Sample size (stereocilia, cells): DVD-actin (57, 19), AP-actin (48, 16). Source data are provided as a Source Data file.
Fig. 7
Fig. 7. Tip filaments depend on tip-localized myosins.
a Representative images of His-TMOD1 stained row 1 stereocilia and row 2 stereocilia, co-labeled after expansion microscopy with antibodies to endogenous MYO3A or MYO15A (green) from P5 mice. NHS-ester (grey) stained total protein. The experiments were repeated three times with similar results. b His-TMOD1 (green, grey) labeling in Myo3 double mutant (Myo3aΔ14/Δ14 Myo3bΔ12/Δ12, noted in Supplementary Fig. 6a) and littermate control IHCs at P4. c Quantification of His-TMOD1 level from the tips of row 1 stereocilia in Myo3a;Myo3b G0 mutants generated via i-GONAD (Supplementary Fig. 6a) and in littermate control IHCs, each at P4. Sample size (stereocilia, cells, cochleae/mice): control (60, 12, 4), mutant (60, 12, 4). d HA-TMOD1 (green, grey) labeling in Myo15a mutant (Myo15aΔ25/Δ25) and littermate control (Myo15aΔ25/+) IHCs at P4. e Quantification of HA-TMOD1 level from the tips of row 1 stereocilia in Myo15a mutant and littermate control IHCs (P4). Sample size (stereocilia, cells, cochleae): control (125. 25, 6), mutant (85, 17, 5). In (c) and (e), normalized TMOD1 level from individual stereocilia were plotted as small dots with the color corresponding to their cochleae, represented as larger open circles. Results were plotted with mean ± SD based on cochleae. P values for two-tailed unpaired t tests are indicated. P < 0.05 is considered statistically significant. f His-TMOD1 (magenta, grey) labeling of an IHC 18 h after transfection with EGFP-K50R-MYO3A (green) and a neighboring untransfected cell (P5). F-actin was stained by phalloidin (blue). g Graphs of His-TMOD1 and EGFP-K50R-MYO3A level at row 1 or row 2 stereocilia tips. Simple linear regression analysis was applied and R-squared values were 0.52 (row 1) and 0.51 (row 2). h His-TMOD1 (magenta, grey) labeling of an IHC 18 h after transfection with EGFP-MYO15A-2 (green) and a neighboring untransfected cell (P5). i Graph of His-TMOD1 and EGFP-MYO15A-2 level at row 1 stereocilia tips. Simple linear regression analysis was applied and R-squared value was 0.88. Sample size (stereocilia, cochleae) in (g) and (i): MYO3A (245, 10), MYO15A (238, 9). Scale bars represent 5 μm. Source data are provided as a Source Data file.
Fig. 8
Fig. 8. Model for stereocilia widening by the addition of short actin filaments.
The drawing depicts a longitudinal section of a widening stereocilium and a hypothetical widening mechanism consistent with the data in this study. The grey filaments are long, stable core filaments bundled by F-actin crosslinks and new actin filaments are added to widen and stabilize the tip or the shaft. At the first timepoint, there are short actin filaments, shown in magenta, at the tip and along the periphery of the core. Tip widening occurs as these filaments form at the tip and are captured and stabilized by MYO3A. The source of tip filaments is unknown, but the MYO15A-dependent elongation complex is a favored candidate. Short filaments along the shaft, nucleated by an unknown mechanism, are extended by new actin to produce stable core filaments. Additional short filaments form along the periphery as widening continues.

Update of

Similar articles

References

    1. Tilney, L. G., Derosier, D. J. & Mulroy, M. J. The organization of actin filaments in the stereocilia of cochlear hair cells. J. Cell Biol.86, 244–259 (1980). - PMC - PubMed
    1. Schneider, M. E., Belyantseva, I. A., Azevedo, R. B. & Kachar, B. Rapid renewal of auditory hair bundles. Nature418, 837–838 (2002). - PubMed
    1. Krey, J. F. et al. Mechanotransduction-dependent control of stereocilia dimensions and row identity in inner hair cells. Curr. Biol.30, 442–454.e447 (2020). - PMC - PubMed
    1. Krey, J. F. et al. Control of stereocilia length during development of hair bundles. PLoS Biol.21, e3001964 (2023). - PMC - PubMed
    1. Rzadzinska, A. K., Schneider, M. E., Davies, C., Riordan, G. P. & Kachar, B. An actin molecular treadmill and myosins maintain stereocilia functional architecture and self-renewal. J. Cell Biol.164, 887–897 (2004). - PMC - PubMed

LinkOut - more resources