. 2025 Jul 1;16(1):5748.
doi: 10.1038/s41467-025-60990-0.

Evolutionary regulation of human Fas ligand (CD95L) by plasmin in solid cancer immunotherapy

Affiliations

Evolutionary regulation of human Fas ligand (CD95L) by plasmin in solid cancer immunotherapy

Brice E N Wamba et al. Nat Commun. .

Abstract

Despite sharing >98% genomic similarity, humans are more likely to develop cancers than our closest living ancestors, the nonhuman primates. Here, we unexpectedly discover that, unlike chimpanzee and other primates, a critical embryonic development, immune homeostasis, and general cell-death regulator protein called Fas Ligand (FasL) contains a Pro153-Ser153 evolutionary substitution in humans. The latter renders human FasL preferentially susceptible to cleavage by plasmin, an overly elevated protease in solid tumors. Since FasL-mediated killing of tumor cells by activated T-lymphocytes and chimeric antigen receptor T-cells (CAR-T) is critical for therapeutic efficacy, we find that elevated plasmin levels in certain ovarian tumors interfere with the T-lymphocyte-expressed FasL death signaling. Either targeted inhibition or blocking plasmin accessibility to membrane FasL rescues the FasL cell-death function of activated T-lymphocytes in response to immune-checkpoint receptor targeting antibodies. These findings of evolutionary significance highlight that elevated plasmin in metastatic tumors potentially contributes to differential outcomes of T-cell-based immunotherapies in solid tumors.


Conflict of interest statement

Competing interests: The authors declare no competing interests.

Figures

Fig. 1
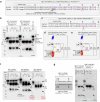
Fig. 1. Proline to serine substitution at position 153 in HuFasL.
a Amino acid alignment of the FasL membrane proximal ECD from different primates. b Ribbon depiction of FasL monomer. c FasL A and H beta-strands are highlighted along with their connecting loops. R144, K145 (red), S153/P153 (left/right red), F269 (green), E271 (blue) are shown as sticks. d SEC chromatograms of indicated FasL are shown with different colors.
Fig. 2
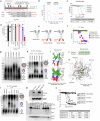
Fig. 2. HuFasL is preferentially cleaved by plasmin.
a Top: showing schematic and location of potential ADAM10 cleavage sites in huFasL. Bottom: RhFasL and huFasL were incubated with ADAM10 for indicated times followed by immunoblotting (reducing condition) with anti-FasL antibody. Representative blot is n = 1. b RhFasL and huFasL were incubated with plasmin (Pln) for indicated times followed by immunoblotting (reducing condition) for FasL and plasmin. Representative blot is n = 1, however it has been repeated multiple times in manuscript with additional parameters. c Schematic of genetic construction of his-tagged 1X and 2XFasL constructs described in (d). d Indicated RhFasL and huFasL were incubated with Pln for O/N followed by immunoblotting for FasL. Representative blot is n = 1. e The kinetic binding behavior of huFasL and RhFasL was analyzed against fixed and immobilized human plasmin at indicated pH values. f Schematic of myc-tagged membrane attached FasL ECDs. g Indicated membrane FasL-expressing cells were treated with Pln followed by immunoblotting against c-myc. Representative blot is n = 1. h Cell survival assay after HuFasL/RhFasL ± Pln treatment (n = 3, three independent experimental repeats) Untreated vs. huFasL, ****p = <0.0001; Untreated vs. huFasL+Pln, *p = 0.0214; Untreated vs. RhFasL, ****p = <0.0001; Untreated vs. RhFasL+Pln, ****p = <0.0001 < 0.0001; Unpaired, two-sided parametric t-test with no adjustments. i Same as (h), except lysates were analyzed for caspase-8 and PARP. Representative blot is n = 1, however it has been repeated in vivo with additional parameters, see Figs. 8, 9. Error bars in (h) are presented as mean ± standard deviation (SD). In (i) u.c. indicates uncleaved, c. indicates cleaved.
Fig. 3
Fig. 3. HuFasL is selectively cleaved at 144RK145 residues by plasmin.
a Schematic of engineering of random IgG1-conjugated FasL at the end of CH3 domain. Random IgG1 hinge was also engineered with an optimal Pln cleavage site. The detail sequences of two Pln cleavage sites are depicted by scissors and detailed sequences are shown. b If IgG1 hinge is cleaved by Pln: scissor-1, a 47 kDa fragment will release (see box b). If FasL is cleaved by Pln: scissor-2, another 47 kDa fragment will release (see box c). If cleavage occurs at both places (scissor-1 + 2), a ~ 31 kDa fragment will release (see box d). All cleaved fragments and full length (see box a) will have CH2-CH3 domain intact to be recognized by anti-Fc antibody in reducing condition. c Time course Pln cleavage experiment as in (b). Only human IgG1-FasL produced the heightened 31 kDa band. A non-specific band of ~25 kDa is evident in all lanes including untreated. Representative blot is n = 1, however it has been repeated multiple times in manuscript with additional parameters (See Fig. 4, Supplementary Fig. 6). d Same as (c), except along with huFasL144RK145, huFasL144AA145 mutant was tested side-by-side. Representative blot is n = 2, see Supplementary Fig. 6c.
Fig. 4
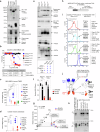
Fig. 4. Mouse FasL is not cleaved at 144RK145 residues rather at site more proximal to transmembrane domain.
a Amino acid alignment of full length ectodomain of human (IgG1-HuFasLL) and mouse (IgG1-MuFasLL) FasL from Q103-L281 residues. An extra N-linked glycosylation site in mouse FasL is evident at 119NQS121 while 144RS145 substitution is present instead of 144RK145. b Same in-vitro IgG1-FasL cleavage assay as in Fig. 3c, d except huFasL and muFasL were tested. Representative blot is n = 1, however it has been repeated in manuscript with additional parameters (See Fig. 4f). c Amino acid alignment of smaller human and mouse FasL (MuFasLS) ECD from P134-L281 residues with 44RS145 still present. d, e Schematic and size comparison of IgG1-MuFasLL and IgG1-MuFasLS. f Same as (b), except IgG1-MuFasLL and IgG1-MuFasLS were compared side by side. Representative blot is n = 2, see Supplementary Fig. 7e. g Same as (f), except along with WT IgG1-MuFasLL, a 123KV-AA124 mutant muFasLL was tested side-by-side. Representative blot is n = 1.
Fig. 5
Fig. 5. FasL stalk-targeting antibodies interfere with plasmin cleavage in vitro and in CAR-T bystander Fas assay.
a Flow cytometry analysis of Nok2 and Nok2h IgG2a binding on CD3 positive cells. b Same in-vitro IgG1-huFasL cleavage assay as in Figs. 3, 4 except huFasL was preincubated with Nok2 and Nok2h IgG2a antibodies (37 °C) either 1 h prior (P) or at the same time (ST) of adding plasmin (Pln). Representative data in blot is n = 3 with experiments done with additional parameters, see Supplementary Fig. 8b, c. c Same as (b), except IgG1-MuFasLL was used. Representative blot is n = 1. d Flow cytometry analysis of 9F5 IgG1 against WR19L (huFasL-) and 1A12 (huFasL+) cells. e IgG1-huFasLL cleavage assay except 9F5 scFv was preincubated 1 h prior to adding Pln (37 °C). Representative blot is n = 1, however it has been repeated in vivo with additional parameters, see Fig. 8g. f Same as (e), except IgG1-MuFasLL was also compared with 9F5 scFv. Representative blot is n = 1, however it has been repeated in vivo with additional parameters, see Fig. 8g. g Cell survival analysis of OVCAR3 cells 24 hr post treatment with huFasLL (his-tag) pre-incubated with ± Nok2h or 9F5 scFv’s or Nok2h IgG2a in presence of Pln. (n = 3, three independent experimental repeats of cell survival) Untreated vs huFasL, ****p = <0.0001; huFasL vs. huFasL+Pln, ***p = 0.0002; huFasL+ Pln-i alone vs huFasL +Pln + Pln-i, nsp=0.1970; huFasL+Pln vs huFasL+Nok2h scFv, ***p = 0.0005; huFasL+Pln vs huFasL+Pln +Nok2h scFv, ***p = 0.0004; huFasL+Pln vs huFasL+Pln +9F5 scFv, ***p = 0.0005; RhFasL vs RhFasL+Pln, nsp=0.3641, huFasL vs huFasL+ Nok2h IgG2a, ***p = 0.0001; huFasL+ Nok2h IgG2a vs huFasL+Pln+ Nok2h IgG2a, nsp =0.2059. Unpaired, two-sided parametric t-test with no adjustments. h Cartoon schematic of anti-NaPi2b (Upifitamab) scFv expressing CAR-T. i Flow cytometry of cell surface expression of CD8 and NaPi2b scFv (top), empty vector (bottom) CAR, as detected using anti-G4S linker antibody. j OVCAR3 (OV3) or HeyA8 (HA8) cells were co-cultured either with CAR-TEV or CAR-TNaPi2b cells at an effector/target (E/T) ratio 5:1 for 4 h followed by granzyme B measurement using ELISA (n = 3+ for granzyme B value measurements in three plus independent experimental repeats). k Schematic of CAR-TNaPi2b cells co-cultured with the 60:40 mix of OVCAR3 and Hey-A8FasKO overexpressing exogenous Fas in presence of ± Pln plus indicated scFv’s on right. l Same as (k), except lysates were analyzed for caspase-8 and PARP via immunoblotting. Representative blot is n = 1. Error bars in (g) are presented as mean ± standard deviation (SD). In (l) u.c. indicates uncleaved, c. indicates cleaved.
Fig. 6
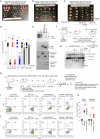
Fig. 6. Differential aggregation profile of human and murine soluble FasL.
a Depiction of HuFasLL(103-281), HuFasLS(134-281) and plasmin-cleaved HuFasLST(146-281) generation. b SEC chromatograms of indicated FasLS forms shown with different colors. huFasLST and RhFasLST are shown in Supplemental Figure 9a. c Cell survival assay after indicated HuFasL treatment. d Cell survival analysis of murine 4T1 cells 24 hr post treatment with his-tagged muFasL L pre-incubated with ± Nok2h or 9F5 scFv’s ± Pln. (n = 3, three independent experimental repeats) Untreated vs. RhFasL, nsp= 0.1753; Untreated vs. huFasL, ***p = 0.0005; Unpaired, two-sided parametric t-test with no adjustments. e Schematic of generation of bispecific Nok2h-FasL proteins used in (f). f Cell viability analysis of murine 4T1 cells treated either with Nok2h-IgG1 alone or Nok2h-IgG1-muFasLL and Nok2h-IgG1-huFasLL. g Indicated various forms of his-tagged human and murine FasL were added onto 4T1 cells for 2 hr in serum free media followed by precipitation of supernatant. The samples were loaded (without boiling) on to non-reducing gels (with 60% lowered SDS conc.) to capture the potential aggregates by FasL immunoblotting. Representative data in blot is n = 1 with experiments done with additional parameters in Fig. 6h, I and Supplementary Fig. 9c. h Indicated various forms of his-tagged human FasL were added into Jurkat cell suspension for 2hrs in serum containing media followed by precipitation of supernatant. The samples were loaded ±pre-heating or ±DTT on to non-reducing gels (with 60% lowered SDS conc.) followed by immunoblotting with anti-FasL antibody. Representative data in blot is n = 1. i Ribbon trace (top) and space filling (bottom) backbone structure of FasL G beta-strand in trimer. Green sticks from Y244-A247 represent c-met interacting YLGA motif. Red and blue sticks highlight R241 and S242. j Comparison of huFasL and muFasL G beta-strand sequence. k A ribbon trace structure of FasL trimer. The dotted circles show each of the monomer. The interface of monomers (specifically G beta-strand) is circled. l Similar to (h) various indicated huFasL mutants were analyzed for their trimerization and aggregation capability on Jurkat cells. Representative data in blot is n = 1. m, n Immunoblotting analysis of total c-met and GAPDH from indicated cell lysates. Representative data in blot is n = 1. o Cell survival analysis (post 36 hr) of indicated c-met expressing cells against increasing concentration of IgG1-huFasL or IgG1-RhFasL. Error bars in (d) are presented as mean ± standard deviation (SD).
Fig. 7
Fig. 7. Limited cytotoxicity of HuFasL against plasmin expressing cancer cells and tumors.
a Lysates from indicated cells on top were tested for PAI-1, uPAR, FasR, and plasmin expression. Representative data in blot is n = 1, however blot has been partly repeated with in vivo tumor parameter in Supplementary Fig. 11a. b Cell survival assays of indicated tumor cells with indicated treatments. c 6–8 week-old mice bearing SQ tumors of MDA-MB231 cells were i.p. injected with 50 μg of indicated FasL variant ± Pln every third (n = 4–6). After 4 weeks, isolated tumor weights were quantified (n = 4 mice) rFOLR1 vs. huFasL, **p = 0.0028; rFOLR1 vs. RhFasL, ***p = 0.0002; rFOLR1 vs. huFasL + Pln, nsp = 0.2775; rFOLR1 vs. RhFasL+ Pln, ****p = <0.0001; rFOLR1 vs. huFasLS153P, ***p = 0.0001; rFOLR1 vs. huFasLS153P+ Pln, ***p = 0.0001; Unpaired, two-sided parametric t-test with no adjustments. d 6–8 week-old mice bearing SQ tumors of colo205 cells were i.p. injected with 50 μg of indicated FasL varian (±Pln) every third (n = 4 mice). After 4 weeks, isolated tumor weights were quantified. (n = 4) rFOLR1 vs. huFasL, nsp = 0.2141; rFOLR1 vs. RhFasL, ***p = 0.0002; rFOLR1 vs. huFasL + Pln, nsp= 0.9753; huFasL + Pln vs. RhFasL+ Pln, ***p = 0.0005. Unpaired, two-sided parametric t-test with no adjustments. e Lysates from indicated patient-derived OvCa cells indicated on the top were tested for PAI-1, uPAR, FasR, plasmin and uPA expression. Representative data in blot is n = 1. f HuFasL and RhFasL treated patient-derived cells were subject to cell survival assay after 48 h. (n = 3, three independent experimental repeats) PDC1031: Untreated vs. huFasL, nsp = 0.1988; Untreated vs. RhFasL, ****p = <0.0001; PDC1030: Untreated vs. huFasL, *p = 0.0492; Untreated vs. RhFasL, ****p = <0.0001; Unpaired, two-sided parametric t-test with no adjustments. g The normalized relative intensities of colorimetric signals were plotted for the increasing plasmin conc. (0.03-5U range) in presence of assay buffer and provided substrate (filled black circles) and against constant 100 μg membrane cellular lysates of indicated cell lines in presence (red star) or absence (blue star) of uPA agonist A8 scFv. hi Ovarian PDC1031 cells were mixed and incubated at 37 °C with transient membrane huFasL (mHuFasL lacking proline rich 8–69 cytoplasmic amino acids) expressing CHO-K cells under EF-1 promoter. The mixture was analyzed for surface FasL on CHO-K by flow cytometry. In control the mHuFasL+ CHO-K cells were mixed on ice just before flow analysis. j Schematic of IgG1-huFasL experiment used in (k). k IgG1-HuFasL was added on to confluent PDC1031 cells. After 2 h, supernatant was concentrated using ammonium sulfate followed by immunoblotting using anti-Fas and anti-Fc antibodies form the same samples. Representative data in blot is n = 1, however the experiment and blot has been repeated with a different cell line. See Supplementary Fig. 12b. Error bars and data in (c, d, f) are presented as mean ± standard deviation (SD).
Fig. 8
Fig. 8. Decreased membrane FasL expression on infiltrated T-cells in murine tumors with elevated plasmin function.
a 8-week-old mice bearing SQ tumors of OvCa PDC1031 cells were i.p. injected with 50 μg of indicated his-tagged FasL variant every third day. After 4 weeks, isolated tumors from each group were imaged (n = 4–6). b Same as (a), except IgG1-FasL was used as indicated. c Same as (a), except IgG1-FasL was used alongside of indicated scFv’s as indicated. d Cell survival assay using indicated murine tumor cell lines after IgG1-HuFasL treatment. (n = 3, n = 3, three independent experimental repeats) HeyA8: Untreated vs. huFasL, ****p = <0.0001; MC38: Untreated vs. huFasL, ****p = <0.0001; 4T1: Untreated vs. huFasL, ***p = 0.0003; ID8OVA: Untreated vs. huFasL, nsp = 0.1277; ID8 + ID8OVA: Untreated vs. huFasL, nsp = 0.3585; Unpaired, two-sided parametric t-test with no adjustments. e Lysates from indicated murine tumor cell lines on top were tested for PAI-1, uPAR, uPA, and plasmin expression. Representative data in blot is n = 1. f, g 6–8 week-old C57BL/6 mice were SQ grafted with ID8 + ID8OVA tumor cells. After 3 weeks (~20days), indicated treatments were given intraperitoneally every 3rd day for a total of five doses. Indicated Nok2h and 9F5 scFv were directly injected in tumors. At day 34–35, harvested tumor grafts (n = 3) were subjected to lysates. Following protein quantitation, lysates were analyzed for capsase-8 cleavage via immunoblotting. Representative data in blot is n = 1, however blot has been repeated with in vivo with additional parameters in Supplementary Fig. 12d. h Same as (f), except two different set of experiments were carried out side-by-side using MC38 SQ tumor grafts (plasmin) and ID8 + ID8OVA SQ tumor grafts as indicated. After 3 weeks (~20 days), animals were intraperitoneally (i.p.) injected either with 50 μg IgG control, avelumab (anti-PD-L1) or avelumab + Nok2h scFv every 3rd day for a total of five doses. At day 34–35 tumors were harvested from both MC38 and ID8 + ID8OVA sets. Next, total immune population were recovered from weight matched tumors using Ficoll-Paque density gradient centrifugation (pooled by treatment group, see methods) and the T-cell population was enriched using CD3 microbeads. The enriched CD3+ T-cells were analyzed for surface FasL expression using flow cytometry (Supplementary Fig. 13a for Gating strategy). i, j Recovered CD3+/FasL+ double positive populations from MC38 and ID8 + ID8OVA tumors. k Percentage of CD3+/FasL+ double positive cells from three independent experiments. (n = 3, independent biological replicates from weight matched tumors, 3–6 animal used for tumor recovery) MC38 tumors: IgG vs. Avelumab, ****p = <0.0001; MC38: Avelumab vs. Avelumab + Nok2h scFv, nsp= 0.8884; ID8OVA: IgG vs. Avelumab, nsp= 0.6748; ID8OVA tumors: Avelumab vs. Avelumab + Nok2h scFv, **p = 0.0090; Unpaired, two-sided parametric t-test with no adjustments. Error bars and data in (d, k) are presented as mean ± standard deviation (SD). In (g) u.c. indicates uncleaved, c. indicates cleaved.
Fig. 9
Fig. 9. Anti-PD-L1 and anti-Nok2h co-treatment rescues FasL signaling and improve overall antitumor function.
a, b Same as Fig. 8h-k, except animals were intraperitoneally (i.p.) injected either with 50 μg avelumab or avelumab +IgG1-huFasL or avelumab +IgG1-huFasL +Nok2h every 3rd day for a total of five doses. Harvested, sized matched tumors pooled by treatment group were distributed into two groups. From group-1, CD8+ cells were enriched from the weight matched tumors (see “Methods”). Enriched CD8+ T-cells from indicated groups were restimulated with anti-CD3 (OKT3) antibody for additional 2 h followed by intracellular IFN-γ expression analysis of CD8 gated cells using flow cytometry. c Percentage of CD8+/ IFN-γ+ double positive cells from three independent experiments. (n = 3, independent biological replicates from weight matched tumors, 3–6 animal used for tumor recovery for each treatment, Supplemental Fig. 13a for Gating strategy). IgG vs. Avelumab, ****p = <0.0001; Avelumab Avelumab vs Avelumab + huFasL, nsp = 0.5344; Avelumab vs Avelumab + huFasL + Nok2h scFv, nsp = 0.6875; Unpaired, two-sided parametric t-test with no adjustments. d Same as (a, b), except from the group-2, the harvested tumors total lysates were prepared and were analyzed for caspase-8, caspase-3, granzyme, and perforin. Representative data in blot is n = 1, however each treatment is represented with n = 3 animals. e Same as (ac), except animals were intraperitoneally (i.p.) injected either with 50 μg of indicated antibodies every 3rd day until the tumor burden in control animals reached closed to the permissible IACUC size limit or if animal conditions were moribund. At the end of experiments average tumor weights was calculated and plotted from various treatment groups. (n = 4 mice) IgG vs. Nok2h scFv alone, nsp = 0.9988; IgG vs. huFasL alone, nsp = 0.1464; IgG vs. Avelumab alone, **p = 0.0035; Avelumab vs Avelumab + huFasL, nsp= 0.2927; Avelumab vs Avelumab + huFasL + Nok2h scFv, **p = 0.0016; Unpaired, two-sided parametric t-test with no adjustments. f Working model for human vs non-human primate FasL functional regulation by plasmin in tumor microenvironment. Error bars and data in (c, e) are presented as mean ± standard deviation (SD). In (d) u.c. indicates uncleaved, c. indicates cleaved.

References

    1. Kelly, P. N. The cancer immunotherapy revolution. Science359, 1344–1345 (2018). - PubMed
    1. Coulie, P. G., Van den Eynde, B. J., van der Bruggen, P. & Boon, T. Tumour antigens recognized by T lymphocytes: at the core of cancer immunotherapy. Nat. Rev. Cancer14, 135–146 (2014). - PubMed
    1. Fogli, L. K. et al. Challenges and next steps in the advancement of immunotherapy: summary of the 2018 and 2020 National Cancer Institute workshops on cell-based immunotherapy for solid tumors. J. Immunother. Cancer9. 10.1136/jitc-2021-003048 (2021). - PMC - PubMed
    1. Peggs, K. S., Quezada, S. A. & Allison, J. P. Cell intrinsic mechanisms of T-cell inhibition and application to cancer therapy. Immunol. Rev.224, 141–165 (2008). - PubMed
    1. Wolf, Y. & Samuels, Y. Intratumor heterogeneity and antitumor immunity shape one another bidirectionally. Clin. Cancer Res28, 2994–3001 (2022). - PMC - PubMed

MeSH terms