. 2025 Jul 1;16(1):5654.
doi: 10.1038/s41467-025-60969-x.

Elevated nitric oxide during colitis restrains GM-CSF production in ILC3 cells via suppressing an AhR-Cyp4f13-NF-κB axis

Affiliations

Elevated nitric oxide during colitis restrains GM-CSF production in ILC3 cells via suppressing an AhR-Cyp4f13-NF-κB axis

Xingyu Zhao et al. Nat Commun. .

Abstract

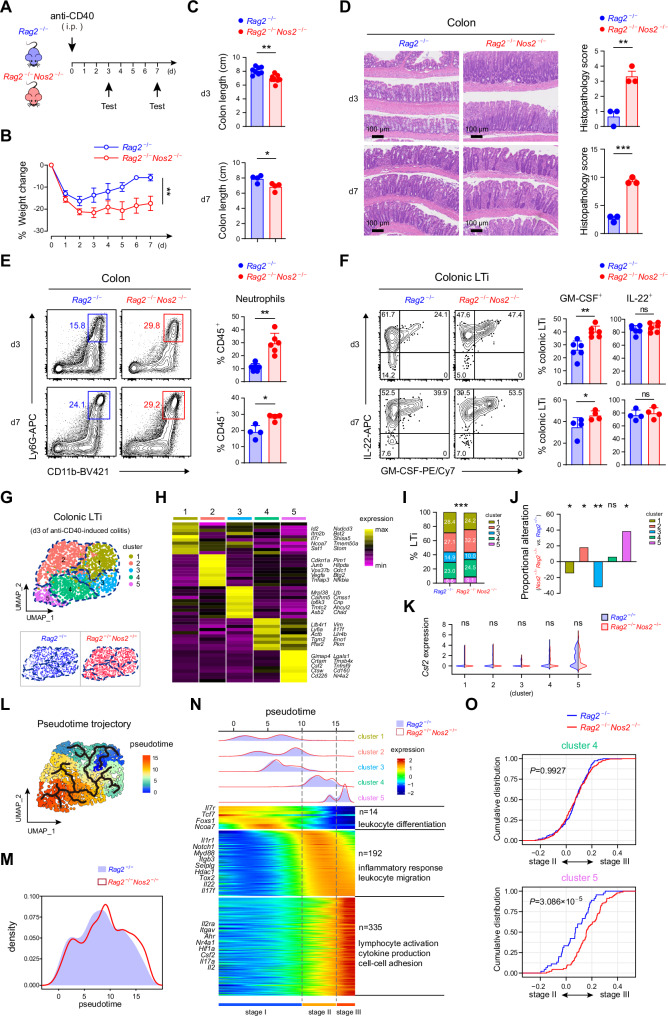
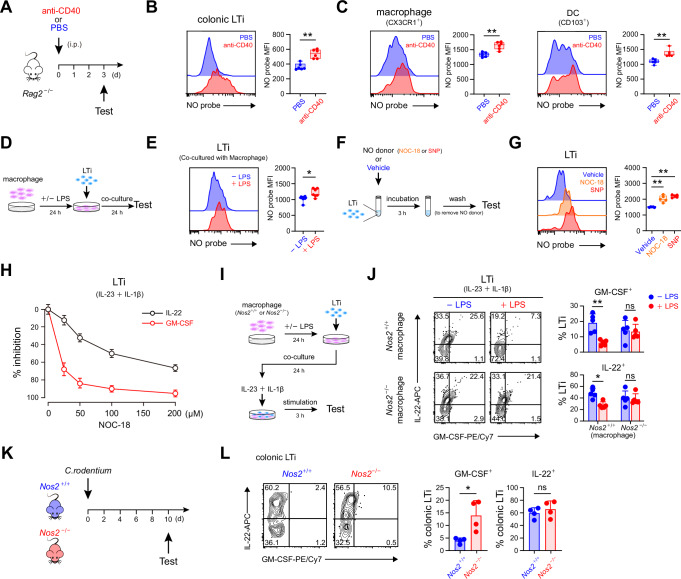
Inflammatory bowel disease (IBD) presents a significant clinical challenge, yet the way bioactive gases are implicated remains elusive. We detect elevated colonic Nos2 levels in both IBD patients and mice undergoing diverse colitis. Additionally, Nos2 deficiency significantly aggravates anti-CD40-induced colitis, along with an increase in GM-CSF production by ILC3s. We identified a previously unappreciated role of the crucial ILC3 regulator, AhR, in promoting Cyp4f13 expression to allow ILC3s to bind with externally derived nitric oxide (NO). This further restrains Cyp4f13-catalyzed ROS generation and thereby diminishes NF-κB activation strictly necessary for GM-CSF production. Accordingly, the exacerbated anti-CD40-induced colitis due to defective NO generation in Nos2 deficient mice is efficiently recovered by a Cyp4f13 inhibitor, HET0016. Importantly, IBD patients with elevated NO binding to colonic ILC3s show decreased disease activity. Thus, our findings uncover a crucial regulatory mechanism for restraining colitogenic GM-CSF production in ILC3s and underscores its implication in IBD therapy.


Conflict of interest statement

Competing interests: The authors declare no competing interests.

Figures

Fig. 1
Fig. 1. Colonic NOS2 levels are elevated during colitis conditions.
A Diagram illustrating enzymatic catalysis of the generation of bioactive gases NO, H2S, and CO (left), and box plots showing the expression levels of these related enzymes in colon tissues of HC individuals, and UC and CD patients (right). B Bar chart visualizes the fold changes of gene expression shown in (A). C Expression alterations of the bioactive gas-related enzymes in colon tissues of mice experiencing various colitis conditions compared to that in steady-state mice. D Real-time qPCR analysis for the relative expression of colonic NOS2 to HPRT1 in HC individuals and UC patients. E Schematics for anti-CD40-induced and DSS-induced colitis. F Expression of NO-related enzymes in colons of mice experiencing anti-CD40-induced and DSS-induced colitis, and the corresponding steady-state mice. Data are representative of more than three (D) or two (F) independent experiments. Data are presented as box plots showing median, quartile, minimum and maximum values (A), bar graph showing mean ± s.d. (C, F), or violin plots showing median and quartile values (D). Statistical significances are determined by two-sided unpaired Student’s t-test (A, B), two-sided Mann-Whitney U test (D, F), or calculated via limma with multiple correction using the Benjamini-Hochberg procedure (C). ns not significant; *p < 0.05; **p < 0.01; ***p < 0.001.
Fig. 2
Fig. 2. Nos2 deficiency leads to aggravated anti-CD40-induced colitis.
A Schematics illustrating anti-CD40-induced colitis in Rag2-/- and Rag2-/-Nos2-/- mice. B Body weight alteration during anti-CD40-induced colitis (n = 4 per group). Examination of Rag2-/- and Rag2-/-Nos2-/- mice with anti-CD40-induced colitis on day 3 (d3) and d7, including colon length (d3, n = 8 per group; d7, n = 4 per group) (C), H&E staining showing the pathological changes of colons (n = 3 per group) (D), flow cytometric analysis of neutrophil infiltrations in colons (d3, n = 6 per group; d7, n = 4 per group) (E), and activation of colonic LTi cells as indicated by their production of IL-22 and GM-CSF (d3, n = 6 per group; d7, n = 4 per group) (F). G UMAP visualizing the classification of colonic LTi cells from Rag2-/- and Rag2-/-Nos2-/- mice experiencing anti-CD40-induced colitis on d3. H Heatmap profiling of the top 10 specifically expressed genes among the five LTi clusters. Specifically expressed genes were based on their significantly higher expression in one cluster compared to the other four clusters. I Percentages of each LTi cluster in Rag2-/- and Rag2-/-Nos2-/- mice. J Proportional alterations of the five LTi clusters in Rag2-/-Nos2-/- mice compared to Rag2-/- mice. K Split violin plots comparing Csf2 expression in the five LTi clusters from Rag2-/- and Rag2-/-Nos2-/- mice. L Pseudotime trajectory of LTi cells. M Cell density of colonic LTi cells along the pseudotime trajectory. N Heatmap showing the dynamic changes in gene expression along the pseudotime (lower panel). The distribution of LTi clusters during the activation (divided into three stages), along with the pseudotime trajectory (upper panel). O Empirical cumulative distribution function (ECDF) plots showing relative expression of genes annotated to cluster 4 (top) and cluster 5 (bottom) in LTi cells from Rag2-/- (black) and Rag2-/-Nos2-/- (red) mice, in comparison with the gene expression difference between stage II and stage III. Data are representative of two (GO) or at least three (AF) independent experiments. Data are presented as mean ± s.d., and statistical significances are determined by two-sided paired Student’s t-tests (B), two-sided Mann-Whitney U test (C, E, F, K, O), two-sided unpaired Student’s t-tests (D), two-sided chi-square test (I) or Fisher’s exact test (J). ns not significant; *p < 0.05; **p < 0.01; ***p < 0.001.
Fig. 3
Fig. 3. Binding of external NO to LTi cells efficiently inhibits their GM-CSF production.
A Schematics of anti-CD40-induced colitis or control operation. B Flow cytometric detection of NO in colonic LTi cells of mice with or without anti-CD40-induced colitis on day 3 (left) and statistical calculation for the mean fluorescent intensity (MFI) of NO (n = 3 per group) (right). C NO detected in colonic CX3CR1+ macrophage (left) and CD103+ dendritic cell (right) in mice with or without anti-CD40-induced colitis on day 3 (n = 6 per group). D Schematics of NO detection in LTi cells co-cultured with macrophages. E NO in LTi cells cocultured with macrophages in the presence or absence of LPS stimulation (n = 7 per group). F Schematics of NO detection after administering LTi cells with the NO donor. G NO detected in LTi cells after administered by the NO donors or vehicle (n = 5 per group). H Titration of the influence of the NO donor NOC-18 on the production of GM-CSF and IL-22 in LTi cells (n = 3 per group). I Schematics for assessing the influence of NO derived from LPS-stimulated macrophages on the activation of LTi cells by IL-23 and IL-1β stimulation. J Examination of GM-CSF and IL-22 production by LTi cells after co-cultured with Nos2+/+ or Nos2-/- macrophages with or without LPS stimulation (n = 5 per group). K Schematics for C. rodentium infection of Nos2+/+ or Nos2-/- mice. L Examination of GM-CSF and IL-22 production by colonic LTi cells of Nos2+/+ or Nos2-/- mice on day 10 post C. rodentium infection (n = 4 per group). Data are representative of two (B, C, H, J, L) or at least three (E, G) independent experiments. Data are presented as box plots showing median, quartile, minimum and maximum values (B, C, E, G) or bar graph showing mean ± s.d. (H, J, L), and statistical significances are determined by two-sided Mann-Whitney U test (B, C, E, G, J, L). ns, not significant; *p < 0.05; **p < 0.01.
Fig. 4
Fig. 4. AhR-driven Cyp4f13 is accountable for external nitric oxide binding to ILC3s.
A Dynamic expression of Csf2 and Il22 along the pseudotime trajectory (2l). B Regulatory activities of the indicated transcription factors along the pseudotime trajectory. C Flow cytometric examination of GM-CSF production by IL-23 and IL-1β activated NKp46+ ILC3s and LTi cells from Ahrfl/fl or Ahrfl/flRorcCre mice (left), and statistical calculation of the percentage of GM-CSF+ cells (n = 5 per group) (right). D Detection of NO in intestinal NKp46+ ILC3 and LTi cells from Ahrfl/fl or Ahrfl/flRorcCre mice (left), and statistical calculation of the MFI of NO (n = 4 per group) (right). E Differentially expressed genes (TPM > 10, fold change >2, P value < 0.05) between NKp46+ ILC3s of Ahrfl/fl or Ahrfl/flRorcCre mice (X axis), as well as between ILC3s and ILC2s (Y axis). F Heatmap profiling of the AhR-driven NKp46+ ILC3-specific genes. G Predicted AhR binding motif within the chromatin accessibility site at the Cyp4f13 locus in LTi cells (left), and validation of this putative AhR binding via CUT&RUN-qPCR assay (right). H Detection of NO in intestinal NKp46+ ILC3s (left) and LTi cells (right) from wild-type (Cyp4f13+/+) and Cyp4f13-/- mice and statistical calculation of the MFI of NO (n = 4 per group). I Schematics for detection of NO binding ability of NKp46+ ILC3s and LTi cells from wild-type (Cyp4f13+/+) and Cyp4f13-/- mice. Detection of NO in NKp46+ ILC3s (J) or LTi cells (K) from wild-type (Cyp4f13+/+) and Cyp4f13-/- mice after incubated with the NO donors, and statistical calculation of the MFI of NO (n = 5 per group). L Schematics for detection of NO binding ability of HET0016 or the corresponding vehicle treated NKp46+ ILC3s and LTi cells from wild-type (Cyp4f13+/+) and Cyp4f13-/- mice. Detection of NO in HET0016 or the corresponding vehicle treated NKp46+ ILC3s (M) or LTi cells (N) from wild-type (Cyp4f13+/+) and Cyp4f13-/- mice, and statistical calculation of the MFI of NO (n = 5 per group). Data are representative of two (A, B, E, F) or at least three (C, D, G, H, J, K, M, N) independent experiments. Data are presented as box plots showing median, quartile, minimum and maximum values (D, H, J, K, M, N) or bar graph showing mean ± s.d. (C, G), and statistical significances are determined by two-sided Mann-Whitney U test (C, D, H, J, K, M, N) or two-sided unpaired Student’s t-tests (G). ns not significant; *p < 0.05; **p < 0.01; ***p < 0.001.
Fig. 5
Fig. 5. HET0016 treatment alleviates anti-CD40-induced colitis.
A Flow cytometric examination of GM-CSF and IL-22 production by IL-23 and IL-1β stimulated LTi cells form wild-type (Cyp4f13+/+) and Cyp4f13-/- mice (left), and statistical calculation of the percentages of GM-CSF+ and IL-22+ cells (n = 4 per group). B Schematics for assessing the influence of HET0016 on the activation of LTi cells. C Flow cytometry examination of the influence of HET0016 (100 μM) or the corresponding vehicle on the production of GM-CSF and IL-22 by IL-23 and IL-1β stimulated LTi cells (left), and statistical calculation of the percentages of GM-CSF+ and IL-22+ cells (n = 5 per group). DI Rag2-/- or Rag2-/-Nos2-/- mice with anti-CD40-induced colitis were treated with HET0016 (10 mg/kg per day) or the corresponding vehicle, followed by examination on day 3. D Schematics for the HET0016 or vehicle administration. E Statistical calculation of body weight loss of the mice on day 3 (n = 4 per group). F Statistical calculation of colon length of the mice (n = 4 per group). G H&E staining of colon tissues of the mice (left), and statistical calculation of the histopathology scores (n = 3 per group). H Flow cytometry examination of colonic neutrophil infiltration (left), and statistical calculation of the percentages of neutrophils (n = 4 per group). I Flow cytometry examination of GM-CSF and IL-22 production by colonic LTi cells (left), and statistical calculation of the percentages of GM-CSF+ and IL-22+ cells (n = 4 per group). Data are representative of at least three independent experiments. Data are presented as bar graph showing mean ± s.d. (A, C, EI), and statistical significances are determined by two-sided Mann-Whitney U test (A, C, E, F, H, I) or two-sided unpaired Student’s t-tests (G). ns not significant; *p < 0.05; **p < 0.01.
Fig. 6
Fig. 6. Cyp4f13 promotes the production of GM-CSF by ILC3s through activating NF-κB.
A Schematics for assessing the influence of AA on the activation of LTi cells from wild-type (Cyp4f13+/+) or Cyp4f13-/- LTi cells. B Flow cytometry examination of the impact of AA (AA-BSA conjugate) or the corresponding vehicle BSA on the production of GM-CSF and IL-22 by IL-23 and IL-1β stimulated wild-type (Cyp4f13+/+) or Cyp4f13-/- LTi cells (left), and statistical calculation of the percentages of GM-CSF+ and IL-22+ cells (n = 5 per group) (right). C Schematics for assessing the influence of AA on the activation of LTi cells pre-treated with HET0016 or the corresponding vehicle. D Flow cytometry examination of the impact of AA or BSA on the production of GM-CSF and IL-22 expression by IL-23 and IL-1β stimulated LTi cells pre-treated with HET0016 or the corresponding vehicle (left), and statistical calculation of the percentages of GM-CSF+ and IL-22+ cells (n = 6 per group) (right). E Schematics for identification of the AA-Cyp4f13 regulated genes based on RNA-seq analysis on AA or BSA treated wild-type (Cyp4f13+/+) or Cyp4f13-/- LTi cells. F Heatmap profiling of the expression of AA-Cyp4f13 regulated genes (TPM > 5, fold change > 2, P adj <0.05). G Sankey diagram visualization of predicted transcription factors accountable for the regulation of both AA-Cyp4f13 regulated genes (left) and Csf2 or Il22 (right). H CUT&RUN-sequencing analysis of NF-κB binding site at the Csf2 locus. I Schematics for assessing the role of NF-κB during the activation of ILC3s. J Flow cytometry examination of GM-CSF and IL-22 production by IL-23 and IL-1β stimulated ILC3s after treating with low and high doses of NF-κB inhibitors PDTC or TPCR or the corresponding vehicle (left), and statistical calculation of the percentages of GM-CSF+ and IL-22+ cells (n = 5 per group) (right). K Schematics for assessing the influence of AA on ROS generation in ILC3 and the effect of HET0016 on this process. L Examination of the influence of AA on ROS generation in ILC3s and the effect of HET0016 on the process (left), and statistical calculation of the MFI of ROS staining (n = 4 per group) (right). M Schematics for assessing the influence of ROS scavenger NAC on the NF-κB activity of IL-23 and IL-1β stimulated ILC3s from NF-κBluc mice. N Statistical calculation of NF-κB activities in IL-23 and IL-1β stimulated ILC3s after treated by NAC (50 μM) or the corresponding vehicle (n = 4 per group). O Schematics for titrating the influence of NAC on IL-23 and IL-1β stimulated ILC3s pre-treated with AA. P Titration of the influence of NAC on the production of GM-CSF and IL-22 by LTi cells (n = 3 per group). Q Schematics for assessing the influence of NO and HET0016 on the NF-κB activity of IL-23 and IL-1β stimulated ILC3s pre-treated with AA. R Statistical calculation of NF-κB activities in SNP, HET0016, or the corresponding vehicle treated ILC3s pre-incubated with AA or BSA (n = 4 per group). S Statistical calculation of NF-κB activities in NOC-18, SNP, or the corresponding vehicle treated ILC3s (n = 4 per group). T Graphical illustration of the role of Cyp4f13 catalyzed AA ω-hydroxylation in activating NF-κB through enhancing ROS generation, followed by elevated GM-CSF expression, and the inhibitory effect of external NO and HET0016 on this process. Data are representative of two (H, L, N, R, S) or at least three (B, D, J, P) independent experiments. Data are presented as box plots showing median, quartile, minimum and maximum values (L) or bar graph showing mean ± s.d. (B, D, J, N, P, R, S), and statistical significances are determined by two-sided Mann-Whitney U test (B, D, J, L, N, R, S). ns not significant; *p < 0.05; **p < 0.01.
Fig. 7
Fig. 7. External NO binding to colonic ILC3s ameliorates the activity of IBD.
A Detection of the ability of ILC3s, ILC2s, and T and B (T/B) cells in PBMC to bind with externally generated NO from SNP. B Schematics for detection of external NO binding ability of HET0016 or the corresponding vehicle treated human ILC3s. C Detection of NO binding ability of human ILC3 pretreated with HET0016 or the corresponding vehicle (left) and statistical calculation of the MFI of NO (n = 5 per group). D Detection of ROS in BSA or AA incubated human ILC3s pre-treated with HET0016 or the corresponding vehicle (left) and the statistical calculation of the MFI of ROS staining (n = 5 per group) (right). E Flow cytometry examination of GM-CSF expression by IL-23 and IL-1β stimulated human ILC3 pre-treated with HET0016 or the corresponding vehicle (left) and statistical calculation of the percentages and GM-CSF MFI of GM-CSF+ cells (n = 6 per group) (right). F Flow cytometry showing examination of NO levels in ILC3s from human colon and utilization of NO levels in T/B cells for background normalization. G Statistical calculation of rNOb levels of HC individuals and UC patients (HC, n = 16; UC, n = 22). H Correlation between Mayo score and rNOb levels of UC patients (n = 22). I H&E staining showing colon tissues of UC patients with low (rNOb <1.24) and high (rNOb > 1.24) rNOb levels. J Assessment of neutrophil infiltration in UC patients with low (rNOb <1.24) and high (rNOb > 1.24) rNOb levels using Geboes Score (rNOb <1.24, n = 14; rNOb > 1.24, n = 8). K Correlation between the concentration of fecal calprotectin (top) or C-reactive protein (bottom) and rNOb levels of UC patients (n = 22). Data are representative of at least three independent experiments. Data are presented as box plots showing median, quartile, minimum and maximum values (C, C, G) or bar graph showing mean ± s.d. (J), and statistical significances are determined by two-sided Mann-Whitney U tests (C, D, G, J), two-sided Wilcoxon U test (E) or Pearson correlation tests (H, K). *p < 0.05; **p < 0.01.

References

    1. Mowat, A. M. & Agace, W. W. Regional specialization within the intestinal immune system. Nat. Rev. Immunol.14, 667–685 (2014). - PubMed
    1. Blander, J. M., Longman, R. S., Iliev, I. D., Sonnenberg, G. F. & Artis, D. Regulation of inflammation by microbiota interactions with the host. Nat. Immunol.18, 851–860 (2017). - PMC - PubMed
    1. Kobayashi, T. & Hibi, T. Improving IBD outcomes in the era of many treatment options. Nat. Rev. Gastroenterol. Hepatol.20, 79–80 (2023). - PMC - PubMed
    1. Neurath, M. F. Cytokines in inflammatory bowel disease. Nat. Rev. Immunol.14, 329–342 (2014). - PubMed
    1. Kalantar-Zadeh, K., Berean, K. J., Burgell, R. E., Muir, J. G. & Gibson, P. R. Intestinal gases: influence on gut disorders and the role of dietary manipulations. Nat. Rev. Gastroenterol. Hepatol.16, 733–747 (2019). - PubMed

MeSH terms

LinkOut - more resources