. 2025 Jul 1;16(1):5701.
doi: 10.1038/s41467-025-61005-8.

The human ciliopathy protein RSG1 links the CPLANE complex to transition zone architecture

Affiliations

The human ciliopathy protein RSG1 links the CPLANE complex to transition zone architecture

Neftalí Vazquez et al. Nat Commun. .

Abstract

Cilia are essential organelles, and variants in genes governing ciliary function result in ciliopathic diseases. The Ciliogenesis and PLANar polarity Effectors (CPLANE) protein complex is essential for ciliogenesis, and all but one subunit of the CPLANE complex have been implicated in human ciliopathy. Here, we identify three families in which variants in the remaining CPLANE subunit CPLANE2/RSG1 also cause ciliopathy. These patients display cleft palate, tongue lobulations and polydactyly, phenotypes characteristic of Oral-Facial-Digital Syndrome. We further show that these alleles disrupt two vital steps of ciliogenesis, basal body docking and recruitment of intraflagellar transport proteins. Moreover, APMS reveals that Rsg1 binds CPLANE and the transition zone protein Fam92 in a GTP-dependent manner. Finally, we show that CPLANE is generally required for normal transition zone architecture. Our work demonstrates that CPLANE2/RSG1 is a causative gene for human ciliopathy and also sheds new light on the mechanisms of ciliary transition zone assembly.


Conflict of interest statement

Competing interests: The authors declare no competing interests.

Figures

Fig. 1
Fig. 1. Allelic variants of RSG1/CPLANE2 are associated with human ciliopathy.
A Structure of mouse CPLANE complex, Wdpcp, Intu, Fuz, and Rsg1 (PDB: 7Q3E). RSG1 allelic variants highlighted in red and GTP in the nucleotide pocket indicated (B, D, F) Pedigree maps and prominent features for ciliopathy indicated patients. (C, E, G) Structure of mouse Rsg1 (PDB 7q3e) with corresponding human residues altered by ciliopathy variants highlighted in red (see also Supplementary Fig. 2B, C).
Fig. 2
Fig. 2. Ciliopathy-associated alleles of RSG1 elicit distinct effects.
A En face in vivo imaging of a Xenopus multiciliated cell with axonemes labelled by membrane-RFP (blue) and basal bodies labeled with centrin-BFP (green). BE En face images of single MCCs showing Rsg1 basal body localization for control, and S72P (=human A76P), G114E (=human G118E), and D184W (=human R188W) variants. (b’e’) merged channels showing Rsg1(green) with centrin (magenta), scale bar = 5 μm. F Graph showing mean ± standard deviation of normalized GFP-Rsg1 basal body fluorescence (see “Methods”). N > 25 cells in 5 embryos across 3 experiments for all conditions. N values and statistic can be found in Supplementary Dataset 3.
Fig. 3
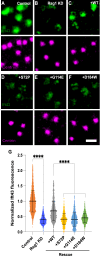
Fig. 3. Ciliopathy-associated alleles of RSG1 disrupt IFT-A2 recruitment to the base of cilia.
AF High magnification en face images showing IFT43 (green) localization at apical basal bodies labeled by centrin (magenta). AC Control, Rsg1 KD, and rescue of KD with WT Rsg1. DF Failure of rescue by indicated variant alleles. Scale bar= 1 μm. G Graph showing mean ± standard deviation of normalized IFT43-GFP basal body fluorescence. N > 21 cells in 6 embryos across 2 experiments for all conditions. N values and statistics can be found in Supplementary Dataset 3.
Fig. 4
Fig. 4. Ciliopathy-associated alleles of RSG1 disrupt basal body docking.
A Schematic representation of a MCC, depicting the apical and cytoplasmic regions shown in transverse optical section in this figure. BG Transverse 3D projection of centrin (magenta), scale bar = 5 μm. H Graph shows the distribution of basal body depth below the apical surface in μm. N > 18 cells in 6 embryos across 2 experiments for all conditions. N values and statistics can be found in Supplementary Dataset 3.
Fig. 5
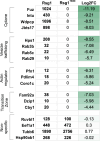
Fig. 5. APMS comparison of WT and T69N Rsg1.
Spectral counts are shown for selected proteins in APMS with WT Rsg1 versus the Rsg1(T69N) mutant. Interactors are grouped by function. Examples of non-specific interactors are provided at the bottom. Full data table can be found in Supplementary Dataset 3.
Fig. 6
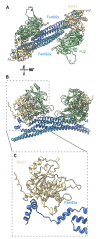
Fig. 6. AlphaFold3 predicts direct interaction of RSG1 with FAM92A.
A Alphafold3 prediction of the structure of two human FUZ-RSG1 heterodimers interacting with one Fam92a homodimer. Colors indicate monomers as indicated. B 90-degree rotation from (B). C Increased magnification view of (C) showing the RGS1-FAM92A interaction (after removal of FUZ and one copy of FAM92A for clarity).
Fig. 7
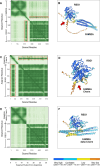
Fig. 7. Quantification of AlphaFold3 structure predictions.
A PAE Plot for the interaction of full-length human RSG1 and FAM92A monomers; arrow indicates region of Rsg1 interaction with the C-terminus of Fam92. B Structure of RSG1 monomer in complex with FAM92A monomer, with colors indicating PlDDT. C PAE Plot for the interaction of full-length RSG1 with the C-terminal 83 amino acids of FAM92A; arrow indicates region of Rsg1 interaction. D Structure corresponding to C, with colors indicating PlDDT. E PAE Plot indicates no interaction between full-length RSG1 with the C-terminal 83 amino acids of FAM92A; arrow indicates region of Rsg1 interaction. F Structure corresponding to E, note very poor PlDDT scores at the region of “interface.”.
Fig. 8
Fig. 8. Rsg1 recruits Fam92b to docking basal bodies in Xenopus MCCs.
A, B, D, E High magnification en face images of MCCs apical basal bodies labeled by centrin (magenta) and Fam92b (green) scale bar = 1 μm. C, F Graphs of normalized Fam92b basal body fluorescence. C Graph showing Fam92b fluorescence levels after KD of Rsg1. F Graph showing Fam92b fluorescence levels after over expression of Rsg1 T65N. G Transverse 3D projection of centrin (magenta) and Fam92b (green), scale bar = 5 μm. H Graph shows the fluorescence intensity of Fam92b on basal bodies at different depths starting from apical (docked) and several μm from the apical surface. N > 25 cells in 6 embryos across 3 experiments for all conditions. All graphs show showing mean ± standard deviation. N values and statistics can be found in Supplementary Dataset 3.
Fig. 9
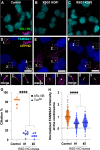
Fig. 9. RSG1 is required for ciliogenesis and recruitment of FAM92A to basal bodies in human cells.
AC Human RPE1 cells stained for ARL13B (green) and TubAc (magenta) as markers in control and RSG1 crispant cells. scale bar = 10 µm DF Imaging of FAM92A (cyan) fluorescence at the transition zone CEP192 (yellow) in RPE1 cells with mutated Rsg1. Insets show three indicated cilia from the panels above. G Percentage ciliation using ARL13B (green) and TubAc (magenta) positive cells in RSG1 mutants. H Mean ± standard deviation of normalized FAM92 at the transition zone, ciliated cells marked in orange and non-ciliated in blue. N > 80 for all conditions. N values and statistics can be found in Supplementary Dataset 3.
Fig. 10
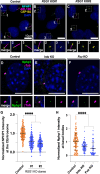
Fig. 10. CPLANE is required for normal recruitment of the transition zone to the basal body.
AC Human RPE1 cells stained for the TZ protein NPHP1, the basal body protein Cep192, and the cilia marker ARL13B. Scale bar = 10 μm. G Graph shows mean ± standard deviation of normalized Nphp1 fluorescence at the transition zone for indicated genotypes. DF Nphp1(green) fluorescence at basal bodies labeled in tub(magenta) in Intu or Fuz mutant mouse embryo fibroblasts. Scale bar = 10 μm. H Graph shows mean ± standard deviation of normalized Nphp1 fluorescence at the basal body in controls and Intu or Fuz mutants. N > 52 for all conditions. N values and statistics can be found in Supplementary Dataset 3.

Update of

References

    1. Hildebrandt, F., Benzing, T. & Katsanis, N. Ciliopathies. N. Engl. J. Med.364, 1533–1543 (2011). - PMC - PubMed
    1. Reiter, J. F. & Leroux, M. R. Genes and molecular pathways underpinning ciliopathies. Nat. Rev. Mol. Cell Biol.18, 533–547 (2017). - PMC - PubMed
    1. Mitchison, H. M. & Valente, E. M. Motile and non-motile cilia in human pathology: from function to phenotypes. J. Pathol.241, 294–309 (2017). - PubMed
    1. Ishikawa, H. & Marshall, W. F. Intraflagellar transport and ciliary dynamics. Cold Spring Harb. Perspect. Biol.910.1101/cshperspect.a021998 (2017). - PMC - PubMed
    1. Klena, N. & Pigino, G. Structural biology of cilia and intraflagellar transport. Annu Rev. Cell Dev. Biol.38, 103–123 (2022). - PubMed

LinkOut - more resources