. 2025 Jul 1;12(1):1078.
doi: 10.1038/s41597-025-05423-9.

Characterizing organisms from three domains of life with universal primers from throughout the global ocean

Affiliations

Characterizing organisms from three domains of life with universal primers from throughout the global ocean

Jesse McNichol et al. Sci Data. .

Abstract

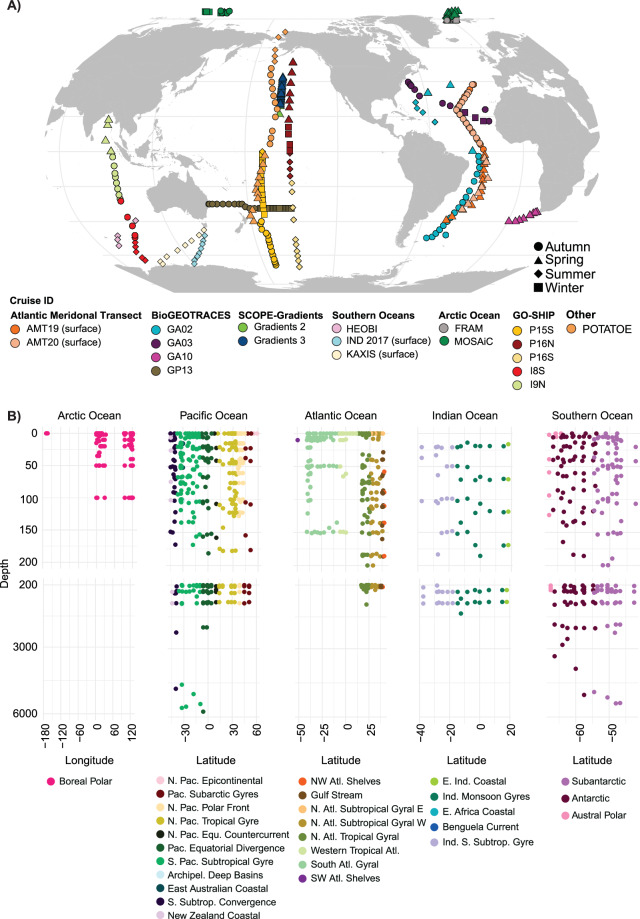
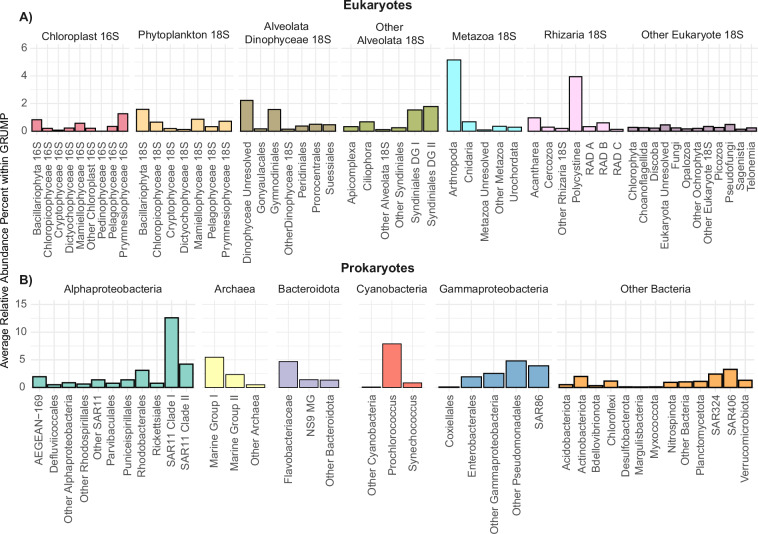
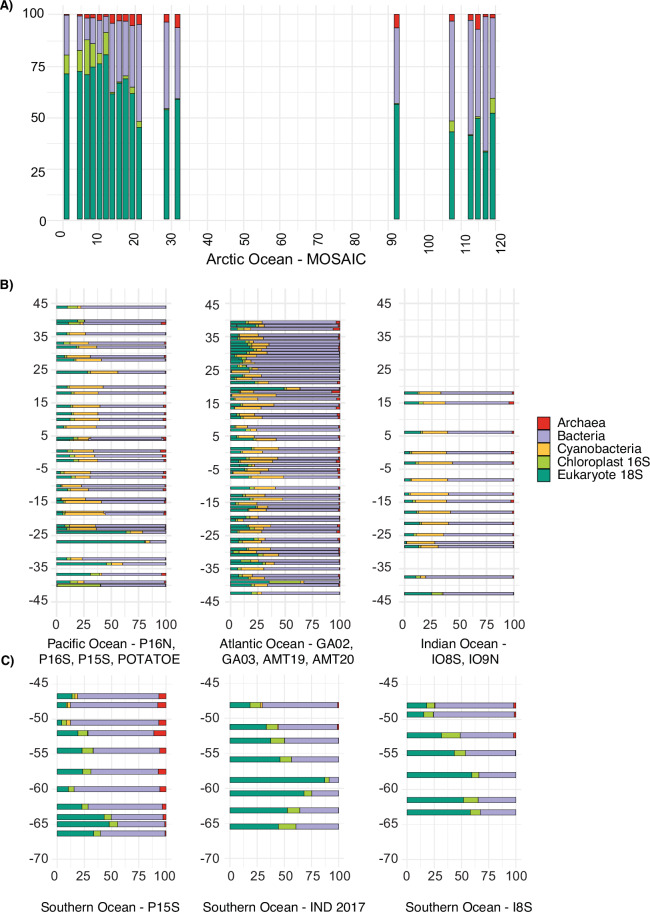
We introduce the Global rRNA Universal Metabarcoding Plankton database (GRUMP), which consists of 1194 samples that were collected from 2003-2020 and cover extensive latitudinal and longitudinal transects, as well as depth profiles in all major ocean basins. DNA from unfractionated (>0.2 µm) seawater samples was amplified using the 515Y/926 R universal three-domain rRNA gene primers, simultaneously quantifying the relative abundance of amplicon sequencing variants (ASVs) from bacteria, archaea, eukaryotic nuclear 18S, and eukaryotic plastid 16S. Thus, the ratio between taxa in one sample is directly comparable to the ratio in any other GRUMP sample, regardless of gene copy number differences. This obviates a problem in prior global studies that used size-fractionation and different rRNA gene primers for bacteria, archaea, and eukaryotes, precluding comparisons across size fractions or domains. On average, bacteria contributed 71%, eukaryotes 19%, and archaea 8% to rRNA gene abundance, though eukaryotes contributed 32% at latitudes >40°. GRUMP is publicly available on the Simons Collaborative Marine Atlas Project (CMAP), promoting the global comparison of marine microbial dynamics.


Conflict of interest statement

Competing interests: The authors declare no competing interests.

Figures

Fig. 1
Fig. 1
(A) Map of the locations of samples in the GRUMP dataset. Colour indicates the cruise names. Shape indicates the season in which the sample was taken. (B) Depth profile within each ocean basin. Color refers to the Longhurst province of each sample location.
Fig. 2
Fig. 2
Bioinformatic pipeline used to analyze mixed 16S and 18S rRNA amplicons generated from three-domain universal SSU rRNA primer set 515Y/926R from unfractionated seawater collected in the GRUMP collaboration. The unique features of this pipeline include an initial database-dependent in silico splitting step after PCR amplification and sequencing, parallel 16S rRNA and 18S rRNA denoising pipelines, and a correction-based merging step − allowing for the recovery of both 16S rRNA and 18S rRNA information in a single ASV table. Note that separate analysis pipelines are required due to the non-overlapping nature of forward and reverse 18S rRNA reads which would otherwise cause them to be discarded in bioinformatic pipelines that are dependent on read merging (as is common for most rRNA-based amplicon pipelines). The pipeline is based primarily in the QIIME2 framework and has been implemented and tested with Ubuntu-based Linux distributions.
Fig. 3
Fig. 3
The average relative abundance from major marine plankton groups across all GRUMP samples. (A) Eukaryotes and (B) Prokaryotes.
Fig. 4
Fig. 4
Percent of total reads derived from (A) each ocean basin or (B) various depths. Total reads in GRUMP: 256,299,695.
Fig. 5
Fig. 5
Relative abundance of marine microbes in the top 25 m of the ocean, partitioned between archaea, bacteria, cyanobacteria, chloroplast 16S rRNA, and eukaryotic 18S. (A) Relative abundance % (y axis) across longitude in decimal degrees (x axis) from MOSAiC within the Arctic Ocean. (B) Relative abundance % (x axis) vs latitude in decimal degrees (y axis) from within the Pacific Ocean, the Atlantic Ocean, and Indian Ocean (C) relative abundance (x axis) vs latitude in decimal degrees (y axis) from within the Southern Ocean.

References

    1. Woese, C. R., Kandler, O. & Wheelis, M. L. Towards a natural system of organisms: proposal for the domains Archaea, Bacteria, and Eucarya. Proc. Natl. Acad. Sci. USA.87, 4576–4579 (1990). - PMC - PubMed
    1. Azam, F. et al. The Ecological Role of Water-Column Microbes in the Sea. Mar. Ecol. Prog. Ser.10, 257–263 (1983).
    1. Falkowski, P. G., Fenchel, T. & Delong, E. F. The Microbial Engines That Drive Earth’s Biogeochemical Cycles. Science320, 1034–1039 (2008). - PubMed
    1. Steele, J. H. The Structure of Marine Ecosystems. 10.4159/harvard.9780674592513 (Harvard University Press, 2013).
    1. Worden, A. Z. et al. Rethinking the marine carbon cycle: Factoring in the multifarious lifestyles of microbes. Science347, 1257594 (2015). - PubMed

LinkOut - more resources