

Systems vaccinology identifies immunological correlates of SARS-CoV-2 vaccine response in solid organ transplant recipients
- PMID: 40593765
- PMCID: PMC12215688
- DOI: 10.1038/s41541-025-01182-1
Systems vaccinology identifies immunological correlates of SARS-CoV-2 vaccine response in solid organ transplant recipients
Abstract
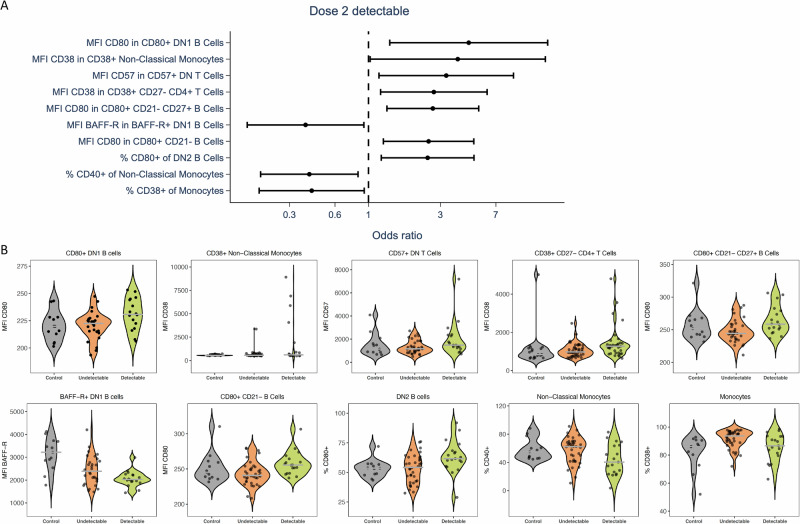
Solid-organ transplant (SOT) recipients are at enhanced risk of infection and to poorly respond to vaccination due to comorbidities and immunosuppression. We performed a systems vaccinology study in 59 kidney and 31 lung transplant recipients who received 3 doses of COVID-19 mRNA BNT162b2 vaccine. We were able to characterize a baseline configuration associated with an effective humoral response to 3 doses, characterized by an innate and activated B cell profile, whereas a T cell signature was associated with a poorer response. We observed a distinct configuration associated with a detectable humoral response to 2 doses, partly mediated by double negative B cell subsets. These results suggest that, despite their immunosuppression, some SOT recipients can induce an effective humoral response to 3 doses of vaccine supported by a baseline configuration close to the healthy phenotype. Baseline immune phenotyping may help identify SOT recipients at the greatest risk of a poor vaccine response.
© 2025. The Author(s).
Conflict of interest statement
Competing interests: The authors declare no competing interests.
Figures


References
-
- WHO Coronavirus (COVID-19) Dashboard. https://covid19.who.int.
Grants and funding
- No 874707 (EXIMIOUS)/KU Leuven C1 program, the European Union's Horizon 2020 research and innovation programme
- No 874707 (EXIMIOUS)/KU Leuven C1 program, the European Union's Horizon 2020 research and innovation programme
- No 874707 (EXIMIOUS)/KU Leuven C1 program, the European Union's Horizon 2020 research and innovation programme
- No 874707 (EXIMIOUS)/KU Leuven C1 program, the European Union's Horizon 2020 research and innovation programme
- No 874707 (EXIMIOUS)/KU Leuven C1 program, the European Union's Horizon 2020 research and innovation programme
- No 874707 (EXIMIOUS)/KU Leuven C1 program, the European Union's Horizon 2020 research and innovation programme
- No 874707 (EXIMIOUS)/KU Leuven C1 program, the European Union's Horizon 2020 research and innovation programme
- No 874707 (EXIMIOUS)/KU Leuven C1 program, the European Union's Horizon 2020 research and innovation programme
- No 874707 (EXIMIOUS)/KU Leuven C1 program, the European Union's Horizon 2020 research and innovation programme
- No 874707 (EXIMIOUS)/KU Leuven C1 program, the European Union's Horizon 2020 research and innovation programme
- No 874707 (EXIMIOUS)/KU Leuven C1 program, the European Union's Horizon 2020 research and innovation programme
- No 874707 (EXIMIOUS)/KU Leuven C1 program, the European Union's Horizon 2020 research and innovation programme
- No 874707 (EXIMIOUS)/KU Leuven C1 program, the European Union's Horizon 2020 research and innovation programme
- No 874707 (EXIMIOUS)/KU Leuven C1 program, the European Union's Horizon 2020 research and innovation programme
- No 874707 (EXIMIOUS)/KU Leuven C1 program, the European Union's Horizon 2020 research and innovation programme
- No 874707 (EXIMIOUS)/KU Leuven C1 program, the European Union's Horizon 2020 research and innovation programme
- No 874707 (EXIMIOUS)/KU Leuven C1 program, the European Union's Horizon 2020 research and innovation programme
- No 874707 (EXIMIOUS)/KU Leuven C1 program, the European Union's Horizon 2020 research and innovation programme
- No 874707 (EXIMIOUS)/KU Leuven C1 program, the European Union's Horizon 2020 research and innovation programme
- No 874707 (EXIMIOUS)/KU Leuven C1 program, the European Union's Horizon 2020 research and innovation programme
- No 874707 (EXIMIOUS)/KU Leuven C1 program, the European Union's Horizon 2020 research and innovation programme
- No 874707 (EXIMIOUS)/KU Leuven C1 program, the European Union's Horizon 2020 research and innovation programme
- No 874707 (EXIMIOUS)/KU Leuven C1 program, the European Union's Horizon 2020 research and innovation programme
- No 874707 (EXIMIOUS)/KU Leuven C1 program, the European Union's Horizon 2020 research and innovation programme
- No 874707 (EXIMIOUS)/KU Leuven C1 program, the European Union's Horizon 2020 research and innovation programme
- BBS/E/B/000C0427 and BBS/E/B/000C0428/Biotechnology and Biological Sciences Research Council (BBSRC) through Institute Strategic Program Grant funding
- BBS/E/B/000C0427 and BBS/E/B/000C0428/Biotechnology and Biological Sciences Research Council (BBSRC) through Institute Strategic Program Grant funding
- BBS/E/B/000C0427 and BBS/E/B/000C0428/Biotechnology and Biological Sciences Research Council (BBSRC) through Institute Strategic Program Grant funding
- BBS/E/B/000C0427 and BBS/E/B/000C0428/Biotechnology and Biological Sciences Research Council (BBSRC) through Institute Strategic Program Grant funding
- BBS/E/B/000C0427 and BBS/E/B/000C0428/Biotechnology and Biological Sciences Research Council (BBSRC) through Institute Strategic Program Grant funding
- BBS/E/B/000C0427 and BBS/E/B/000C0428/Biotechnology and Biological Sciences Research Council (BBSRC) through Institute Strategic Program Grant funding
- BBS/E/B/000C0427 and BBS/E/B/000C0428/Biotechnology and Biological Sciences Research Council (BBSRC) through Institute Strategic Program Grant funding
- BBS/E/B/000C0427 and BBS/E/B/000C0428/Biotechnology and Biological Sciences Research Council (BBSRC) through Institute Strategic Program Grant funding
- BBS/E/B/000C0427 and BBS/E/B/000C0428/Biotechnology and Biological Sciences Research Council (BBSRC) through Institute Strategic Program Grant funding
- BBS/E/B/000C0427 and BBS/E/B/000C0428/Biotechnology and Biological Sciences Research Council (BBSRC) through Institute Strategic Program Grant funding
- BBS/E/B/000C0427 and BBS/E/B/000C0428/Biotechnology and Biological Sciences Research Council (BBSRC) through Institute Strategic Program Grant funding
- BBS/E/B/000C0427 and BBS/E/B/000C0428/Biotechnology and Biological Sciences Research Council (BBSRC) through Institute Strategic Program Grant funding
- BBS/E/B/000C0427 and BBS/E/B/000C0428/Biotechnology and Biological Sciences Research Council (BBSRC) through Institute Strategic Program Grant funding
- BBS/E/B/000C0427 and BBS/E/B/000C0428/Biotechnology and Biological Sciences Research Council (BBSRC) through Institute Strategic Program Grant funding
- BBS/E/B/000C0427 and BBS/E/B/000C0428/Biotechnology and Biological Sciences Research Council (BBSRC) through Institute Strategic Program Grant funding
- BBS/E/B/000C0427 and BBS/E/B/000C0428/Biotechnology and Biological Sciences Research Council (BBSRC) through Institute Strategic Program Grant funding
- BBS/E/B/000C0427 and BBS/E/B/000C0428/Biotechnology and Biological Sciences Research Council (BBSRC) through Institute Strategic Program Grant funding
- BBS/E/B/000C0427 and BBS/E/B/000C0428/Biotechnology and Biological Sciences Research Council (BBSRC) through Institute Strategic Program Grant funding
- BBS/E/B/000C0427 and BBS/E/B/000C0428/Biotechnology and Biological Sciences Research Council (BBSRC) through Institute Strategic Program Grant funding
- BBS/E/B/000C0427 and BBS/E/B/000C0428/Biotechnology and Biological Sciences Research Council (BBSRC) through Institute Strategic Program Grant funding
- BBS/E/B/000C0427 and BBS/E/B/000C0428/Biotechnology and Biological Sciences Research Council (BBSRC) through Institute Strategic Program Grant funding
- BBS/E/B/000C0427 and BBS/E/B/000C0428/Biotechnology and Biological Sciences Research Council (BBSRC) through Institute Strategic Program Grant funding
- BBS/E/B/000C0427 and BBS/E/B/000C0428/Biotechnology and Biological Sciences Research Council (BBSRC) through Institute Strategic Program Grant funding
- BBS/E/B/000C0427 and BBS/E/B/000C0428/Biotechnology and Biological Sciences Research Council (BBSRC) through Institute Strategic Program Grant funding
- BBS/E/B/000C0427 and BBS/E/B/000C0428/Biotechnology and Biological Sciences Research Council (BBSRC) through Institute Strategic Program Grant funding
- Wallonia-Biomed portfolio, 411132-957270/European Regional Development Fund (ERDF) of the Walloon Region
- Wallonia-Biomed portfolio, 411132-957270/European Regional Development Fund (ERDF) of the Walloon Region
- Wallonia-Biomed portfolio, 411132-957270/European Regional Development Fund (ERDF) of the Walloon Region
- Wallonia-Biomed portfolio, 411132-957270/European Regional Development Fund (ERDF) of the Walloon Region
- Wallonia-Biomed portfolio, 411132-957270/European Regional Development Fund (ERDF) of the Walloon Region
- Wallonia-Biomed portfolio, 411132-957270/European Regional Development Fund (ERDF) of the Walloon Region
- Wallonia-Biomed portfolio, 411132-957270/European Regional Development Fund (ERDF) of the Walloon Region
- Wallonia-Biomed portfolio, 411132-957270/European Regional Development Fund (ERDF) of the Walloon Region
- Wallonia-Biomed portfolio, 411132-957270/European Regional Development Fund (ERDF) of the Walloon Region
- Wallonia-Biomed portfolio, 411132-957270/European Regional Development Fund (ERDF) of the Walloon Region
- Wallonia-Biomed portfolio, 411132-957270/European Regional Development Fund (ERDF) of the Walloon Region
- Wallonia-Biomed portfolio, 411132-957270/European Regional Development Fund (ERDF) of the Walloon Region
- Wallonia-Biomed portfolio, 411132-957270/European Regional Development Fund (ERDF) of the Walloon Region
- Wallonia-Biomed portfolio, 411132-957270/European Regional Development Fund (ERDF) of the Walloon Region
- Wallonia-Biomed portfolio, 411132-957270/European Regional Development Fund (ERDF) of the Walloon Region
- Wallonia-Biomed portfolio, 411132-957270/European Regional Development Fund (ERDF) of the Walloon Region
- Wallonia-Biomed portfolio, 411132-957270/European Regional Development Fund (ERDF) of the Walloon Region
- Wallonia-Biomed portfolio, 411132-957270/European Regional Development Fund (ERDF) of the Walloon Region
- Wallonia-Biomed portfolio, 411132-957270/European Regional Development Fund (ERDF) of the Walloon Region
- Wallonia-Biomed portfolio, 411132-957270/European Regional Development Fund (ERDF) of the Walloon Region
- Wallonia-Biomed portfolio, 411132-957270/European Regional Development Fund (ERDF) of the Walloon Region
- Wallonia-Biomed portfolio, 411132-957270/European Regional Development Fund (ERDF) of the Walloon Region
- Wallonia-Biomed portfolio, 411132-957270/European Regional Development Fund (ERDF) of the Walloon Region
- Wallonia-Biomed portfolio, 411132-957270/European Regional Development Fund (ERDF) of the Walloon Region
- Wallonia-Biomed portfolio, 411132-957270/European Regional Development Fund (ERDF) of the Walloon Region
- 2020-106 and 2022-140/Stichting Alzheimer Onderzoek - Fondation Recherche Maladie Alzheimer (SAO-FMA) and Stichting tegen Kanker
- 2020-106 and 2022-140/Stichting Alzheimer Onderzoek - Fondation Recherche Maladie Alzheimer (SAO-FMA) and Stichting tegen Kanker
- 2020-106 and 2022-140/Stichting Alzheimer Onderzoek - Fondation Recherche Maladie Alzheimer (SAO-FMA) and Stichting tegen Kanker
- 2020-106 and 2022-140/Stichting Alzheimer Onderzoek - Fondation Recherche Maladie Alzheimer (SAO-FMA) and Stichting tegen Kanker
- 2020-106 and 2022-140/Stichting Alzheimer Onderzoek - Fondation Recherche Maladie Alzheimer (SAO-FMA) and Stichting tegen Kanker
- 2020-106 and 2022-140/Stichting Alzheimer Onderzoek - Fondation Recherche Maladie Alzheimer (SAO-FMA) and Stichting tegen Kanker
- 2020-106 and 2022-140/Stichting Alzheimer Onderzoek - Fondation Recherche Maladie Alzheimer (SAO-FMA) and Stichting tegen Kanker
- 2020-106 and 2022-140/Stichting Alzheimer Onderzoek - Fondation Recherche Maladie Alzheimer (SAO-FMA) and Stichting tegen Kanker
- 2020-106 and 2022-140/Stichting Alzheimer Onderzoek - Fondation Recherche Maladie Alzheimer (SAO-FMA) and Stichting tegen Kanker
- 2020-106 and 2022-140/Stichting Alzheimer Onderzoek - Fondation Recherche Maladie Alzheimer (SAO-FMA) and Stichting tegen Kanker
- 2020-106 and 2022-140/Stichting Alzheimer Onderzoek - Fondation Recherche Maladie Alzheimer (SAO-FMA) and Stichting tegen Kanker
- 2020-106 and 2022-140/Stichting Alzheimer Onderzoek - Fondation Recherche Maladie Alzheimer (SAO-FMA) and Stichting tegen Kanker
- 2020-106 and 2022-140/Stichting Alzheimer Onderzoek - Fondation Recherche Maladie Alzheimer (SAO-FMA) and Stichting tegen Kanker
- 2020-106 and 2022-140/Stichting Alzheimer Onderzoek - Fondation Recherche Maladie Alzheimer (SAO-FMA) and Stichting tegen Kanker
- 2020-106 and 2022-140/Stichting Alzheimer Onderzoek - Fondation Recherche Maladie Alzheimer (SAO-FMA) and Stichting tegen Kanker
- 2020-106 and 2022-140/Stichting Alzheimer Onderzoek - Fondation Recherche Maladie Alzheimer (SAO-FMA) and Stichting tegen Kanker
- 2020-106 and 2022-140/Stichting Alzheimer Onderzoek - Fondation Recherche Maladie Alzheimer (SAO-FMA) and Stichting tegen Kanker
- 2020-106 and 2022-140/Stichting Alzheimer Onderzoek - Fondation Recherche Maladie Alzheimer (SAO-FMA) and Stichting tegen Kanker
- 2020-106 and 2022-140/Stichting Alzheimer Onderzoek - Fondation Recherche Maladie Alzheimer (SAO-FMA) and Stichting tegen Kanker
- 2020-106 and 2022-140/Stichting Alzheimer Onderzoek - Fondation Recherche Maladie Alzheimer (SAO-FMA) and Stichting tegen Kanker
- 2020-106 and 2022-140/Stichting Alzheimer Onderzoek - Fondation Recherche Maladie Alzheimer (SAO-FMA) and Stichting tegen Kanker
- 2020-106 and 2022-140/Stichting Alzheimer Onderzoek - Fondation Recherche Maladie Alzheimer (SAO-FMA) and Stichting tegen Kanker
- 2020-106 and 2022-140/Stichting Alzheimer Onderzoek - Fondation Recherche Maladie Alzheimer (SAO-FMA) and Stichting tegen Kanker
- 2020-106 and 2022-140/Stichting Alzheimer Onderzoek - Fondation Recherche Maladie Alzheimer (SAO-FMA) and Stichting tegen Kanker
- 2020-106 and 2022-140/Stichting Alzheimer Onderzoek - Fondation Recherche Maladie Alzheimer (SAO-FMA) and Stichting tegen Kanker
LinkOut - more resources
Full Text Sources
Miscellaneous
