. 2025 Jul 1;16(1):5954.
doi: 10.1038/s41467-025-61179-1.

Brainstem catecholaminergic neurons induce torpor during fasting by orchestrating cardiovascular and thermoregulation changes

Affiliations

Brainstem catecholaminergic neurons induce torpor during fasting by orchestrating cardiovascular and thermoregulation changes

Mingxiu Cheng et al. Nat Commun. .

Abstract

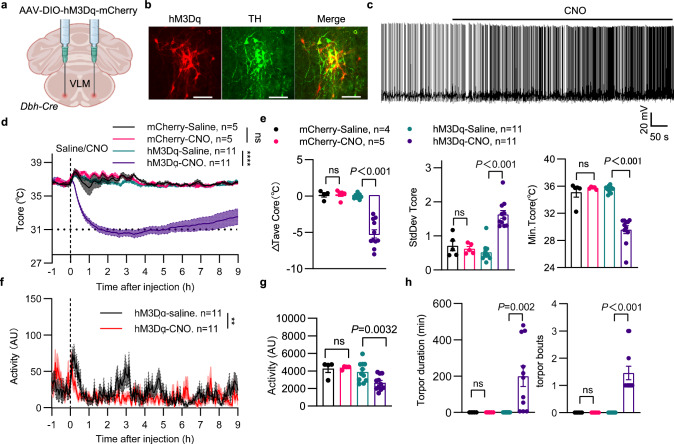
Torpor, an adaptive hypometabolic state in response to fasting, is characterized by pronounced reductions in body temperature, heart rate, and thermogenesis. However, how the brain orchestrates these physiological changes to induce torpor and the relationships among them remain elusive. Inhibiting catecholaminergic (CA) neurons in the ventrolateral medulla (VLM) significantly impairs torpor in mice, while their activation reduces body temperature, heart rate, energy expenditure, physical activity, and thermogenesis. Importantly, the heart rate decline precedes body temperature reduction, resembling patterns observed in natural torpid animals. Moreover, a likely causal relationship exists between heart rate reduction and body temperature decline. VLM-CA neurons may regulate heart rate and thermogenesis through projections to the dorsal motor vagal nucleus and medial preoptic area, respectively. Additionally, these neurons are conserved in Daurian ground squirrels and become active before hibernation, indicating their potential role in hibernation. Here, we find that VLM-CA neurons play important roles in fasting-induced torpor.


Conflict of interest statement

Competing interests: The authors declare no competing interests.

Figures

Fig. 1
Fig. 1. VLM-CA neurons are activated by fasting and required for fasting-induced torpor.
a Experimental strategy for telemetric recording of core body temperature and locomotor activity. b The core body temperature (Tcore) and locomotor activity of a non-fasting mouse (upper panels) and a fasting mouse (bottom panels). ce Fasting induced Fos (green) expression in tyrosine hydroxylase positive (TH+) VLM-CA neurons. c Representative images from mice at different time points during fasting along the rostral-caudal axis. Arrows indicate Fos positive (Fos+) CA neurons. Scale bars: 100 µm. d The percentages of Fos+ neurons among VLM-CA neurons at different time points. e The percentages of Fos+ neurons among VLM-CA neurons along the rostral-caudal axis. Control (n = 3 mice), 6 h (n = 5 mice), 9 h (n = 4 mice) and 15 h (n = 4 mice) in (d, e). fh Chemogenetic inhibition of VLM-CA neurons. f The viral strategy. g Representative images of n = 12 mice showing the expression of hM4Di (red) in VLM-CA neurons. h Representative electrophysiological trace showing CNO (50 µM)-induced inhibition of hM4Di+ VLM-CA neurons. Changes in the core body temperature (Tcore) (i) and locomotor activity (j) of DbhVLM-hM4Di and DbhVLM-mCherry mice during 24-h food deprivation. k Quantitative analysis of the Tcore. Changes in the average Tcore before and after CNO injections (left), variance (middle), and lowest value (right) of the Tcore during fasting. l Total torpor time spent with Tcore ≤ 31 °C and number of torpor bouts with Tcore ≤ 31 °C during fasting. m Quantitative physical activity during the periods of 10–18 h and 10–24 h post food deprivation. The dashed lines in (i, j) denote the timing of the CNO injections. The gray bar indicates the dark phase (20:00 to 8:00). Two-tailed unpaired Student’s t-test in (d, k, l, m). Two-tailed paired Student’s t-test in (e). Two-way ANOVA analysis in (i). ns, not significant (P > 0.05). Data are presented as the means ± SEM. Source data are provided as a Source Data file. Figure 1a was created in BioRender. Zhan, C. (2025) https://BioRender.com/s14s282. Figure 1f was created in BioRender. Zhan, C. (2025) https://BioRender.com/fi02cic.
Fig. 2
Fig. 2. VLM-CA neurons are sufficient to induce torpor in non-fasted mice.
ac Chemogenetic activation of VLM-CA neurons. a The viral strategy. b Representative images of n = 5 mice showing the expression of hM3Dq (red) in TH+ VLM-CA neurons. Scale bars: 100 µm. c Representative electrophysiological trace showing CNO (10 µM)-induced activation of hM3Dq+ VLM-CA neurons. dh Changes in the core body temperature (Tcore) (d, P < 0.0001) and physical activity (f, P = 0.0057) of DbhVLM-hM3Dq and DbhVLM-mCherry mice following CNO or saline injections. e Quantitative analysis of changes in the average Tcore (left), variance (middle) and lowest (right) Tcore after CNO or saline injections. g Quantitative physical activities. h Total torpor duration and number of torpor bouts. The dashed lines in (d, f) denote the timing of CNO or saline injection. Two-way ANOVA analysis in (d, f). Two-tailed paired Student’s t-test in (e, g, h). Data are presented as mean ± SEM. ns, not significant P > 0.05. Source data are provided as a Source Data file. Figure 2a was created in BioRender. Zhan, C. (2025) https://BioRender.com/fi02cic.
Fig. 3
Fig. 3. Activation of VLM-CA neurons reduces metabolic rate and thermogenesis.
Oxygen consumption (a), carbon dioxide production (b), and calculated energy expenditure (c) in DbhVLM-hM3Dq and DbhVLM-mCherry mice following CNO or saline injections. Quantitative data for the 6 h following CNO or saline injections are shown in the bottom panels. d–f iBAT thermogenesis of DbhVLM-hM3Dq mice following CNO or saline injections. d Experimental setup. e Representative infrared images showing surface body temperature at 0, 30, 60, and 120 min after CNO or saline injections. f Quantitative analysis of the iBAT surface temperature. g–i iBAT sympathectomy. g Representative image of iBAT sympathectomy, involving cutting off five sympathetic nerve bundles. Noradrenaline (NA) concentration (h) and representative images (i, n = 3 mice) of sympathetic nerves (red, TH) in iBAT after sympathectomy or sham surgery. Scale bar: 500 µm. Relative mRNA expression of Ucp1 gene in iBAT (j), Tcore (k), iBAT temperature (l), and locomotion activity (m) of DbhVLM-hM3Dq mice before and after sympathectomy following CNO and saline injections. Two-way ANOVA analysis in (a, b, c, f, k, l, m). Two-tailed unpaired Student’s t-test and paired Student’s t-test in the bottom panels of (a, b, c, h), as appropriate. One-way ANOVA in (j). Data are presented as mean ± SEM. ns not significant P > 0.05. Source data are provided as a Source Data file. Figure 3d was created in BioRender. Zhan, C. (2025) https://BioRender.com/fi02cic.
Fig. 4
Fig. 4. Activation of VLM-CA neurons enhances heat dissipation and promotes cool preference.
ac Optogenetic activation of VLM-CA neurons. a The viral strategy. b Representative images showing the expression of SSFO (green) in TH+ VLM-CA neurons. Scale bar: 100 µm. c Representative electrophysiological trace illustrating the activation of SSFO+ VLM-CA neurons by a blue light pulse (2 s, blue bar). dg The body temperature of DbhVLM-SSFO and DbhVLM-GFP control mice before and after light stimulation (indicated by blue bars, 20 Hz, 30 s). Representative infrared images (d), quantitative analysis of tail (e) and iBAT (f) surface temperature, and core body temperature (g, P = 0.0033). hj Thermal gradient assay schematic with heatmaps depicting the cumulative positions of a representative DbhVLM-hM3Dq mouse on a thermal gradient for 50 min following saline or CNO injection. The average gradient position (0 = 50 °C, 1 = 15 °C) (i, P = 0.0386) and median gradient position (j, P = 0.0003, each point represents one mice) during the 50-min period. The dashed lines in (i) denote the timing of CNO or saline injection. Two-way ANOVA analysis in (e, f, g, i). Two-tailed paired Student’s t-test in (j). Data are presented as mean ± SEM. *P < 0.05; ***P < 0.001. Source data are provided as a Source Data file. Figure 4a was in created in BioRender. Zhan, C. (2025) https://BioRender.com/k4e71f1. Figure 4h includes a mouse illustration created in BioRender. Zhan, C. (2025) https://BioRender.com/k4e71f1.
Fig. 5
Fig. 5. Activation of VLM-CA neurons triggers preceding heart rate decline prior to body temperature drop.
ac ECG recordings of heart rate in freely behaving DbhVLM-hM3Dq mice. a Experimental setup for ECG recordings. b Heart rate of freely behaving DbhVLM-hM3Dq mice after CNO or saline injection (P < 0.0001). c Representative ECG traces in mice 1 h after saline or CNO injections. Red arrows indicate skipped heartbeats. d Dynamic changes in heart rate and Tcore in a WT mouse during fasting-induced torpor. The bottom panel shows the four-phase fluctuations during the period indicated by the dashed box in the upper panel. ei Simultaneous recordings of heart rate and Tcore in DbhVLM-SSFO mice following light stimulation (indicated by blue bars, 20 Hz, 30 s). e Experimental setup (left panel) and representative ECG traces (right panel). The red arrow indicates skipped heartbeats. f Changes in heart rate and Tcore of DbhVLM-SSFO mice. g Latency to decrease (upper panel) and latency to the lowest points (bottom panel) of heart rate and Tcore (n = 6 mice, each point represents one mice). h, i Representative traces of a DbhVLM-SSFO mouse showing the dynamic changes in heart rate and Tcore after light stimulation. i The four-phase fluctuations during the period indicated by the dashed box in (h). Two-way ANOVA analysis in (b). Two-tailed paired student’s t-test in (g). Data are presented as mean ± SEM. ****P < 0.0001. Source data are provided as a Source Data file. Figure 5a, e were created in BioRender. Zhan, C. (2025) https://BioRender.com/fi02cic.
Fig. 6
Fig. 6. Downstream neurons of VLM-CA in DVC and MPA regulate body temperature.
a, b Anterograde tracing of VLM-CA neurons. a Schematic of anterograde tracing (upper) and labeled VLM-CA neurons (bottom). b Representative images of VLM-derived projections in DVC, DMH, MPA, and PVN (n = 4 regions per 7 independent biological replicate). Scale bars: 200 µm. c Representative images of Fos signals in DVC, DMH, MPA, and PVN of DbhVLM-hM3Dq (bottom panels, n = 3 animals) and DbhVLM-mCherry control (upper panels, n = 2 animals) mice. Fos immunostaining was performed 2 h after CNO injections. Scale bars: 100 µm. Schematic of the Fos-Triggered Downstream Neuronal Activation (FTDNA) strategy (d) and representative results (e) of selective expression of SSFO in VLM-activated neurons (Fos+) in the MPA (n = 521 cells in 3 MPA area sections from 3 animals). FTDNA-based optogenetic activation (indicated by blue bars, 20 Hz, 30 s) of the VLMM3 → PVNSSFO (f, P = 0.0028), VLMM3 → DMHSSFO (g, P = 0.0012), VLMM3 → MPASSFO (h, P = 0.0042), and VLMM3 → DVCSSFO (i, P = 0.0019) neural circuits, respectively. The left panels show SSFO expression and fiber implantation, and the right panels show Tcore. Two-way ANOVA analysis in (f, g, h, i). Data are presented as mean ± SEM. *P < 0.05; **P ≤ 0.01. Source data are provided as a Source Data file.
Fig. 7
Fig. 7. Functional roles of the VLMDbh → DVC and VLMDbh → MPA neural circuits in body temperature and heart rate regulation.
a, b Selective activation of the VLMDbh → DVC or VLMDbh → MPA neural circuits by direct infusion of CNO (1 µl, 0.5 µg/µl dissolved in saline) into the DVC or MPA through pre-implanted cannulas. a Experimental schematic. b Representative images of cannula positions in the DVC and MPA. The effects of selective activation of the VLMDbh → MPA neural circuit on core body temperature (c, P = 0.0461), heart rate (d, P = 0.0315), and iBAT thermogenesis (e, P = 0.0095). The effects of selective activation of the VLMDbh → DVC neural circuit on core body temperature (f, P = 0.0195), heart rate (g, P = 0.0084), and iBAT thermogenesis (h, P = 0.0122). i In vitro whole-cell recording of DMV neurons during optogenetic activation of VLM-CA neuronal projections (blue bar, 5 ms) in the DVC of DbhVLM-ChR2 mice. Representative traces (middle panel) of EPSCs following administering: (1) artificial cerebrospinal fluid (ACSF), (2) picrotoxinin (PTX), (3) 6,7-dinitroquinoxaline-2,3-dione (DNQX), and (4) after a washout period. Group data (right panel, n = 9 neurons). All recordings were performed during the application of TTX (10 µM) and 4-AP (1 mM). The effects of saline or isoproterenol on the heart rate (j) and Tcore (k). lr The impacts of selective inhibition of the MPA or DVC on the body temperature and heart rate. l Schematic of the FTDNI strategy. Changes in core body temperature (m, P = 0.1453), heart rate (n, P = 0.8122) and iBAT temperature (o, P = 0.3244) when selectively inhibiting MPA neurons. Changes in core body temperature (p, P = 0.7215), heart rate (q, P = 0.7967) and iBAT temperature (r, P = 0.9174) when selectively inhibiting DVC neurons. Two-way ANOVA analysis in (ch, mr). Two-tailed paired Student’s t-test in (i). Data are presented as mean ± SEM. ns, not significant P > 0.05; *P < 0.05; **P ≤ 0.01. Source data are provided as a Source Data file. Figure 7a includes a gavage tube illustration created with BioRender.com. Zhan, C. (2025) https://BioRender.com/k4e71f1. Figure 7i was created in BioRender. Zhan, C. (2025) https://BioRender.com/fi02cic. Figure 7l were manually drawn based on anatomical features using Microsoft PowerPoint.

Similar articles

References

    1. Overton, J. M. & Williams, T. D. Behavioral and physiologic responses to caloric restriction in mice. Physiol. Behav.81, 749–754 (2004). - PubMed
    1. Knight, W. D., Witte, M. M., Parsons, A. D., Gierach, M. & Overton, J. M. Long-term caloric restriction reduces metabolic rate and heart rate under cool and thermoneutral conditions in FBNF1 rats. Mech. Ageing Dev.132, 220–229 (2011). - PMC - PubMed
    1. Zimmer, M. B. & Milsom, W. K. Effects of changing ambient temperature on metabolic, heart, and ventilation rates during steady state hibernation in golden-mantled ground squirrels (Spermophilus lateralis). Physiol. Biochem. Zool.74, 714–723 (2001). - PubMed
    1. Ou, J. et al. iPSCs from a hibernator provide a platform for studying cold adaptation and its potential medical applications. Cell173, 851–863.e816 (2018). - PMC - PubMed
    1. Cerri, M., Hitrec, T., Luppi, M. & Amici, R. Be cool to be far: exploiting hibernation for space exploration. Neurosci. Biobehav. Rev.128, 218–232 (2021). - PubMed

MeSH terms

LinkOut - more resources