. 2025 Jul 1;16(1):5491.
doi: 10.1038/s41467-025-61067-8.

ACSS2 protects against alcohol-induced hepatocyte ferroptosis through regulation of hepcidin expression

Affiliations

ACSS2 protects against alcohol-induced hepatocyte ferroptosis through regulation of hepcidin expression

Mengyao Wang et al. Nat Commun. .

Abstract

Acetate is the end product of alcohol metabolism. Acyl-CoA synthetase short-chain family member 2 (ACSS2) converts acetate to acetyl-CoA, involving metabolic pathways and epigenetic regulation. However, the function of ACSS2-mediated epigenetic control in alcoholic liver disease (ALD) remains incompletely understood. We demonstrate that alcohol downregulates hepatic ACSS2, causing acetate accumulation in the liver and serum. This disrupts iron metabolism and hepatic ferroptosis, triggering liver injury and inflammation. Mechanistically, ACSS2 binds CREB binding protein (CBP) to mediate histone acetylation and regulate hepcidin antimicrobial peptide 1/2 (HAMP1/2) transcription. ACSS2 deficiency downregulates HAMP1/2, causing systemic iron dyshomeostasis and ferroptosis, which is restored by overexpression of HAMP1/2. Iron chelators or ferroptosis inhibitors attenuates alcohol-induced liver injury in ACSS2-deficient mice. Our study uncovers the epigenetic mechanisms of ACSS2-mediated ferroptosis and its role in ALD progression.


Conflict of interest statement

Competing interests: The authors declare no competing interests.

Figures

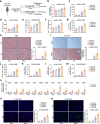
Fig. 1
Fig. 1. ACSS2 is downregulated in ALD models.
a Serum acetate levels in patients with ALD (n = 30 patients per group) and normal control (n = 10 samples per group). b Serum acetate levels in the mice with PF (n = 7 mice per group) and EF (n = 4 mice per group). Liver acetate levels in the mice with PF (n = 6 mice per group) and EF (n = 4 mice per group). c Single-cell RNA-seq analysis of ACSS2 levels in different liver cell types. d, e Heatmap indicating the DEGs in alcoholic hepatitis patients relative to normal controls and EF group relative to PF group from GEO database. f Representative images of the immunohistochemistry staining and quantitative analysis of ACSS2 in human liver sections from the normal (n = 6 samples per group), normal with alcohol history (n = 5 samples per group), alcohol-induced steatosis (n = 17 samples per group), and alcohol-induced steatohepatitis individuals (n = 18 samples per group). Scale bar: 1 mm. g Representative images of the immunofluorescence staining of ACSS2 (red), Alb (green), CD68 (green), α-SMA (green), and DAPI (blue) in the livers of mice with PF and EF (n = 4 mice per group). Immunofluorescence co-localization analysis was quantified respectively by ImageJ. Scale bars, 50 μm. h, i Western blot (n = 6 mice per group) and qPCR (n = 5 mice per group) analysis of relative ACSS2 protein and mRNA levels in the liver of mice with PF and EF. j, k Western blot ( j) and qPCR (k) analysis of relative ACSS2 protein and mRNA levels in MIHA cells exposed to EtOH of varied concentrations (n = 3 biological replicates per group). i–m Western blot analysis of relative ACSS1/2/3 protein levels in mouse HEPs exposed to EtOH of varied concentrations (n = 3 mice per group). m Relative Acss2 mRNA levels in mouse HEPs exposed to EtOH of varied concentrations were detected by qPCR analysis (n = 3 mice per group). Data are presented as the mean ± SD. The p-values were calculated by two-sided test and adjusted for p-values by the Benjamini–Hochberg method to control for false positives due to multiple comparisons (d, e), two-tailed Student’s t test (ac, h, i) and one-way ANOVA (f, jm). Source data are provided as a Source Data file.
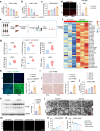
Fig. 2
Fig. 2. Hepatocyte-specific ACSS2 deficiency exacerbates alcohol-induced liver injury and inflammation.
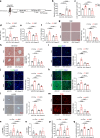
a All female mice were adapted to the fluid diet by feeding the Lieber-DeCarli regular control diet for 5 consecutive days, and the model group were then fed with Lieber-DeCarli ethanol mice diet containing 5% (vol/vol) ethanol for 10 consecutive days and ethanol (5 g/kg) was administered by oral gavage on day 11 as shown in the diagram protocol was created with MedPeer (medpeer.cn). b Ratios of liver weight to body weight of Acss2-Flox and Acss2-HKO mice fed with an PF or EF diet (n = 8 mice per group). c, d Serum ALT (c) and AST (d) concentrations in the indicated groups of mice (n = 8 mice per group). eg, Hepatic TG (e), TC (f), and FFA (g) content in the indicated groups of mice (n = 5 mice per group). h Representative H&E staining images in liver sections from the indicated groups of mice and quantification of relative vacuolar areas (n = 5 mice per group). Scale bar: 50 μm. i Representative Oil Red O staining images in liver sections from the indicated groups of mice and quantification of relative staining areas (n = 5 mice per group). Scale bar: 50 μm. jm Serum levels of TNF-α ( j) and liver levels of TNF-α (k), IL-1β (l), and IL-6 (m) were detected by ELISA (n = 5 mice per group). n Relative mRNA levels of pro-inflammatory and chemokine molecules were detected by qPCR analysis in the liver of Acss2-Flox and Acss2-HKO mice fed with EF (n = 5 mice per group). o, p Representative images of the immunofluorescence staining and quantitative analysis of F4/80 (red) and CD68 (green) in the livers of mice from the indicated groups in which nuclei were stained with DAPI (blue, n = 5 mice per group). Scale bar: 50 μm. Data are presented as the mean ± SD. The p-values were calculated by two-way ANOVA. Source data are provided as a Source Data file.
Fig. 3
Fig. 3. Hepatocyte-specific ACSS2 depletion aggravates alcohol-induced iron metabolism disorder.
a GO enrichment analysis of gene networks associated with biological processes in the liver of Flox-EF and HKO-EF mice. b Volcano plot of the differentially up-(red) or down-(bule) regulated genes between Flox-EF and HKO-EF groups. c Heatmap of DEGs related to iron metabolism in the liver of Flox-EF and HKO-EF mice (n = 3 mice per group). d Schematic of hepcidin-mediated systemic iron homeostasis was created with MedPeer (medpeer.cn). e Relative mRNA levels of genes related to iron metabolism in the liver of Flox-EF and HKO-EF mice were detected by qPCR analysis (n = 5 mice per group). f Western blot analysis of relative FPN protein levels in the liver of Flox-EF and HKO-EF mice (n = 3 mice per group). gj Representative images of the immunohistochemistry staining and quantitative analysis of HAMP1/2 (g, n = 3 mice per group) in liver sections and FPN in the liver (h, n = 3 mice per group), duodenum (i, n = 5 mice per group) and spleen ( j, n = 5 mice per group) of the indicated groups of mice. Scale bar: 50 μm. km Representative images of DAB enhanced Prussian Blue staining and quantitative analysis of iron content in the liver (k), duodenum (l), and spleen (m) of the indicated groups of mice (n = 5 mice per group). Scale bar: 50 μm. nq Levels of hepcidin and iron content in serum and liver of the indicated groups of mice (n = 5 mice per group). r, s Serum hepcidin (r) and iron (s) levels in the patients with ALD (n = 30 patients per group) and normal control (n = 10 samples per group). tv, Correlation analyses were conducted between serum acetate and iron levels (t), acetate and hepcidin levels (u), as well as iron and hepcidin levels (v) in human samples (n = 40 samples). Data are presented as the mean ± SD. The p-values were calculated by two-sided test and adjusted for p-values by the Benjamini–Hochberg method to control for false positives due to multiple comparisons (b). The p-values were calculated by two-tailed Student’s t test (e, f, r, s), two-way ANOVA (gq), and Spearman correlation analysis (tv). Source data are provided as a Source Data file.
Fig. 4
Fig. 4. Hepatocyte-specific ACSS2 deficiency exacerbates alcohol-induced ferroptosis.
ac Hepatic GSH (a), SOD (b), and ROS (c) content in mice of the indicated groups (n = 5 mice per group). d Representative images of DHE staining and quantitative analysis of ROS in mouse liver of the indicated groups (n = 5 mice per group). Scale bar: 50 μm. e Schematic representation of mouse liver subjected to metabolomics analysis was created with MedPeer (medpeer.cn). f Heatmap showing the expression of metabolites involved in oxidized lipids (n = 3 mice per group). g Levels of ±8-HDoHE, ±13-HDoHE, 13S-HODE, 9R-HETE, PGE1, and PGE2 in the liver of Flox-EF and HKO-EF mice (n = 3 mice per group). h Representative images of BODIPY 581/591 C11 staining and quantitative analysis of lipid peroxidation in the liver of the indicated groups of mice (n = 3 mice per group). Scale bar: 50 μm. i Representative images of immunohistochemistry staining and quantitative analysis of 4-HNE in the liver of the indicated groups of mice (n = 5 mice per group). Scale bar: 50 μm. j Hepatic MDA content in the indicated groups of mice (n = 5 mice per group). k Western blot analysis of relative 4-HNE levels in the liver of Flox-EF and HKO-EF mice (n = 6 mice per group). l Representative images showed by electron microscopy in the liver of Flox-EF and HKO-EF mice Scale bars: 2 μm (low-magnification images) and 0.5 μm (high-magnification images). Yellow arrows pointed to atrophic mitochondria. Red arrows indicated mitochondrial membrane disruption. m Cell death of AML12 cells transfected with Acss2 small interfering RNA (si-Acss2) or the scramble control (si-NC) and treated with EtOH (400 mM) was visualized by PI staining. n Proportion of dead cells was detected by flow cytometry in AML12 cells transfected with si-Acss2 or si-NC and treated with EtOH (400 mM, n = 3 biological replicates per group). o Relative cell viability was measured by CCK-8 assay in AML12 cells transfected with si-Acss2 or si-NC and treated with EtOH (400 mM, n = 8 biological replicates). Data are presented as the mean ± SD. The p-values were calculated by two-tailed Student’s t test (d, gi, k) and two-way ANOVA (ac, j, n, o). Source data are provided as a Source Data file.
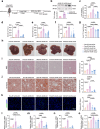
Fig. 5
Fig. 5. ACSS2 overexpression in hepatocytes decreases alcohol-induced liver injury and inflammation in mice.
a ACSS2 overexpression in hepatocytes were achieved by AAV-Acss2 administration. AAV-Ctrl was used as control. After 2 weeks, all mice were adapted to the fluid diet by feeding the Lieber-DeCarli regular control diet for 5 consecutive days, and the model group were then fed with Lieber-DeCarli ethanol mice diet containing 5% (vol/vol) ethanol for 10 consecutive days and ethanol (5 g/kg) was administered by oral gavage on day 11 as shown in the diagram protocol was created with MedPeer (medpeer.cn). b The efficacy of AAV-Acss2 was determined by western blot in the liver of mice injected with AAV-Acss2 and AAV-Ctrl (n = 6 mice per group). c Ratios of liver weight to body weight in Acss2-Flox and Acss2-HKO mice transduced with AAV-Acss2 or AAV-Ctrl and fed with PF or EF (n = 5 mice per group). dg Serum ALT (d) and AST (e) concentrations, and hepatic TG (f) and TC (g) content in the indicated groups of mice (n = 5 mice per group). h Representative images of whole liver tissue from Acss2-Flox and Acss2-HKO mice transduced with AAV-Acss2 or AAV-Ctrl. i Representative H&E staining images in liver sections from the indicated groups of mice and quantification of relative vacuolar areas (n = 5 mice per group). Scale bar: 50 μm. j Representative Oil Red O staining images of liver sections from the indicated groups of mice and quantification of relative staining areas (n = 5 mice per group). Scale bar: 50 μm. k Representative images of the immunofluorescence staining and quantitative analysis of levels of CD68 in the livers of mice from the indicated groups in which nuclei were stained with DAPI (n = 5 mice per group). Scale bar: 50 μm. lo Relative mRNA levels of F4/80 and Cd68 (l, m, n = 5 mice per group), Il-1β (n, n = 3 mice per group) and Vcam-1 (q, n = 3 mice per group) were detected by qPCR analysis in the livers of mice from the indicated groups. Data are presented as the mean ± SD. The p-values were calculated by two-tailed Student’s t-test. Source data are provided as a Source Data file.
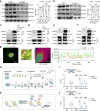
Fig. 6
Fig. 6. ACSS2 regulates the transcription of HAMP1/2 via CBP-mediated histone acetylation.
a, b Western blot analysis of histones H3 and H4 related acetylated proteins in the AML12 cells transfected with si-Acss2 or si-NC (n = 3 biological replicates per group). c Western blot analysis of Co-IP of the Flag-ACSS2 with HA-CBP in the AML12 cells transfected with the vector of HA-CBP and Flag-ACSS2. d Western blot analysis of Co-IP of the Flag-ACSS2 with endogenous CBP in the AML12 cells transfected with the vector of Flag-ACSS2. e, f Western blot analysis of Co-IP of the endogenous ACSS2 with endogenous CBP in the AML12 cells. g Immunofluorescence staining and analysis of colocalization of CBP and ACSS2 in AML12 cells. h Schematic of ChIP-qPCR assay procedure was created with MedPeer (medpeer.cn). i, j ChIP-qPCR assays of the enrichment of CBP, H3K9ac and H4K8ac at Hamp1 and Hamp2 promoters in the AML12 cells transfected with si-Acss2 or si-NC (n = 3 biological replicates per group). IgG was used as the negative control and H3 was used as the positive control. k Schematic of the effect of ACSS2 and CBP complex on regulation of Hamp1/2. Data are presented as the mean ± SD. The p-values were calculated by two-tailed Student’s t-test. Source data are provided as a Source Data file.
Fig. 7
Fig. 7. HAMP1/2 overexpression in hepatocytes alleviates alcohol-induced liver injury and inflammation in Acss2-HKO mice.
a HAMP1/2 overexpression in hepatocytes was achieved by AAV-Hamp1/2 administration. AAV-Ctrl was used as control. After 2 weeks, all mice were adapted to the fluid diet by feeding the Lieber-DeCarli regular control diet for 5 consecutive days, and the model group were then fed with Lieber-DeCarli ethanol mice diet containing 5% (vol/vol) ethanol for 10 consecutive days and ethanol (5 g/kg) was administered by oral gavage on day 11 as shown in the diagram protocol was created with MedPeer (medpeer.cn). b Hepcidin levels in serum of Acss2-Flox and Acss2-HKO mice transduced with AAV-Hamp1/2 or AAV-Ctrl with EF diet (n = 5 mice per group). c Ratios of liver weight to body weight of the indicated groups of mice (n = 5 mice per group). df Serum ALT (d) concentrations, hepatic TG (e) and TC (f) content of the indicated groups of mice (n = 5 mice per group). g, h Representative H&E staining (g) and Oil Red O staining (h) images in liver sections from the indicated groups of mice and quantification of damaged area (n = 5 mice per group). Scale bar: 50 μm. i, j Representative images of the immunofluorescence staining and quantitative analysis of CD68 (i) and F4/80 ( j) in the liver from the indicated groups of mice in which nuclei were stained with DAPI (n = 5 mice per group). Scale bar: 50 μm. k Representative images of BODIPY 581/591 C11 staining (k), immunohistochemistry staining for 4-HNE (l), and DHE staining (m) in the liver from the indicated groups of mice (n = 5 mice per group). Scale bar: 50 μm. Quantitative analysis was also provided for each staining. n, o Hepatic MDA (n) and GSH (o) content in mice of the indicated groups (n = 5 mice per group). p, q Acetaldehyde levels in the serum and liver of the indicated groups of mice (n = 5 mice per group). Data are presented as the mean ± SD. The p-value was calculated by two-way ANOVA. Source data are provided as a Source Data file.
Fig. 8
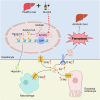
Fig. 8. Schematic diagram of the mechanism by which ACSS2 regulates ferroptosis in ALD.
ACSS2 interacts with the histone acetyltransferase CBP on the HAMP1/2 promoter, promoting histone acetylation and enhancing hepcidin transcription. In mice with ALD, downregulation of hepatic ACSS2 impairs this process, leading to reduced hepcidin secretion and disrupted iron homeostasis. Consequently, iron overload occurs in hepatocytes, promoting ferroptosis. The figure was created with MedPeer (medpeer.cn).

References

    1. Wu, X. et al. Recent advances in understanding of pathogenesis of alcohol-associated liver disease. Annu. Rev. Pathol.18, 411–438 (2023). - PMC - PubMed
    1. Devarbhavi, H. et al. Global burden of liver disease: 2023 update. J. Hepatol.79, 516–537 (2023). - PubMed
    1. Yan, C. et al. Pathogenic mechanisms and regulatory factors involved in alcoholic liver disease. J. Transl. Med.21, 300 (2023). - PMC - PubMed
    1. Seitz, H. K. et al. Alcoholic liver disease. Nat. Rev. Dis. Prim.4, 16 (2018). - PubMed
    1. Mascord, D., Smith, J., Starmer, G. A. & Whitfield, J. B. Effects of increasing the rate of alcohol metabolism on plasma acetate concentration. Alcohol Alcohol27, 25–28 (1992). - PubMed

MeSH terms

LinkOut - more resources