. 2025 Jul 1;16(1):6042.
doi: 10.1038/s41467-025-61358-0.

Mapping the nuclear landscape with multiplexed super-resolution fluorescence microscopy

Affiliations

Mapping the nuclear landscape with multiplexed super-resolution fluorescence microscopy

Fariha Rahman et al. Nat Commun. .

Abstract

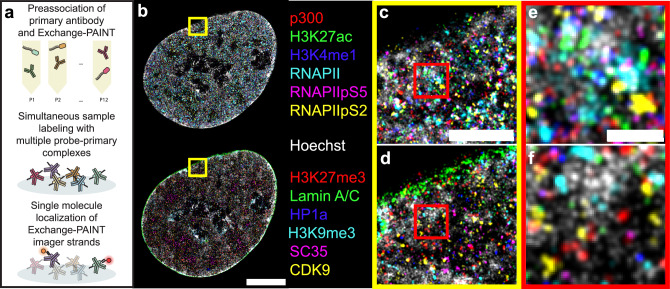
The nucleus coordinates many different processes. Visualizing how these are spatially organized requires imaging protein complexes, epigenetic marks, and DNA across scales from single molecules to the whole nucleus. To accomplish this, we develop a multiplexed imaging protocol to localize 13 different nuclear targets with nanometer precision. Within single cells, we show that nuclear specification into active and repressive states exists along a spectrum of length scales, emerging below one micron and becoming strengthened at the nanoscale with unique organizational principles in both heterochromatin and euchromatin. HP1α was positively correlated with DNA at the microscale but uncorrelated at the nanoscale. RNA Polymerase II, p300, and CDK9 were positively correlated at the microscale but became partitioned below 300 nm. Perturbing histone acetylation or transcription disrupted nanoscale organization but had less effect at the microscale. We envision that our imaging and analysis pipeline will be useful to reveal the organizational principles not only of the cell nucleus but also other cellular compartments.


Conflict of interest statement

Competing interests: The authors declare no competing interests.

Figures

Fig. 1
Fig. 1. Overview of exchange-PAINT protocol and representative super-resolution rendering of the nucleus with 13 labels.
a Schematic of the Exchange-PAINT sample preparation and imaging pipeline. b 13-plex rendering of a representative unperturbed nucleus, scale bar 5 μm. c, d Top and bottom insets of (b), respectively, scale bar 1 μm. e, f Insets of (c, d), respectively, scale bar 200 nm. Source data are provided as a Source Data file.
Fig. 2
Fig. 2. Quantification of exchange-PAINT target localization using the pair correlation function and fractal dimension.
a Representative rendering of a Hoechst labeled nucleus and a scrambled distribution for complete spatial randomness (CSR). b Demonstration of the pair correlation function (PCF) for a simulated clustered distribution (upper) and a simulated CSR distribution (lower). c PCF and representative inset for Hoechst. d Pair cross correlation (PCCF) for Exchange-PAINT targets. Representative insets are from the same region as in (a—right). e Box plots of the hinge points for bilinear fits corresponding to plots in (d). Inset shows a representative bilinear fit for H3K27ac indicating the two linear regions. Lower panel shows a clipped y-axis to highlight changes between targets. f Box plots for the fractal dimension of the first linear region for plots in (d). g Box plots for the fractal dimension of the second linear region for plots in (d). Scale bars = 5 μm—(a—left), 1 μm—(a—center), 500 nm– (a—right and c, d—insets). Data from (c, d) are mean ± standard deviation. For boxplots in (eg) the minima and maxima of the box indicate the 25th and 75th percentiles respectively, the central mark indicates the median, and the whiskers extend to the most extreme data points not considered outliers defined as data points that are more than 1.5 times the interquartile range away from the bottom or top of the box. Data in (cg) are from at least 3 independent biological replicates with specific samples sizes listed in Supplementary Table 6. Source data are provided as a Source Data file.
Fig. 3
Fig. 3. Using the PCCF to understand the spatial relationships between target pairs.
a Simulated point distributions for two species wherein 20% of the molecules of each species are enriched together within 500 nm diameter clusters yet display no correlation within a cluster. b Simulated point distributions for two species wherein 20% of the molecules of each species are enriched together within 500 nm diameter clusters and partition to different halves within a cluster. c PCCF outputs corresponding to (c—magenta), (d—green), and CSR for each species (blue). Data in (c) are from 3 independent simulated distributions and are mean ± standard deviation. Source data are provided as a Source Data file.
Fig. 4
Fig. 4. Quantification of exchange-PAINT target distributions using the pair cross correlation function.
Heatmaps of the average fold enrichment computed from the normalized PCCF curves of each target-target pair over a radii range from 40 to 200 nm (a) and 200–2000 nm (b). Values are clipped at extrema to highlight variation. c Representative rendering of a Hoechst-labeled nucleus showing the region of interests for the renderings in (eg). d PCCF curves for Hoechst vs. Exchange-PAINT targets. Representative renders and PCCF curves for histone PTM’s (e), transcription-associated targets (f), and heterochromatin-associated targets (g). Scale bars = 5 μm—(c), 200 nm—(eg). Data from (dg) are mean ± standard deviation. Data in (ag) are from at least 3 independent biological replicates with specific samples sizes listed in Supplementary Table 6. Source data are provided as a Source Data file.
Fig. 5
Fig. 5. Multiplexed imaging and quantification of SC35 speckles.
a Representative rendering and zoomed inset of speckle-associated Exchange-PAINT targets. b PCCF curves for SC35 vs. select Exchange-PAINT targets. Scale bars = 5 μm—(a), 200 nm—(zoom). Data from (b) are mean ± standard deviation and are from at least 3 independent biological replicates with specific samples sizes listed in Supplementary Table 6. Source data are provided as a Source Data file.
Fig. 6
Fig. 6. Quantifying the effects of histone deacetylase inhibition on nuclear organization.
a Representative renderings and zoomed insets of control and TSA treated nuclei showing Hoechst and H3K27ac. b Pair correlation function quantification of H3K27ac self-association under control (blue) and TSA (orange) treated conditions. Inset shows a boxplot of the localization density normalized by the imager strand concentration for each condition. c Pair correlation function quantification of Hoechst self-association under control (blue) and TSA (orange) treated conditions. Heatmap of the difference between control and TSA conditions on the average fold enrichment for each target-target pair over a radii range from 40 to 200 nm (d) and 200–2000 nm (e). Values are clipped at extrema to highlight variation. Black outlines represent comparisons where p < = 0.05 by two sided Student’s T test. Scale bars = 5 μm—(a), 200 nm—(zoom). Data from (b, c) are mean ± standard deviation. Boxplots in (b) are defined as in Fig. 2. Data from (be) are from are from at least 3 independent biological replicates for control and 2 independent biological replicates for TSA with specific samples sizes listed in Supplementary Table 6. Source data are provided as a Source Data file.
Fig. 7
Fig. 7. Quantifying the effects of p300 catalytic inhibition on nuclear organization.
a Representative renderings and zoomed insets of control and A-485 treated nuclei showing Hoechst and H3K27ac. b Pair correlation function quantification of H3K27ac self-association under control (blue) and A-485 (magenta) treated conditions. Inset shows a boxplot of the localization density normalized by the imager strand concentration for each condition. c Pair correlation function quantification of Hoechst self-association under control (blue) and A-485 (magenta) treated conditions. Heatmap of the difference between control and A-485 conditions on the average fold enrichment for each target-target pair over radii from 40 to 200 nm (d) and 200–2000 nm (e). Values are clipped at extrema to highlight variation. Black outlines represent comparisons where p< = 0.05 by two sided Student’s T test. Scale bars = 5 μm—(a), 200 nm—(zoom). Data from (b, c) are mean ± standard deviation. Boxplots in (b) are defined as in Fig. 2. Data from (be) are from are from at least 3 independent biological replicates for control and 2 independent biological replicates for A-485 with specific samples sizes listed in Supplementary Table 6. Source data are provided as a Source Data file.
Fig. 8
Fig. 8. Quantifying the effects of transcription inhibition on nuclear organization.
a Representative renderings and zoomed insets of control and αAM treated nuclei showing Hoechst and RNAPII. b Pair correlation function quantification of RNAPII self-association under control (blue) and αAM (green) treated conditions. Inset shows a boxplot of the localization density normalized by the imager strand concentration for each condition. c Pair correlation function quantification of Hoechst self-association under control (blue) and αAM (green) treated conditions. Heatmap of the difference between control and αAM conditions on the average fold enrichment for each target-target pair over a radii range from 40 to 200 nm (d) and 200–2000 nm (e). Values are clipped at extrema to highlight variation. Black outlines represent comparisons where p <= 0.05 by two sided Student’s T test. Scale bars = 5 μm—(a), 200 nm—(zoom). Data from (b, c) are mean ± standard deviation. Boxplots in (b) are defined as in Fig. 2. Data from (be) are from are from at least 3 independent biological replicates for control and 2 independent biological replicates for αAM with specific samples sizes listed in Supplementary Table 6. Source data are provided as a Source Data file.

Update of

Similar articles

References

    1. Thul, P. J. et al. A subcellular map of the human proteome. Science356, eaal3321 (2017). - PubMed
    1. Dekker, J. et al. The 4D nucleome project. Nature549, 219–226 (2017). - PMC - PubMed
    1. Dekker, J. et al. Spatial and temporal organization of the genome: Current state and future aims of the 4D nucleome project. Mol. Cell83, 2624–2640 (2023). - PMC - PubMed
    1. Lieberman-Aiden, E. et al. Comprehensive mapping of long-range interactions reveals folding principles of the human genome. Science326, 289–293 (2009). - PMC - PubMed
    1. Rao, S. S. P. et al. A 3D map of the human genome at kilobase resolution reveals principles of chromatin looping. Cell159, 1665–1680 (2014). - PMC - PubMed

LinkOut - more resources