. 2025 Jul 2;16(1):6061.
doi: 10.1038/s41467-025-61050-3.

A Hedgehog-Foxf axis coordinates dental follicle-derived alveolar bone formation

Affiliations

A Hedgehog-Foxf axis coordinates dental follicle-derived alveolar bone formation

Mizuki Nagata et al. Nat Commun. .

Abstract

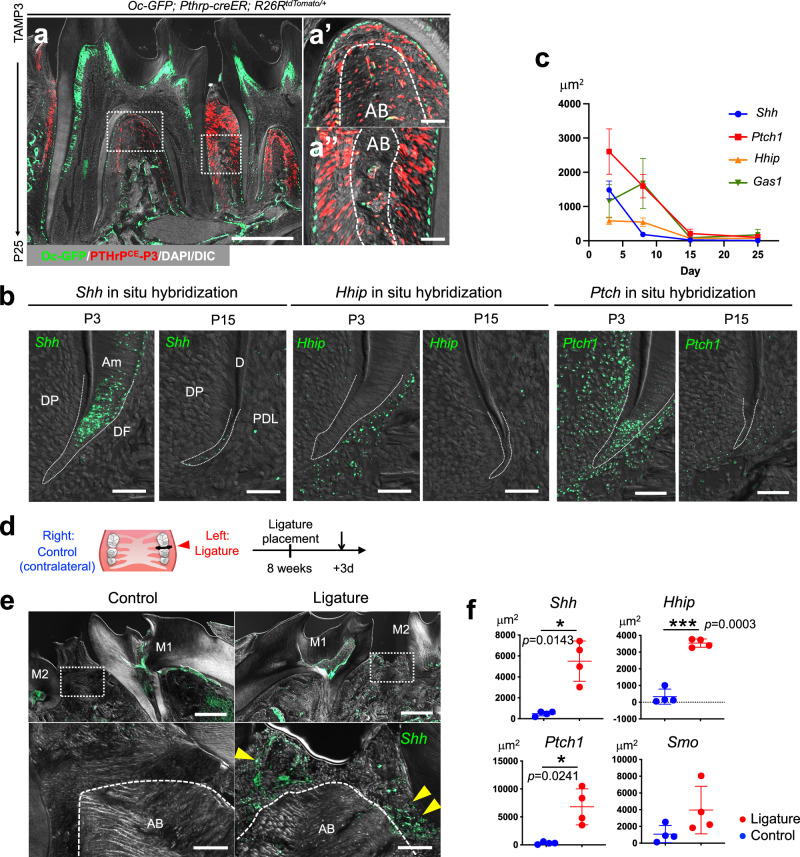
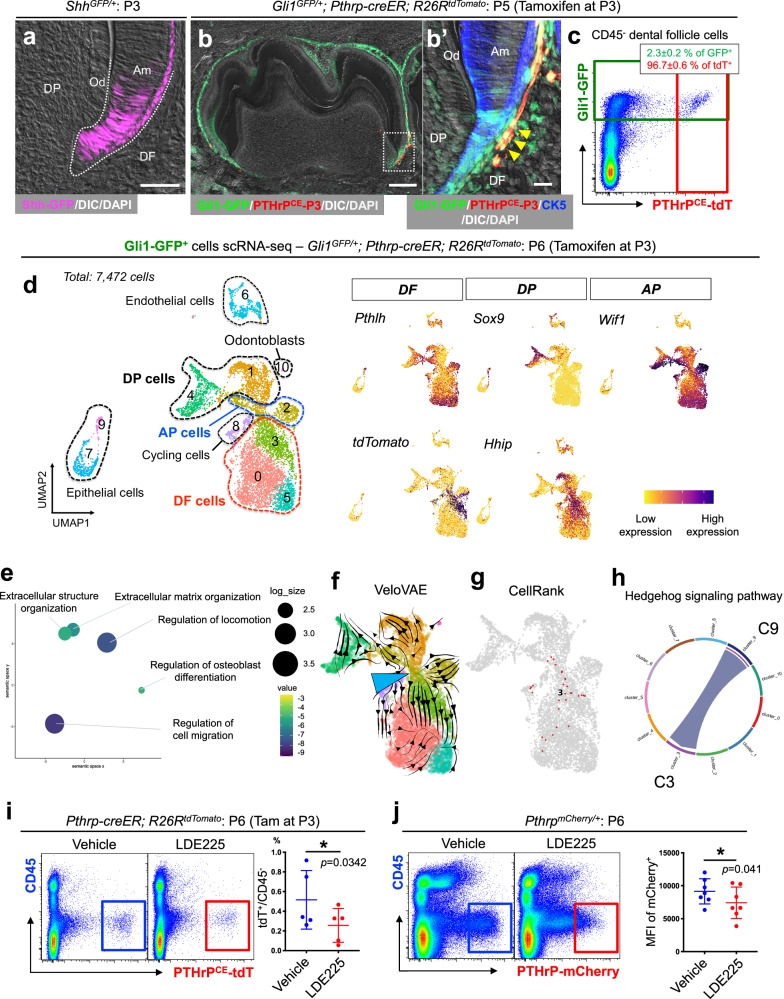
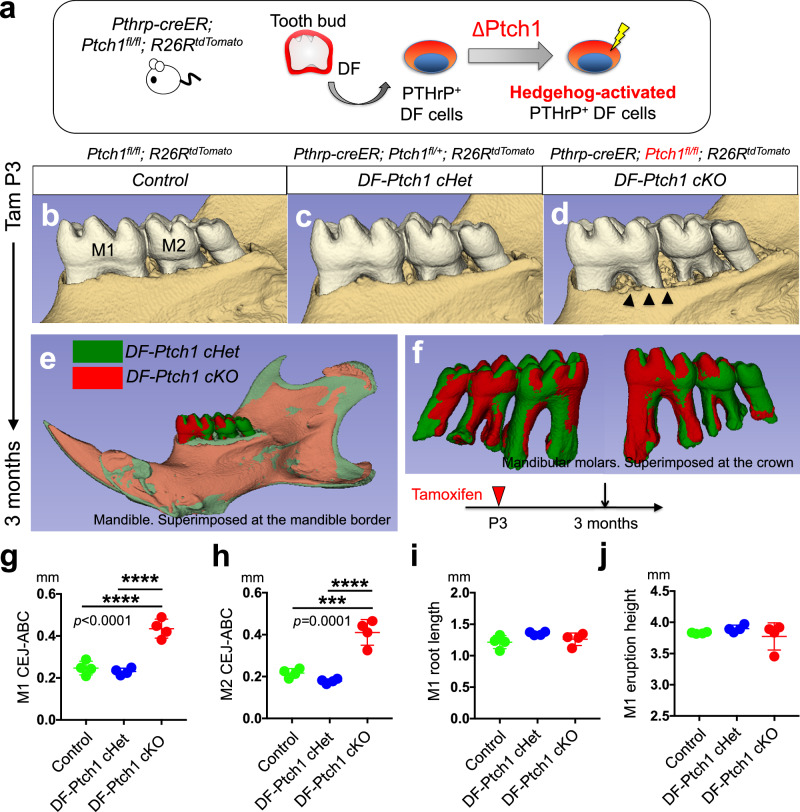
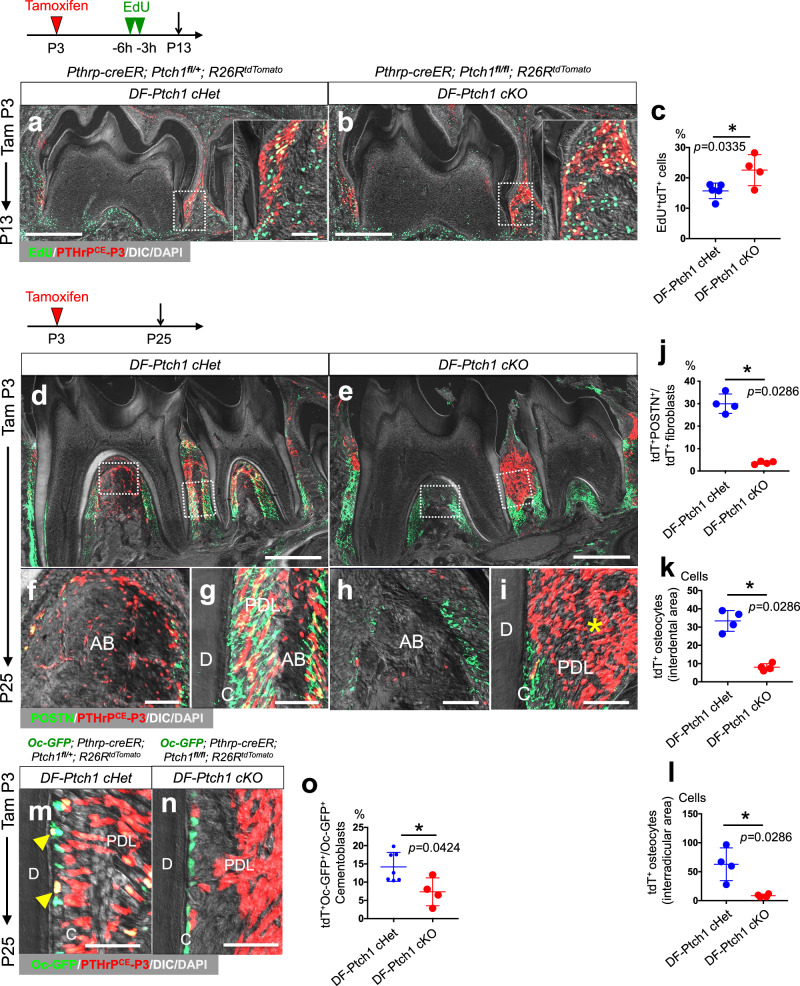
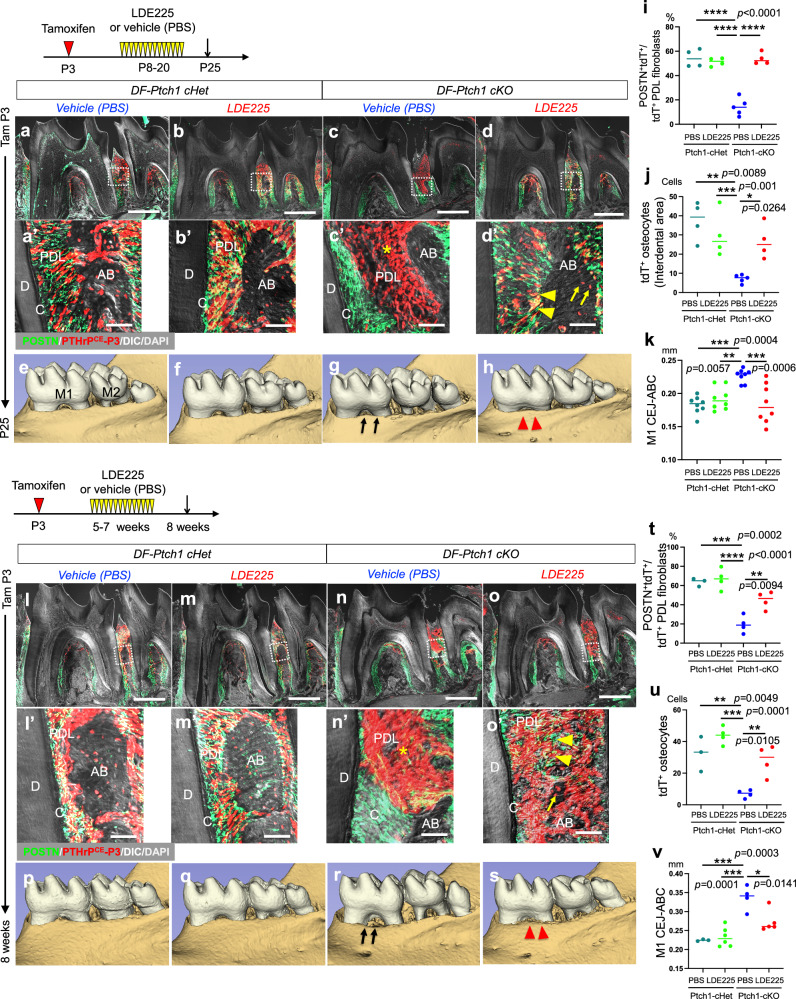
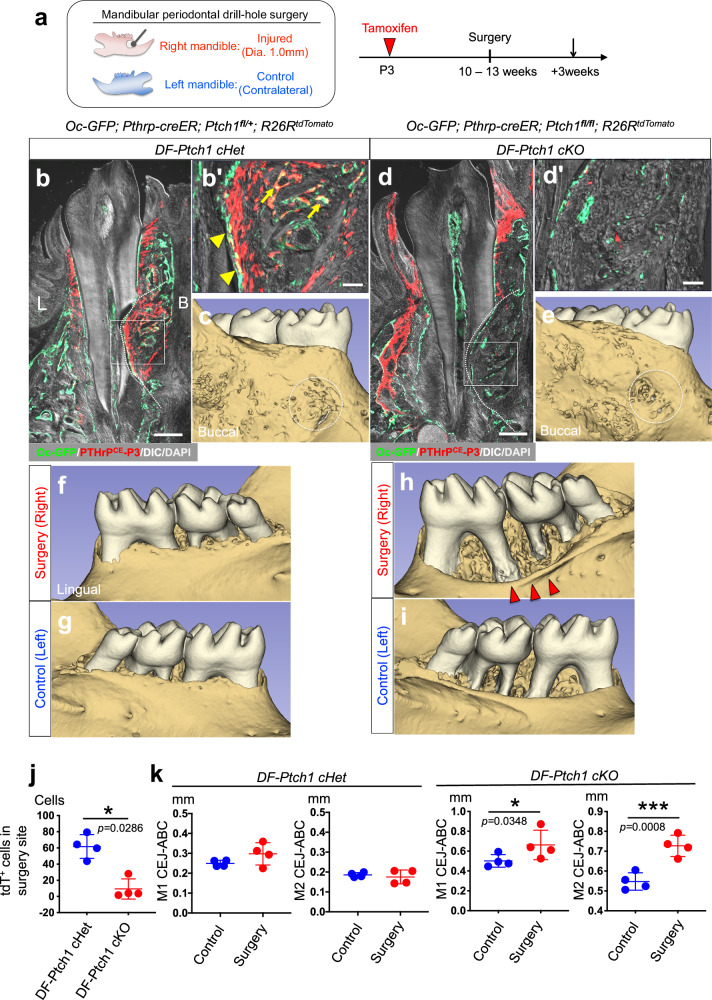
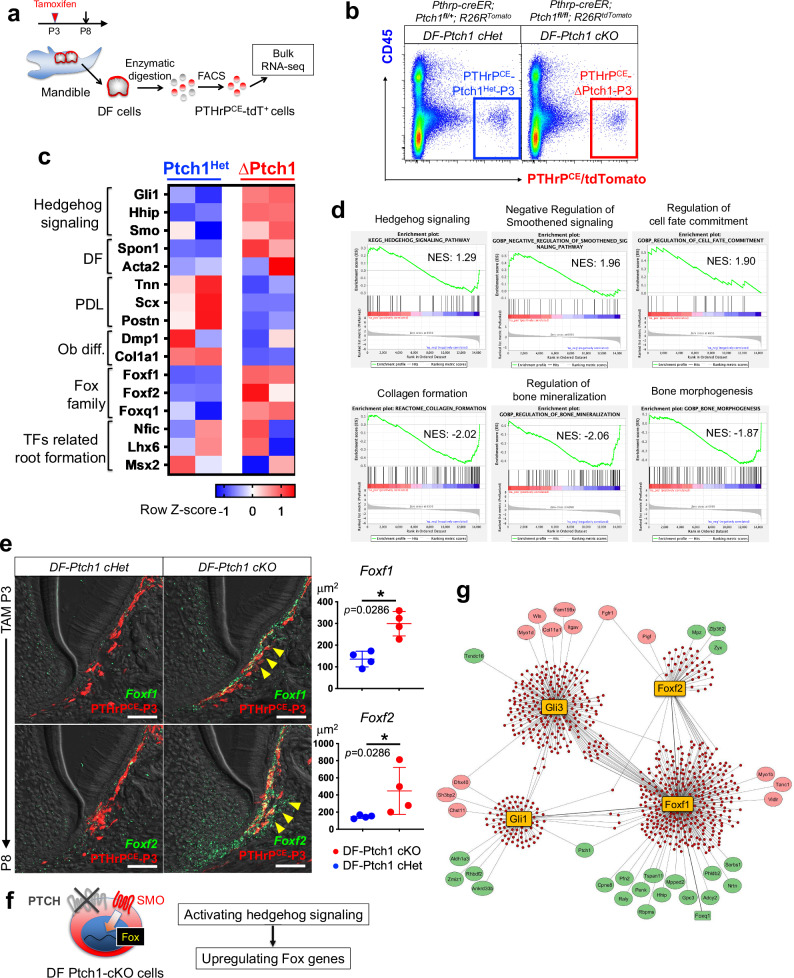
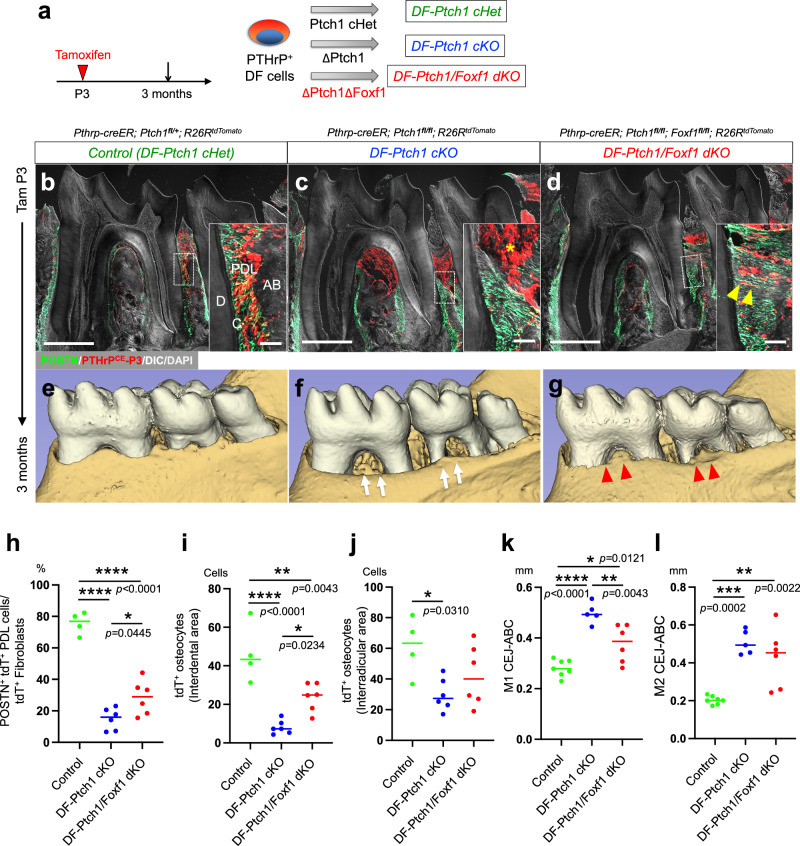
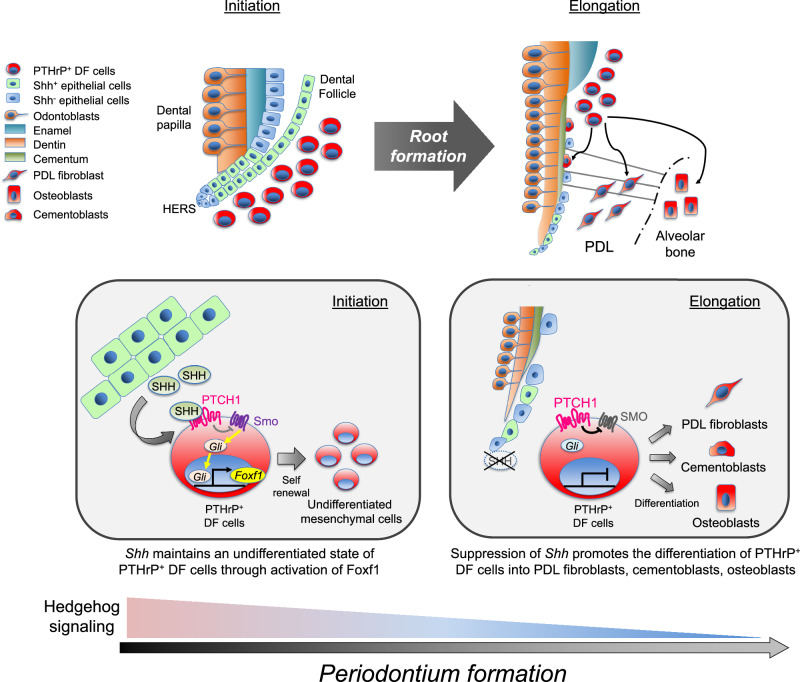
The alveolar bone is a specialized mineralized structure supporting the lifelong functionality of the tooth in mastication. The alveolar bone develops from the dental follicle (DF) during tooth root formation due to deliberate epithelial-mesenchymal interactions. However, how DF progenitor cell fates are regulated toward alveolar bone osteoblasts remains unknown. We find that Hedgehog signaling activities are transiently activated during the onset of tooth root formation and alveolar bone formation. Parathyroid hormone-related protein (PTHrP)-expressing DF cells are highly responsive to Hedgehog signaling, yet constitutive Hedgehog activation using Pthrp-creER and Ptch1-floxed alleles potently suppresses alveolar osteoblast and ligament differentiation of PTHrP+ DF cells, resulting in striking susceptibility to alveolar bone loss. Concomitant inactivation of Hedgehog-target Foxf1 factor in Hedgehog-activated PTHrP+ DF cells partially rescued alveolar bone defects. Therefore, the Hedgehog-Foxf pathway needs to be suppressed to drive alveolar bone osteoblast fates of PTHrP+ DF cells, unraveling a unique tooth-specific mechanism of bone formation requiring deliberate on-off regulations of Hedgehog signaling.


Conflict of interest statement

Competing interests: The authors declare no competing interests.

Figures

Fig. 1
Fig. 1. Hedgehog activities in physiological and pathological conditions of alveolar bones.
a Contribution of PTHrP+ DF cells to alveolar bone formation. Mandible of Osteocalcin (Oc)-GFP; Pthrp-creER; R26RtdTomato/+ mice at P25 (pulsed at P3). AB alveolar bone, Green: Oc-GFP, red: PTHrP-tdT, gray: DIC/DAPI. Scale bars: 500 μm (a), 50 μm (a’, a”). b, c Time-dependent change of Hedgehog signaling pathway component gene expression. Quantitative RNAscope in situ hybridization analyses during tooth root formation. b Mandibular first molar (M1) apical area sections at P3 and P15. Green: Shh, Hhip, or Ptch1 mRNAs. DP: dental papilla/pulp, DF dental follicle, Am ameloblasts, D dentin, PDL periodontal ligament. Scale bars: 50 μm. c Quantification of Shh, Ptch1, Hhip, and Gas1 mRNA expression levels. n = 3 mice per group. df Hedgehog activities in ligature-induced periodontitis. Intervention at 8 weeks of age, analysis at 3 days after installation in C57/BL6 mice. d Experimental scheme of maxillary ligature-induced periodontitis model. A 6-0 silk suture was placed between the first and second molars on the left side. Both ends of the suture string were knotted to prevent ligature loss. e Maxillary first and second molar (M1&M2) sagittal section, left panel: right maxilla (Control), right panel: left maxilla (Ligature). Green: Shh mRNA expression. Arrowhead: activation of Shh expression. Scale bars: 500 μm (upper), 100 μm (lower). f Quantification of Shh, Hhip, Ptch1, and Smo mRNA expression levels. n = 4 mice per group. 0*P < 0.05, ***P < 0.001, two-sided paired t-test. The exact P value is indicated in the figures. All data are represented as mean ± SD. Source data are provided as a Source Data file.
Fig. 2
Fig. 2. PTHrP+ DF cells represent a highly Hedgehog-responsive subset of Gli1+ cells.
a Shh-GFP expression. P3 mandibular first molar (M1) sections of ShhGFP/+ mice. DP dental papilla, DF dental follicle, Od odontoblast, Am ameloblasts. Magenta: Shh-GFP, gray: DIC/DAPI. Scale bars: 50 μm. b, c Gli1-GFP and PTHrP-creER expression. P5 mandibular M1 sections of Gli1GFP/+; Pthrp-creER; R26RtdTomato mice (pulsed at P3). Yellow arrowheads: Gli1-GFP+PTHrP-tdT+ DF cells. b’: magnified view of the dotted area. Blue: cytokeratin 5 (CK5), green: Gli1-GFP, red: PTHrP-tdT, gray: DIC/DAPI. Scale bars: 200 μm (b), 20 μm (b’). DP dental papilla, DF dental follicle, Od odontoblast, Am ameloblasts. c Flow cytometry analysis of CD45 DF cells isolated from Gli1GFP/+; Pthrp-creER; R26RtdTomato molars at P5 (pulsed at P3). dh Heterogeneity of Gli1-GFP+ cells. Single-cell RNA-seq analysis of Gli1-GFP+ cells isolated from Gli1GFP/+; Pthrp-creER; R26RtdTomato molars at P6 (pulsed at P3). Left main panel: UMAP plot of major classes of Gli1-GFP+ cells (Clusters 0–10, 7472 cells). Pooled from n = 3 mice. Right panels: feature plots of tdTomato (for Pthrp-creER), Hhip (for Hedgehog-responsive), Pthlh (for DF dental follicle), Sox9 (for DP dental papilla), and Wif1 (AP apical papilla). High expression: purple, low expression: yellow. e REVIGO plot of GO terms enriched in differentially expressed genes (DEGs) of Cluster 3 (P < 0.05). The P values were calculated using GOrilla’s one-sided test based on the hypergeometric distribution, with a flexible P value cutoff applied for multiple testing correction. Circles: significantly enriched GO terms (P < 10−5; FDR-q < 0.01). Circle size: log10 frequency of GO terms, color scale: log10 P value. f VeloVAE analysis,. Origins of black arrows: inferred initial states, namely Cluster 2 (blue arrowhead). g CellRank-computed initial state probability. Cluster 3: inferred root cell population. h CellChat intercellular communication analysis. A chord diagram demonstrates the intercellular interaction network via the Hedgehog signaling pathways. Sender cells (blunt end), receiver cells (arrowhead). i, j Hedgehog-responsiveness of PTHrP+ cells. Flow cytometry analysis of P6 DF cells isolated from Pthrp-creER; R26RtdTomato mice (pulsed at P3, i, n = 5 mice per each group) and PthrpmCherry/+ (j, n = 7 mice per each group) molars, treated with Vehicle (blue) or Smo antagonist LDE225 (25 μg/g b.w., red). LDE225 was injected daily from P3 to P5. *P < 0.05, two-sided paired t-test. All data are represented as mean ± SD. The exact P value is indicated in the figures. Source data are provided as a Source Data file.
Fig. 3
Fig. 3. Constitutive Hedgehog activation in PTHrP+ DF cells induces alveolar bone defects.
aj Impact of constitutive Hedgehog activation in PTHrP+ DF cells on alveolar bone formation. a Diagram of conditional Ptch1 deletion in PTHrP-creER+ DF cells. bf 3D-µCT images of mandibular molars of Ptch1fl/fl; R26RtdTomato (Control) (b), Pthrp-creER; Ptch1fl/+; R26RtdTomato (DF-Ptch1 cHet) (c), and Pthrp-creER; Ptch1fl/fl; R26RtdTomato (DF-Ptch1 cKO) (d) mice (pulsed at P3) at 3 months. Black arrowheads: alveolar bone loss in DF-Ptch1 cKO molars. e, f Composite 3D surface model overlay of the mandible. Superimposition registered on mandibles (e) and mandibular molars (f). gj Quantitative 3D-µCT analysis of the distance between cement-enamel junction and alveolar bone crest (CEJ-ABC) (g, h), root length (i), and eruption height (j). M1 mandibular first molar, M2 mandibular second molar. n = 4 mice per group. ****P < 0.0001, ***P < 0.001, one-way ANOVA followed by the Mann–Whitney U-test. All data are mean ± SD. The exact P value is indicated in the figures. Source data are provided as a Source Data file.
Fig. 4
Fig. 4. Hedgehog activation suppresses osteoblast and ligament fates of PTHrP+ DF cells.
Impact of constitutive Hedgehog activation in PTHrP+ DF cells on cell proliferation and fates. Pthrp-creER; Ptch1fl/+; R26RtdTomato (DF-Ptch1 cHet) and Pthrp-creER; Ptch1fl/fl; R26RtdTomato (DF-Ptch1 cKO) mice were pulsed at P3. ac Cell proliferation. EdU was administered twice (6 h and 3 h) before analysis at P13. Green: EdU, red: tdTomato, gray: DIC/DAPI. Scale bars: 500 μm (left panel), 50 μm (right panel). Quantification of EdU+tdT+ cells (c). n = 5 (DF-Ptch1 cHet), n = 4 (DF-Ptch1 cKO) mice. dl PDL cell differentiation. Mandibular first and second molars (M1&2) stained for POSTN at P25. High magnification images of interradicular (f, h) and interdental (g, i) cryptal bone. Asterisk: tdTomato+ cells accumulated in the coronal part of the interdental area. Green: POSTN, red: tdTomato, gray: DIC/DAPI. jl Quantification of POSTN+ tdT+ PDL cells (j), tdT+ osteocytes in interdental (k) and interradicular (l) alveolar bone. n = 4 mice per group. mo Cementoblast differentiation. Distal root surface of Oc-GFP; Pthrp-creER; Ptch1fl/+; R26RtdTomato (DF-Ptch1 cHet) (m), Pthrp-creER; Ptch1fl/fl; R26RtdTomato (DF-Ptch1 cKO) (n) molars at P25. Arrowheads in (m): Oc-GFP+ tdT+ cementoblasts. Green: Oc-GFP, red: tdTomato, gray: DIC/DAPI. o Quantification of Oc-GFP+ tdT+ cementoblasts. n = 7 (DF-Ptch1 cHet), n = 4 (DF-Ptch1 cKO) mice. Scale bars: 500 μm (d, e), 50 μm (fi, m, and n). D dentin, C cementum, PDL periodontal ligament, AB alveolar bone. *P < 0.05, one-way ANOVA followed by the Mann–Whitney U-test. All data are mean ± SD. The exact P value is indicated in the figures. Source data are provided as a Source Data file.
Fig. 5
Fig. 5. Smo antagonist rescues defective differentiation of Hedgehog-activated PTHrP+ DF cells.
Rescue of Hedgehog-activated alveolar bone and PDL phenotypes by Smo antagonist LDE225. ak Rescue during tooth root formation. Pthrp-creER; Ptch1fl/+; R26RtdTomato (DF-Ptch1 cHet) and Pthrp-creER; Ptch1fl/fl; R26RtdTomato (DF-Ptch1 cKO) mice were pulsed at P3, LDE225 or vehicle (PBS) were injected to DF-Ptch1 cHet or DF-Ptch1 cKO, daily from P8 to P20, and analyzed at P25. ad M1 mandibular first molar sections stained for POSTN. Asterisk in (c’): tdTomato+ cells accumulated in the coronal part of the interdental area. Arrows and arrowheads in (d’): Ptch1-deficient tdT+ osteocytes and POSTN+ PDL cells induced by LDE225. eh 3D-µCT images of the mandible, lingual view. Black arrows in (g): alveolar bone defects, red arrowheads in h: recovery of alveolar bone by LDE225. ik Quantification of POSTN+ tdT+ PDL cells (i, n = 4 (DF-Ptch1 cHet+PBS or LDE225, DF-Ptch1 cKO+LDE225), n = 4 (DF-Ptch1 cKO+PBS) mice), interdental tdT+ osteocytes (j, n = 4 (DF-Ptch1 cHet+PBS or LDE225, DF-Ptch1 cKO+LDE225), n = 4 (DF-Ptch1 cKO+PBS) mice) and M1 CEJ-ABC distance (k, n = 8 mice per each group). lo Rescue after tooth root formation. LDE225 or vehicle (PBS) was injected into DF-Ptch1 cHet or DF-Ptch1 cKO mice (pulsed at P3) daily from 5 weeks to 7 weeks (for 14 days) and analyzed at 8 weeks. Asterisk in (n’): tdT+ cells accumulated in the coronal part of the interdental area. Arrow and arrowheads in (o’): Ptch1-deficient tdT+ osteocytes and POSTN+ PDL cells induced by LDE225. ps 3D-µCT images of the mandible, lingual view. Black arrows in (r): alveolar bone defects, red arrowheads in (s): recovery of alveolar bone by LDE225. tv Quantification of POSTN+ tdT+ PDL cells (t, n = 3 (DF-Ptch1 cHet+PBS), n = 4 (DF-Ptch1 cHet+LDE225, DF-Ptch1 cKO+PBS or LDE225) mice), interdental tdT+ osteocytes (u, n = 3 (DF-Ptch1 cHet+PBS), n = 4 (DF-Ptch1 cHet+LDE225, DF-Ptch1 cKO+PBS or LDE225) mice) and M1 CEJ-ABC distance (v, n = 3 (DF-Ptch1 cHet+PBS), n = 6 (DF-Ptch1 cHet+LDE225), n = 4 (DF-Ptch1 cKO+PBS), n = 5 (DF-Ptch1 cKO+LDE225) mice). Scale bars: 500 μm (ad, lo), 50 μm (a’d’, l’o’). Green: POSTN, red: tdTomato, gray: DIC/DAPI. D dentin, C cementum, PDL periodontal ligament, AB alveolar bone. M1: mandibular first molar, M2: mandibular second molar. *P < 0.05, **P < 0.01, ***P < 0.001, ****P < 0.0001. One-way ANOVA followed by the Mann–Whitney U-test. All data are mean ± SD. The exact P value is indicated in the figures. Source data are provided as a Source Data file.
Fig. 6
Fig. 6. Hedgehog-activated alveolar bones are susceptible to acute bone loss.
Impact of periodontal drill-hole injury on periodontal bone loss in Hedgehog-activated alveolar bones. a Experimental scheme of mandibular periodontal drill-hole surgery model. A 1.0 mm diameter drill-hole defect was created on the buccal surface of the right mandible of 10–13 weeks-old Pthrp-creER; Ptch1fl/+; R26RtdTomato (DF-Ptch1 cHet), and Pthrp-creER; Ptch1fl/fl; R26RtdTomato (DF-Ptch1 cKO) mice (pulsed at P3). The contralateral left mandible was used as an internal control. Analyses were performed at 3 weeks after surgery. be, j Contribution of PTHrP DF-derivative tdT+ cells to periodontal bone defect. Arrowheads: Oc-GFP+tdT+ cementoblasts, Arrows: Oc-GFP+tdT+ osteoblasts. White dot line: contour of the surgical defect. j Quantification of tdT+ cells in the surgical site. Green: Oc-GFP, red: tdTomato, gray: DIC/DAPI. B: buccal, L: lingual. Scale bars: 200 μm (b, d), 50 μm (b’, d’). c, e 3D-µCT images of the mandible, buccal view. White circles: surgical defect region. fi, k Injury-induced acute periodontal bone loss. 3D-µCT images of the mandible after surgery, lingual view. j Quantification of tdT+ cells within the defect. n = 4 mice per group. k 3D-µCT quantification of M1 CEJ-ABC distance. n = 4 mice per group. M1: Mandibular first molar, M2: Mandibular second molar. *P < 0.05, ***P < 0.001, one-way ANOVA followed by the Mann–Whitney U-test (j), two-sided paired t-test (k). All data are mean ± SD. The exact P value is indicated in the figures. Source data are provided as a Source Data file.
Fig. 7
Fig. 7. Identification of Foxf factors as Hedgehog target genes in PTHrP+ DF cells.
Identification of Hedgehog-target genes in PTHrP+ DF cells by comparative bulk RNA-seq. ad RNA-seq analysis of Ptch1-deficient PTHrP+ DF progenitor cells. a, b FACS sorting of PTHrP-creER+ DF cells at P8 (pulsed at P3). Blue box: PTHrPCE-Ptch1Het-P3 cells isolated from DF-Ptch1 cHet molars, red box: PTHrPCE-∆Ptch1-P3 cells isolated from DF-Ptch1 cKO molars. c Heatmap of representative 16 genes. Left lanes: Ptch1Het cells, right lanes: ∆Ptch1 cells. Red: higher expression, blue: lower expression, n = 2 biological replicates per group. d GSEA analysis. Representative 6 enriched pathways in ∆Ptch1 cells. NES: normalized enrichment score. e Quantitative RNAscope in situ hybridization analyses of Foxf1 and Foxf2. Left panels: sections of P8 DF-Ptch1 cHet or DF-Ptch1 cKO mandibular first molar (M1) (pulsed at P3). Arrowheads: upregulated Foxf1 and Foxf2 mRNAs in DF. Green: Foxf1 or Foxf2 mRNAs. Red: tdTomato, gray: DIC/DAPI. Scale bars: 50 μm. Right panels: Quantification of Foxf1 and Foxf2 mRNA levels. n = 4 mice per group. *P < 0.05, one-way ANOVA followed by the Mann–Whitney U-test. All data are mean ± SD. f Summary diagram. g SCENIC (Single-Cell rEguratory Network Inference and Clustering) analysis of the scRNA-seq dataset (shown in Fig. 2) showing the regulatory network with transcription factors (TFs, shown as rectangles) and their target genes intersected with DEGs identified using bulk RNA-seq analysis. Green circles: genes upregulated in PTHrPCE-∆Ptch1-P3 cells, red circles: genes downregulated in PTHrPCE-∆Ptch1-P3 cells. The exact P value is indicated in the figures. Source data are provided as a Source Data file.
Fig. 8
Fig. 8. Foxf1 is a key downstream mediator of Hedgehog activation in PTHrP+ DF cells.
Rescue of Hedgehog-activated alveolar bone phenotypes by concomitant Foxf1 inactivation. a Scheme. Pthrp-creER; Ptch1fl/+; R26RtdTomato (DF-Ptch1 cHet, Control), Pthrp-creER; Ptch1fl/fl; R26RtdTomato (DF-Ptch1 cKO) and Pthrp-creER; Ptch1fl/fl; Foxf1fl/fl; R26RtdTomato mice (DF-Ptch1/Foxf1 dKO) (pulsed at P3) were analyzed at 3 months. bd Recovery of ligament and osteocyte fates of PTHrP+ DF cells. Mandibular first molar (M1) sections stained for POSTN. Green: POSTN, red: tdTomato, gray: DIC/DAPI. Asterisk in c: tdT+ cells accumulated in the coronal part of the interdental area. Arrowheads in d: POSTN+tdT+ PDL cells D dentin, PDL periodontal ligament, AB alveolar bone. Scale bar: 500 μm (bd), 50 μm (b’d’). eg Recovery of alveolar bone. 3D-µCT images of the mandible, lingual view. Arrows: periodontal bone defect, arrowheads: recovery of alveolar bone. hl Quantification of POSTN+ tdT+ PDL cells (h), interdental and interradicular tdT+ osteocytes (i, j), and M1 and M2 CEJ-ABC distance (k, l). n = 7 (Control), n = 5 (DF-Ptch1 cKO), n = 6 (DF-Ptch1/Foxf1 dKO) mice. M1: mandibular first molar, M2: mandibular second molar. *P < 0.05, **P < 0.01, ***P < 0.001, ****P < 0.0001. one-way ANOVA followed by the Mann–Whitney U-test. All data are mean ± SD. The exact P value is indicated in the figures. Source data are provided as a Source Data file.
Fig. 9
Fig. 9. A Hedgehog–Foxf axis coordinates DF-derived alveolar bone formation.
HERS abundantly expresses SHH at the initiation of tooth root formation. It maintains an undifferentiated state of PTHrP+ DF cells by activating Hedgehog signaling and its downstream target gene, Foxf1. As HERS-derived SHH rapidly decreases during tooth root formation, Hedgehog signaling activities in DF-derived cells also decrease during tooth root formation. PTHrP+ DF cells on the apical root start to differentiate into alveolar cryptal bone osteoblasts, PDL fibroblasts, and cementoblasts during elongation due to decreased Hedgehog signaling activities. Our findings suggest that Hedgehog signaling is an essential coordinator of PTHrP+ DF cell fates and proper formation of the alveolar bone and the functional periodontal tissue.

Similar articles

References

    1. Nanci, A. Ten Cate’s Oral Histology-e-Book: Development, Structure, and Function (Elsevier Health Sciences, 2017).
    1. Huja, S. S., Fernandez, S. A., Hill, K. J. & Li, Y. Remodeling dynamics in the alveolar process in skeletally mature dogs. Anat. Rec. A Discov. Mol. Cell Evol. Biol.288, 1243–1249 (2006). - PMC - PubMed
    1. Marx, R. E., Cillo, J. E. & Ulloa, J. J. Oral bisphosphonate-induced osteonecrosis: risk factors, prediction of risk using serum CTX testing, prevention, and treatment. J. Oral. Maxillofac. Surg.65, 2397–2410 (2007). - PubMed
    1. Pihlstrom, B. L., Michalowicz, B. S. & Johnson, N. W. Periodontal diseases. Lancet366, 1809–1820 (2005). - PubMed
    1. Eke, P. I., Borgnakke, W. S. & Genco, R. J. Recent epidemiologic trends in periodontitis in the USA. Periodontol 200082, 257–267 (2020). - PubMed

MeSH terms

Substances

LinkOut - more resources