. 2025 Jul 1;16(1):5959.
doi: 10.1038/s41467-025-61022-7.

O-GlcNAcylation of FOXK1 co-opts BAP1 to orchestrate the E2F pathway and promotes oncogenesis

Affiliations

O-GlcNAcylation of FOXK1 co-opts BAP1 to orchestrate the E2F pathway and promotes oncogenesis

Oumaima Ahmed et al. Nat Commun. .

Abstract

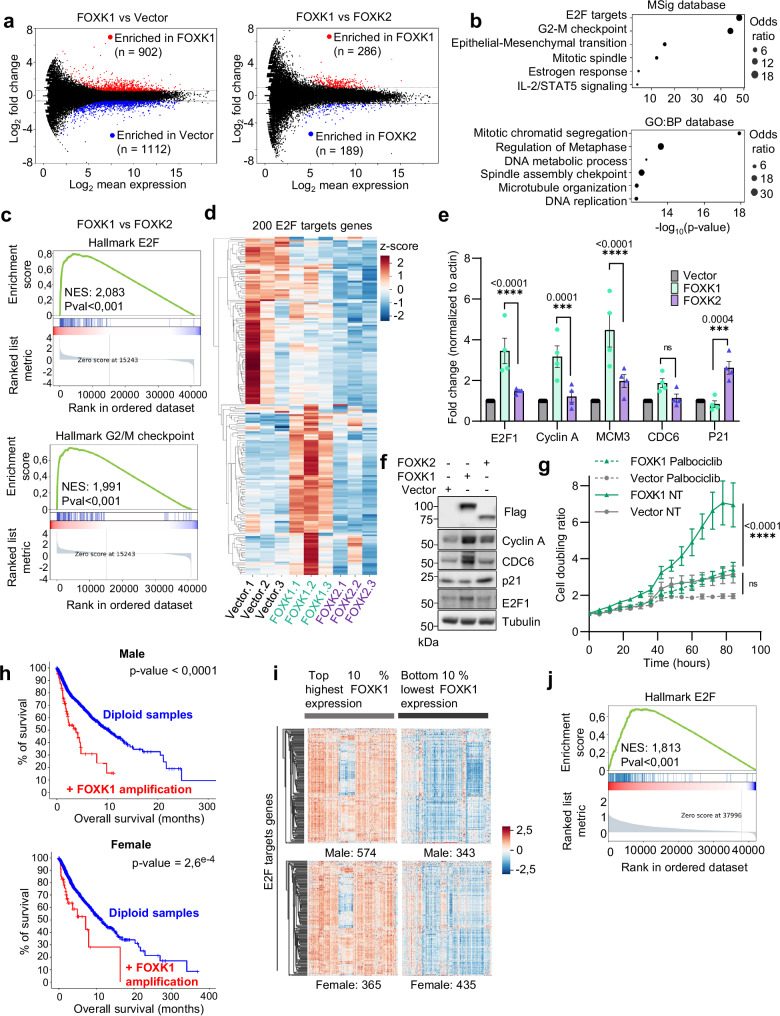
The E2F transcription factors constitute a core transcriptional network that governs cell division and oncogenesis in multi-cellular organisms, although their molecular mechanisms remain incompletely understood. Here, we show that elevated expression of the transcription factor FOXK1 promotes transcription of E2F target genes and cellular transformation. High expression of FOXK1 in patient tumors is also strongly correlated with E2F gene expression. Mechanistically, we demonstrate that FOXK1 is O-GlcNAcylated, and loss of this modification impairs FOXK1 ability to promote cell proliferation and tumor growth. We also show that expression of FOXK1 O-GlcNAcylation-defective mutants results in reduced recruitment of the H2AK119 deubiquitinase and tumor suppressor BAP1 to E2F target genes. This event is associated with a transcriptional repressive chromatin environment and reduced cell proliferation. Our results define an essential role of FOXK1 O-GlcNAcylation in co-opting the tumor suppressor BAP1 to promote cancer cell progression through orchestration of the E2F pathway.


Conflict of interest statement

Competing interests: The authors declare no competing interests.

Figures

Fig. 1
Fig. 1. FOXK1 promotes cell proliferation and delays cellular senescence.
a, b Phase contrast imaging and cell size of IMR90 cells stably expressing empty vector, FOXK1 or FOXK2. The results are representative of four experiments. Box plots display the distribution of individual cell surface area (μm²) for each condition. The number of cells quantified for each condition is: Vector = 343, FOXK1 = 1252, FOXK2 = 417. The center line represents the median. The box extends from the 25th to the 75th percentile (interquartile range, IQR). The whiskers extend to the most extreme non-outlier values within 1.5×IQR. Outliers are not shown. Representative of three independent experiments. c Cell counts of IMR90 cells expressing empty vector, FOXK1 or FOXK2. Data points are represented as a cumulative count (n = 3 independent experiments). d FACS analysis of DNA content following synchronization and release of IMR90 cells expressing FOXK1 or FOXK2. The arrow indicates the emerging S phase peak. The percentage indicates the number of cells moving towards S/G2. The results are representative of three independent experiments. At the end of the experiments (c), cells were used for further characterization shown in (eh). e Analysis of EdU incorporation by immunofluorescence and cell counting of EdU positive IMR90 control cells or cells expressing FOXK1 or FOXK2 (n = 3 independent experiments). f Senescence-associated β-galactosidase staining of IMR90 control cells or expressing FOXK1 or FOXK2. Cells stained in blue were counted and used to calculate the percentage of senescent cells (n = 3 independent experiments). g IMR90 cells expressing FOXK1 or FOXK2 were fixed for immunofluorescence staining of PML bodies (n = 3 independent experiments). Control and FOXK1 expressing cells were stained with anti-FOXK1 antibody, FOXK2 expressing cells were stained with anti-FOXK2 antibody. Cells displaying PML bodies in each condition were counted and plotted in the right panel. h Quantification of the number of PML bodies in cells with high or low expression of FOXK1 or FOXK2 (n = 75 total nuclei counted for PML bodies from three independent experiments). Data are represented as a scatter plot. i Cell colony counting of control IMR90 cells or overexpressing FOXK1 or FOXK2 along with different combinations of oncogenes (n = 4 independent experiments, except for FOXK2: n = 3 independent experiments). j Representative images of normal versus transformed cells. k Tumor penetrance of IMR90 cells expressing RASG12V and E1A and either empty vector, FOXK1 or FOXK2. The same number of cells were injected into the flank of nude mice. The experiment was terminated when the tumors reached the limit point (n = 4 injected mice). l Tumor latency representing the time between cell engraftment and appearance of tumors that reached at least 0.1 cm3 from IMR90 cells expressing RASG12V and E1A, and either empty vector, FOXK1 or FOXK2 (n = 4 injected mice, only penetrant tumors are represented by dots. By the end of the experiment, only three tumors out of four injections grew in empty vector condition). m Tumor volume of IMR90 cells expressing RASG12V and E1A and either empty vector, FOXK1 or FOXK2 at the end of the experiment (n = 4 injected mice). n Representative images of the tumors before and after extraction for final size measurement. Statistics: Data are represented as mean ± SEM (c, e, f, g, i, l, m). One-way or Two-way ANOVA with Tukey’s multiple comparisons (c, f, g, h, i) or Dunnett’s (e, l, m). All tests were two-sided, and adjustments were made for multiple comparisons. *P < 0.05; **P < 0.01; ***P < 0.001; ****P < 0.0001, ns non-significant. Source data are provided as a Source Data file.
Fig. 2
Fig. 2. FOXK1 promotes the expression of E2F target genes.
a MA Plot representing the mean expression against the fold change of genes when comparing FOXK1 with empty vector or FOXK1 with FOXK2 conditions. For each graph, genes in red are up-regulated in FOXK1 condition. b Gene ontology (GO) analysis using Enrichr (MSigDB and GO:BP databases) was performed on genes differentially regulated between FOXK1 and FOXK2 conditions. c Gene set enrichment analysis (GSEA) performed on genes deregulated in FOXK1 compared to FOXK2 condition. d Heatmap representing the transcript count in IMR90 cells from control, FOXK1 and FOXK2 conditions on all the E2F target genes defined by the hallmark of molecular signatures database (200 genes). Among the 200 E2F genes, FOXK1 upregulates 60 of them. Transcript counts were normalized using z-score and presented as heatmap. e Validation of RNA-seq data by quantifying mRNA of genes differentially regulated by qRT-PCR (n = 4 independent experiments). f Western blotting showing increased expression of some E2F targets following FOXK1 or FOXK2 overexpression (representative of three independent experiments). g IMR90 cells expressing FOXK1 or control cells were treated with the CDK4/6 inhibitor Palbociclib (5 µM) and monitored for growth using Incucyte imaging (n = 3 independent experiments). h Kaplan–Meier survival curve of TCGA cancer patients with or without FOXK1 amplification (based on GISTIC score) with separate analysis for male (number of patients without amplification = 3043, and with amplification = 49) and female patients (number of patients without amplification = 2500, and with amplification = 67) (data sourced from cBioportal). i Heat map showing z-scores of transcript counts for 200 E2F target genes, categorized into samples with the highest (top 10%) and lowest (bottom 10%) FOXK1 expression levels from TCGA cancer patients with separate analysis for male and female patients. j GSEA analysis conducted on differentially expressed genes when comparing TCGA samples with the highest and lowest FOXK1 expression levels. Statistics: Data are represented as mean ± SEM (e, g). Two-way ANOVA with two-sided tests followed by Dunnett’s multiple comparisons test for adjustment (e, g). Normalized enrichment score (NES) and p value were computed using GSEA software (c, j). A two-sided log-rank test was performed for survival analysis (h). *P < 0.05; **P < 0.01; ***P < 0.001; ****P < 0.001, ns non-significant. Source data are provided as a Source Data file.
Fig. 3
Fig. 3. FOXK1 and FOXK2 occupy the same regulatory regions on chromatin.
a Heatmap and profile representing the occupancy of endogenous FOXK1 and FOXK2 on gene promoter regions. Promoter regions were obtained from HOMER (31713), and peaks were centered within 6Kb (±3 kb) distance and oriented based on RefSeq direction (n = 1). b Venn diagram representing overlapping peaks in promoters and distal regions between endogenous FOXK1 and FOXK2 in IMR90 cells. c Gene ontology (GO) analysis performed on promoters containing FOXK1. d Bar-plot representing the repartition of endogenous (endo) and exogenous (3 Flag tagged) FOXK1 and FOXK2 ChIP-seq peaks on the genome of K562 (n = 1), IMR90 (n = 1 for endogenous and n = 1 for exogenous), or U2OS (n = 1) cells. e Venn diagram showing intersecting FOXK1 (Flag ChIP-seq) peaks found in promoters in IMR90, K562 and U2OS cells. f GO analysis performed on common 7312 promoters containing FOXK1 in IMR90, K562, and U2OS cells. g Diagram explaining Re-ChIP performed in U2OS cells. h Re-ChIP-qPCR analysis of sequential FOXK1 and FOXK2 chromatin immunoprecipitation (FOXK1 followed by IgG or FOXK2, and FOXK2 followed by IgG or FOXK1) on the promoters of E2F1, MCM6, and Cyclin A (n = 2 independent experiments). i Heatmap and profile of FOXK1 and FOXK2 recruitment to promoters (from HOMER) in blocked G0 cells and 18 h following release (n = 1). j Comparison of FOXK1 (y axis) and FOXK2 (x axis) spike-in normalized read count at common peaks from Cut&Run experiment performed in IMR90 cells blocked in G0 and 18 hours following the release of cells in the cell cycle. The dashed line splits the scatter plot into two regions. Points above the line indicate higher values for FOXK1 peaks, and points below higher values for FOXK2. The box plots in the right panel show spike-in normalized read count signal quantification at common FOXK1 and FOXK2 peaks in both cell cycle phases (two technical replicates were merged). Box plots display the normalized read counts for each condition. The center line represents the median. The box extends from the 25th to the 75th percentile (interquartile range, IQR). The whiskers extend to the most extreme non-outlier values within 1.5×IQR. Outliers are not shown. Statistics: Data are represented as mean ± SEM (h). Two-way ANOVA with Tukey’s multiple comparisons (j). GO enrichment analysis was performed using Enrichr. Statistical significance was assessed using Fisher’s exact test, and odds ratios (OR) were computed (c, f). Source data are provided as a Source Data file.
Fig. 4
Fig. 4. FOXK1 and FOXK2 are direct regulators of E2F target genes.
a Visualization of FOXK1 and FOXK2 occupancy on promoters of E2Fs and some of their target genes. Peaks p value, called using MACS2, are shown under the gene body (Refseq) track. Peaks signal intensity is shown on the y-axis. b Occupancy of FOXK1 at promoters of 273 genes identified being differentially expressed in RNA-seq in IMR90 cells overexpressing (OE) FOXK1 compared to FOXK2. The 1193 distal regions were identified by considering peaks upstream or downstream promoters at a distance greater than 1 kb away from TSS. These regions are enriched for H3K27Ac and BRD4 and were qualified as enhancers. c Motif analysis was performed on promoters or distal regions indicated in (b). d To analyze promoter and enhancers contacts involving FOXK1-enriched regions, we used publicly available chromatin capture (Hi-C) data from IMR90 cells. Differentially expressed genes of FOXK1 compared to FOXK2 from the E2F pathway made more contacts between promoters and distal regions compared to non-differentially enriched genes. e Visualization of topological associated domains (TADs) containing high chromatin contacts in addition to numerous FOXK1 and FOXK2 peaks visualized by ChIP-seq track at E2F1 loci. For comparison, COL4A6 is a non-differentially expressed gene containing FOXK1 or FOXK2 in gene body but present low number of chromatin contacts in the TAD. Statistical significance was assessed using a Poisson distribution model (a). Motif enrichment analysis was performed using HOMER. Statistical significance was assessed using the hypergeometric test (c). Source data are provided as a Source Data file.
Fig. 5
Fig. 5. FOXK1, but not FOXK2, is modified by O-GlcNAcylation.
a HEK293T cells were transfected with constructs expressing Myc-FOXK1 or Myc-FOXK2 in the presence of OGT WT or OGT catalytically dead (CD) mutant (D925A). Myc immunoprecipitation was performed, and levels of O-GlcNAcylation were detected using an anti-O-GlcNAc specific antibody (n = 2 independent experiments). b Immunoprecipitation of endogenous FOXK1 was performed on U2OS cell extracts following transfection with siRNA targeting OGT (siOGT) or non-target siRNA as a control (siNT) (n = 3 independent experiments). c Immunoprecipitation of endogenous FOXK1 and analysis of O-GlcNAcylation in IMR90 cells treated with either; OGA inhibitors (PUGNAc, Thiamet G (ThG)) or OGT inhibitors (OSMI-4) (n = 3 independent experiments). d Immunoprecipitation and analysis of endogenous FOXK1 O-GlcNAcylation in IMR90 cells treated with glucose free media or gradually supplemented with increasing concentrations of glucose (n = 3 independent experiments). e Immunoprecipitation and analysis of endogenous FOXK1 O-GlcNAcylation in IMR90 cells synchronized by contact inhibition and released at low density in fresh medium (n = 3 independent experiments). f Immuno-depletion and analysis of endogenous FOXK1 O-GlcNAcylation in IMR90 cells. Cellular extracts from IMR90 were used for FOXK1 immunoprecipitation. Eluted proteins were then incubated with WGA bound beads, and FOXK1 O-GlcNAcylation levels were analyzed by western-blotting (n = 3 independent experiments). g In vitro O-GlcNAcylation was performed on recombinant GST-FOXK1 or GST-FOXK2 with recombinant His-OGT-Flag. The reaction was stopped at different time points to detect protein O-GlcNAcylation levels (n = 3 independent experiments). h Left: recombinant FOXK1 fragments are schematically represented and numbered. Right: in vitro O-GlcNAcylation was performed on recombinant FOXK1 fragments to map the region containing residues modified by O-GlcNAc (n = 3 independent experiments). i Top; schematic representing the identification of O-GlcNAc sites on FOXK1 as determined by mass spectrometry (MS) analysis. Mutant FOXK17A contains seven threonine mutated to alanine, whereas mutant FOXK111A contains all the eleven sites mutated to alanine. Bottom; FOXK1 structure predicted by Alphafold. The region highlighted is expected to be unstructured. Right; Visual representation of this region with the position of residues targeted by O-GlcNAcylation are shown on the predicted protein structure. j Immunoprecipitation of Flag-tagged versions of FOXK1, FOXK17A, or FOXK111A from IMR90 cell extracts and detection of O-GlcNAcylation levels (n = 3 independent experiments). For (ah, j), the western blots are representative of one of the three independent experiments. Source data are provided as a Source Data file.
Fig. 6
Fig. 6. O-GlcNAcylation regulates FOXK1 oncogenic properties.
a Phase contrast and immunoblotting of IMR90 cells overexpressing FOXK1, FOXK17A or FOXK111A. (representative of at least n = 3 independent experiments). b IMR90 cells overexpressing FOXK1, FOXK17A or FOXK111A were counted over 15 days. Data are represented as a cumulative cell doubling plot (n = 5 independent experiments at day 1, day 5, day 10, and n = 3 independent experiments extended to day 15). c IMR90 cells stably expressing FOXK1, FOXK17A, FOXK111A, or empty vector, were blocked in G0 by contact inhibition and released by plating at low density in fresh medium to monitor cell cycle progression by FACS analysis. Results are representative of three independent experiments. d E2F1, Cyclin A, Cyclin E, MCM3 mRNA quantification by RT-qPCR in IMR90 cells overexpressing empty vector, FOXK1, FOXK17A or FOXK111A (n = 4 independent experiments for empty vector and FOXK1, n = 3 independent experiments for FOXK17A and FOXK111A). e Tumor penetrance of xenografts performed with IMR90 cells expressing RASG12V with E1A in combination with either empty vector, FOXK1, FOXK17A or FOXK111A (n = 4 injected mice, except for FOXK1 n = 5). f Tumor latency representing the time between cell engraftment and appearance of tumors that reached at least 0.1 cm3 (n = 4 injected mice, except for FOXK1 n = 5). Only penetrant tumors are represented by dots. g Tumor volume was calculated at the end of the experiment. All tumors were harvested at the same time when the fastest growing tumors reached 1.7 cm3 (n = 4 injected mice, except for FOXK1 n = 5). h Representative images of tumors before and after isolation. i Immunoprecipitation of endogenous FOXK1 from normal or transformed IMR90 (combination of RASG12V with E1A and HDM2) to evaluate FOXK1 O-GlcNAcylation levels (Representative of three independent experiments). Statistics: Data are represented as mean ± SEM (b, d, f, g). Two-way ANOVA (b, d) or one-way ANOVA (f, g) with two-sided tests followed by Dunnett’s multiple comparisons test for adjustment. *P < 0.05; **P <  0.01; ***P < 0.001; ****P <  0.001. Source data are provided as a Source Data file.
Fig. 7
Fig. 7. FOXK1 O-GlcNAcylation regulates its transcriptional function on chromatin.
a Chromatin occupancy of Flag-tagged FOXK1, FOXK17A and FOXK111A on all human promoters in IMR90 cells. b Bar-plot representing the repartition of endogenous FOXK1 and exogenous (3 Flag-tagged) FOXK1, FOXK17A and FOXK111A on the genome of IMR90 cells assessed by ChIP-seq. c, d Venn diagram depicting the overlap in chromatin occupancy between FOXK1, FOXK17A, and FOXK111A at promoters and at distal regions in IMR90 cells. e Top: Pulldown assay using HeLa nuclear extracts incubated with recombinant GST-FOXK1, which was either pre-modified by in vitro O-GlcNAcylation or incubated with OGT without UDP-GlcNAc (Representative of three independent experiments). Bottom: Quantification of BAP1 band signal intensity in pulldown conditions with or without FOXK1 O-GlcNAcylation in vitro (n = 4 independent experiments). f Differential recruitment of BAP1 in IMR90 cells overexpressing FOXK1, FOXK17A or FOXK111A. Regions were identified by comparing the list of BAP1 peaks from the FOXK1 expressing condition to those from the FOXK111A condition. Technical replicates were merged for visualization. Boxplot representing BAP1 spike-in normalized read counts. Endogenous FOXK1 was depleted by siRNA in conditions expressing FOXK1 and O-GlcNAc mutants. Two technical replicates were merged. g GO analysis performed on promoters (249) differentially enriched for BAP1 between FOXK1 and FOXK111A. h Boxplot representing H3K4me1 and H2AK119ub spike-in normalized reads in IMR90 cells expressing FOXK1, FOXK17A or FOXK111A on regions with differential BAP1 recruitment. Two technical replicates were merged. Statistics: Data are represented as mean ± SEM (e). One-way ANOVA with two-sided tests followed by Tukey’s multiple comparisons test for adjustment (f, h). Two-tailed Mann–Whitney U test was used to compare the two groups P = 0.0286 (e). GO enrichment analysis was performed using Enrichr. Statistical significance was assessed using Fisher’s exact test, and odds ratios (OR) were computed (g). Box plots display the normalized read counts for each condition. The center line represents the median. The box extends from the 25th to the 75th percentile (interquartile range, IQR). The whiskers extend to the most extreme non-outlier values within 1.5 × IQR. Outliers are not shown (f, h). *P  <  0.05. Source data are provided as a Source Data file.
Fig. 8
Fig. 8. FOXK1-mediated cell proliferation depends on BAP1 expression.
a FOXK1, FOXK2, and BAP1 dependency scores in cancer cells extracted from Depmap. Cell lines with FOXK1 dependency scores ≤ −0.5 (CRISPR/Cas9 screens) were selected, and FOXK2 and BAP1 dependency scores were plotted. b Deletion of the forkhead-associated (FHA) domain or mutation of histidine 355 in the forkhead domain (impairing DNA binding) reduces FOXK1-induced cell proliferation in IMR90 cells. FOXK1 has been transduced in IMR90 at similar virus titers or half virus titers to obtain comparable protein expression levels with FOXK1 lacking the FHA domain. Left panel: pictures of cell culture dishes following crystal violet staining. Middle panel: quantification of crystal violet staining (n = 3 independent experiments). Right panel: western blot showing expression of FOXK1 and corresponding mutants. Representative of three independent experiments. c BAP1 depletion impairs FOXK1-induced cell proliferation. U2OS were transfected with shRNA targeting BAP1, and cells with stable knockdown were selected with puromycin. These cells were then transduced with lentivirus expressing FOXK1 or FOXK2. Cell growth was assessed by crystal violet staining (left panel). The crystal violet was extracted and quantified (right panel) (n = 3 independent experiments). d Western blotting detection of BAP1, Flag-FOXK1, and Flag-FOXK2. Flag-FOXK1 and Flag-FOXK2 expression was quantified and shown in the right panel. Representative of three independent experiments. eg FOXK1 is enriched at promoters and distal regions of E2F target genes dependent on BAP1 expression in U2OS cells. e FOXK1 is significantly enriched on promoters of genes that are regulated by BAP1. f Heatmap showing E2F target genes downregulated in U2OS cells after BAP1 knockdown. g FOXK1 is recruited at promoters and distal regions of E2F target genes that are regulated by BAP1. h Quantification of crystal violet staining from pleural mesothelioma and lung cancer cell lines expressing either control vector, FOXK1, or FOXK111A constructs. The cell lines on the left (H2373, MESO22, H290, MESO28, MESO1, H2052) express wild-type BAP1, while the cell lines on the right (H2452, H226, MESO25, H28, MESO14, MESO61) have truncated or deleted BAP1 (n = 3 independent experiments). Statistics: Data are represented as mean ± SEM (bd, h) One-way ANOVA (b) or two-way ANOVA (c, h) with two-sided tests followed by Dunnett’s or Tukey’s multiple comparisons test for adjustment. Two-sided unpaired t-test (d). *P < 0.05; **P < 0.01; ***P < 0.001; ****P < 0.001, ns non-significant. Source data are provided as a Source Data file.

Update of

Similar articles

References

    1. Polager, S. & Ginsberg, D. E2F - at the crossroads of life and death. Trends Cell Biol.18, 528–535 (2008). - PubMed
    1. Fischer, M., Schade, A. E., Branigan, T. B., Muller, G. A. & DeCaprio, J. A. Coordinating gene expression during the cell cycle. Trends Biochem. Sci.47, 1009–1022 (2022). - PubMed
    1. Matthews, H. K., Bertoli, C. & de Bruin, R. A. M. Cell cycle control in cancer. Nat. Rev. Mol. Cell Biol.23, 74–88 (2022). - PubMed
    1. Kent, L. N. & Leone, G. The broken cycle: E2F dysfunction in cancer. Nat. Rev. Cancer19, 326–338 (2019). - PubMed
    1. Tsai, K. L. et al. Crystal structure of the human FOXK1a-DNA complex and its implications on the diverse binding specificity of winged helix/forkhead proteins. J. Biol. Chem.281, 17400–17409 (2006). - PubMed

MeSH terms

LinkOut - more resources