. 2025 Jul 1;16(1):5992.
doi: 10.1038/s41467-025-60989-7.

ToxACoL: an endpoint-aware and task-focused compound representation learning paradigm for acute toxicity assessment

Affiliations

ToxACoL: an endpoint-aware and task-focused compound representation learning paradigm for acute toxicity assessment

Jiang Lu et al. Nat Commun. .

Abstract

Multi-species acute toxicity assessment forms the basis for chemical classification, labelling and risk management. Existing deep learning methods struggle with diverse experimental conditions, imbalanced data, and scarce target data, hindering their ability to reveal endpoint associations and accurately predict data-scarce endpoints. Here we propose a machine learning paradigm, Adjoint Correlation Learning, for multi-condition acute toxicity assessment (ToxACoL) to address these challenges. ToxACoL models endpoint associations via graph topology and achieves knowledge transfer via graph convolution. The adjoint correlation mechanism encodes compounds and endpoints synchronously, yielding endpoint-aware and task-focused representations. Comprehensive analyses demonstrate that ToxACoL yields 43%-87% improvements for data-scarce human endpoints, while reducing training data by 70% to 80%. Visualization of the learned top-level representation interprets structural alert mechanisms. Filled-in toxicity values highlight potential for extrapolating animal results to humans. Finally, we deploy ToxACoL as a free web platform for rapid prediction of multi-condition acute toxicities.


Conflict of interest statement

Competing interests: The authors declare no competing interests.

Figures

Fig. 1
Fig. 1. High-level overview of ToxACoL.
a ToxACoL workfolow. The training toxicity measurements were leveraged to explore pairwise dependencies between endpoints and the acute toxicity endpoint graph was constructed based on these dependencies. Each adjoint correlation layer comprising a residual network layer and a graph convolution layer was designed to process compound embeddings and endpoint embeddings parallelly, and the two branches internally interact via a correlation operation. After a cascade of multiple adjoint correlation layers, the embedding of each endpoint outputted by the topmost graph convolution layer will serve as the toxicity regressor for the corresponding endpoint, and then perform the toxicity regression with the top-level compound embedding, finally outputting toxicity intensity value concerning the corresponding endpoint. b Illustration of data imbalance and data sparsity of the large-scale multi-condition acute toxicity dataset. c Two examples for calculating pairwise dependencies between endpoints, which were based on the training compounds shared by the two endpoints. The dependency was evaluated via a two-sided Pearson correlation coefficient (PCC) analysis. There exists a significant correlation between mouse-intravenous-LD50 and rabbit-intravenous-LDLo, as well as for mouse-intravenous-LD50 and mouse-skin-LD50. The center line in the correlation plots represents the regressed line and the error band denotes the confidence interval of 0.95 for linear regression. d The one-hot entity encoding strategy encompassing three endpoint attributes was developed for initializing endpoint embeddings in graph. Credits: the icons of bottles, chemicals, and animals including mouse, rabbit, cat, and man, along with illustrations of administration tools including spoon, syringe, and dropper, are sourced from https://creazilla.com/. Source data are provided as a Source Data file.
Fig. 2
Fig. 2. Performance comparison for multi-condition acute toxicity estimation on the 59-endpoint dataset.
a Average R2 and RMSE on all toxic endpoints via 5-fold cross-validation. The two-sided Wilcoxon signed-rank test was selected to compute the significant difference between ToxACoL and other baselines across all endpoints. It can be seen that the p-values are small, indicating that the improvements by our ToxACoL are statistically significant. The five dots on each box plot represent the results of five cross-validation experiments; the center line in the box represents the median among the five results, excluding outliers; the lower and upper bounds of the box represent the first (Q1) and third (Q3) quartiles, respectively; the lower and upper bounds of the whiskers represent the minima and maxima, excluding outliers, respectively. b Overall performance distribution of different models on 59 endpoints, fitted using Kernel density estimation (KDE). The 59 dots in the ridge plot represent the endpoint-wise performance of the corresponding method on the 59 endpoints. The more concentrated their distribution and the smaller their standard deviation, the more balanced the model’s performance on all endpoints. c The proportion of different models in performance rankings on all 59 toxic endpoints. d The Friedman and Nemenyi test with the critical difference (CD) for all models. The CD diagrams illustrate the average performance ranking of each model on 59 endpoints, calculated based on R2 and RMSE. The length of the horizontal thick line segments is shorter than the CD value, indicating that the differences between the two models covered by these thick line segments are not significant. e The heatmap of endpoint-wise performance achieved by all models. All endpoints were arranged from left to right in ascending order of their sample sizes of toxicity measurements. Source data are provided as a Source Data file.
Fig. 3
Fig. 3. The performance comparison between ToxACoL and baseline models on small-sized acute toxic endpoints.
a, c, and e Average R2 of different models over 5-fold cross-validation on human-oral-TDLo, women-oral-TDLo, and man-oral-TDLo. Their significant differences were analyzed on the basis of a two-sided Student t-test. b, d, and f Acute toxicity estimation curves of ToxACoL for testing compounds at three human-related endpoints. Here, ToxACoL was trained using four folds of the whole toxicity dataset, and the testing compounds are all from the remaining one test fold. g Comparison between ToxACoL and advanced baseline methods on more small-sized endpoints. Taking the first subgraph for example, it considered the 4 endpoints (n = 4) with sample size of measurements <130, and so on for the following three subgraphs. The dots on the bar represent R2 values at single endpoints, and the bar with the error bar denotes the mean R2 value with standard deviation over the n small-sized endpoints (from left to right, n = 4, 8, 14, 21, respectively). h Comparison between ToxACoL and advanced baseline methods on 11 large-sized endpoints (n = 11). The bar with the error bar represents the mean R2 value with standard deviation over the 11 large-sized endpoints. Source data are provided as a Source Data file.
Fig. 4
Fig. 4. The acute toxicity evaluation performance of different methods with reducing training measurements of small-sized endpoints.
a–c The performance at the three human-related endpoints, including human-oral-TDLo, women-oral-TDLo, and man-oral-TDLo, with the toxicity measurement samples used for training reduced proportionally. d The performance over all the 21 small-sized endpoints (n = 21) as the toxicity measurement samples used for training reduced proportionally, where the bar with the error bar represents the mean R2 value with standard deviation over the 21 small-sized endpoints. Source data are provided as a Source Data file.
Fig. 5
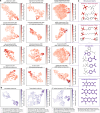
Fig. 5. Analysis of model interpretability and practicality.
a and b The t-SNE visualization of top-level embeddings learned by ToxACoL concerning various acute toxic endpoints. Here, ToxACoL was trained using four-fold data of the 59-endpoint acute toxicity dataset, and the displayed compounds are all from the remaining test fold. The darker the dot’s color, the greater its toxicity intensity. Visualization of single endpoints (a) and multiple endpoints belonging to the same species (b). c Several compound examples of structural alerts discovered by ToxACoL from the high-toxicity clusters at different endpoints, including quaternary ammonium cation, aromatic nitro, and halogenated dibenzodioxin, which have been highlighted by masks.
Fig. 6
Fig. 6. Extrapolation pattern analysis and applicability domain analysis.
a Pearson correlation coefficient (PCC) values between human-oral-TDLo and the remaining 58 endpoints. Note that there are a total of 140 compounds in the dataset that have available toxicity measurement values at human-oral-TDLo endpoint. The missing toxicity intensity values of these 140 compounds at the other 58 endpoints were filled in by the predicted intensity values of ToxACoL. Thus, the PCC value between the two endpoints was calculated based on the two groups of toxicity intensity values of the 140 compounds concerning the two endpoints. The Pearson correlation analysis is two-sided. The center line in the correlation plots represents the regressed line and the error band denotes the confidence interval of 0.95 for linear regression. b Latent space representation distribution for cat-intravenous-LDLo, human-oral-TDLo, woman-oral-TDLo, and man-oral-TDLo. Here, ToxACoL was trained using four-fold data of the whole acute toxicity dataset, and the displayed compounds are all from the remaining test fold. c Performance metrics (R2,  RMSE) of in-AD and out-of-AD samples under varying thresholds within the AD defined in this study, averaged across 59 endpoint tasks. The X-axis represents the AD threshold ST corresponding to different Z parameters. The left Y-axis (blue lines) indicates metric values, while the right Y-axis (red lines) denotes the proportion of extracted samples relative to the total (Coverage). Blue lines and shaded areas represent the mean and standard deviation of five-fold cross-validation results. Source data are provided as a Source Data file.
Fig. 7
Fig. 7. Interface of the ToxACoL online prediction web platform.
a Homepage, where users can input molecular SMILES in the “Input SMILES Structures” section and click “Submit” to initiate the acute toxicity analysis. b The result page of acute toxicity prediction. c The result page of GHS classification. Credits: the icons of molecular structure and animals are sourced from https://creazilla.com/. Source data are provided as a Source Data file.

Similar articles

References

    1. Johnson, A. C., Jin, X., Nakada, N. & Sumpter, J. P. Learning from the past and considering the future of chemicals in the environment. Science367, 384–387 (2020). - PubMed
    1. Saiz-Lopez, A. et al. Natural short-lived halogens exert an indirect cooling effect on climate. Nature618, 967–973 (2023). - PMC - PubMed
    1. Lane, M. K. M. et al. Green chemistry as just chemistry. Nat. Sustain.6, 502–512 (2023).
    1. Luechtefeld, T., Rowlands, C. & Hartung, T. Big-data and machine learning to revamp computational toxicology and its use in risk assessment. Toxicol. Res.7, 732–744 (2018). - PMC - PubMed
    1. Mansouri, K. et al. Catmos: collaborative acute toxicity modeling suite. Environ. Health Perspect.129, 047013 (2021). - PMC - PubMed

LinkOut - more resources