. 2025 Jul 1;16(1):5677.
doi: 10.1038/s41467-025-61256-5.

Regenerating aged bone marrow via a nitric oxide nanopump

Affiliations

Regenerating aged bone marrow via a nitric oxide nanopump

Ke Li et al. Nat Commun. .

Abstract

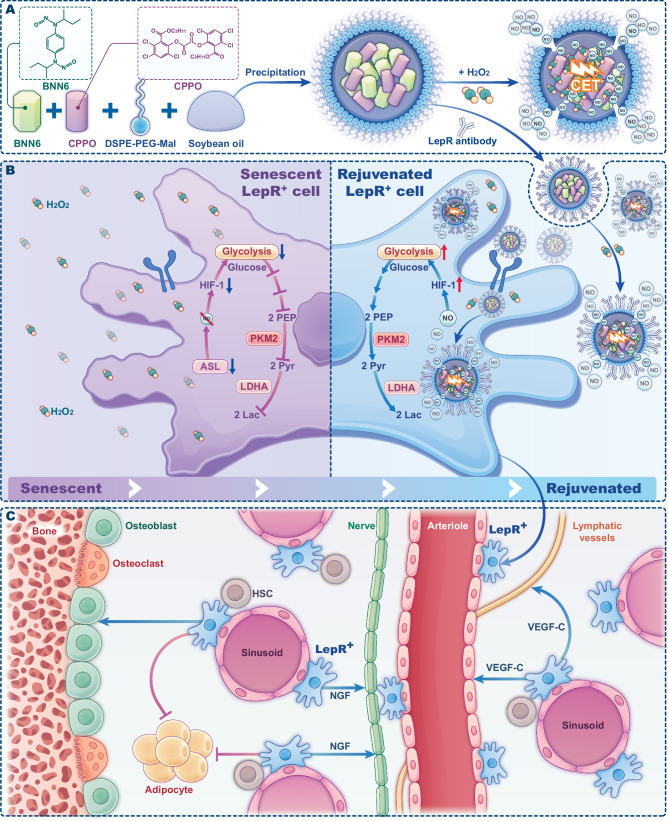
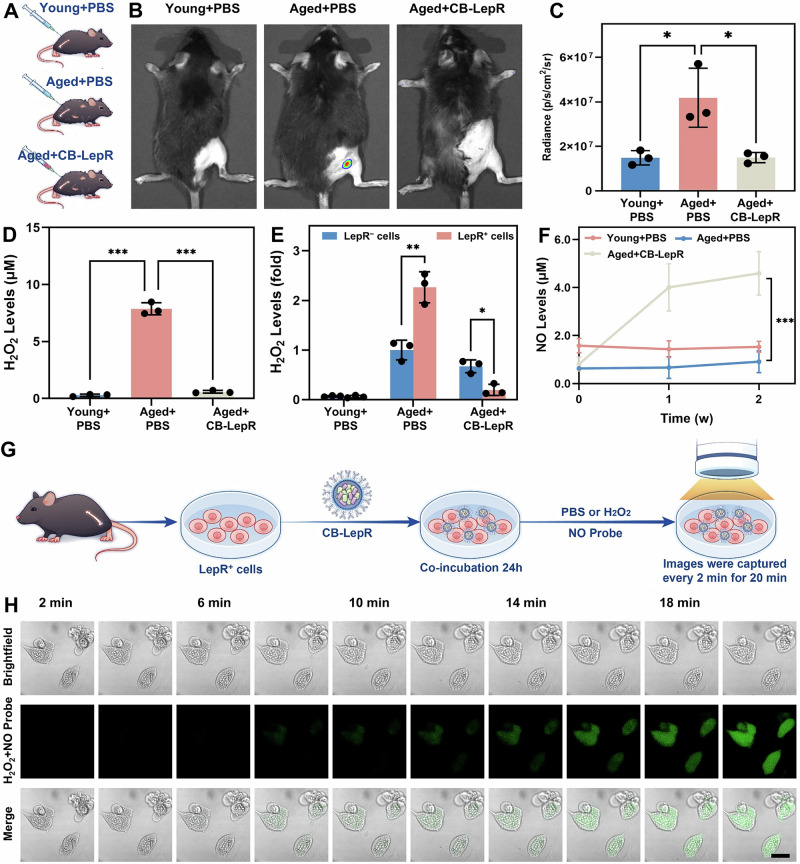
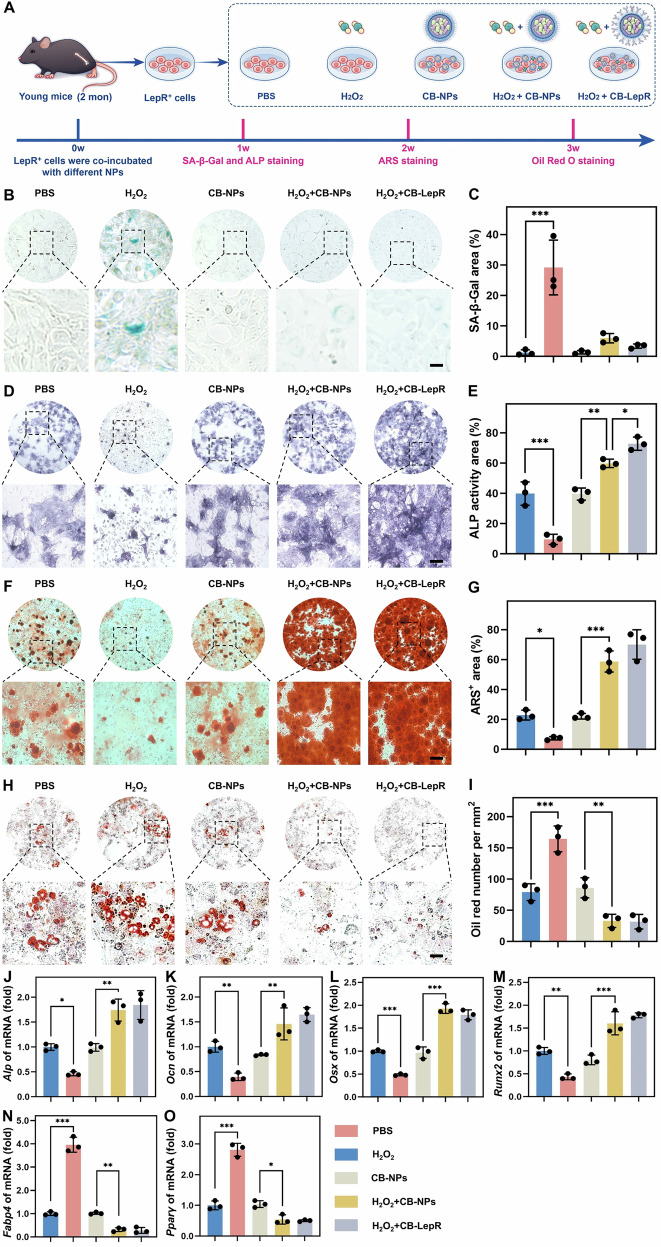
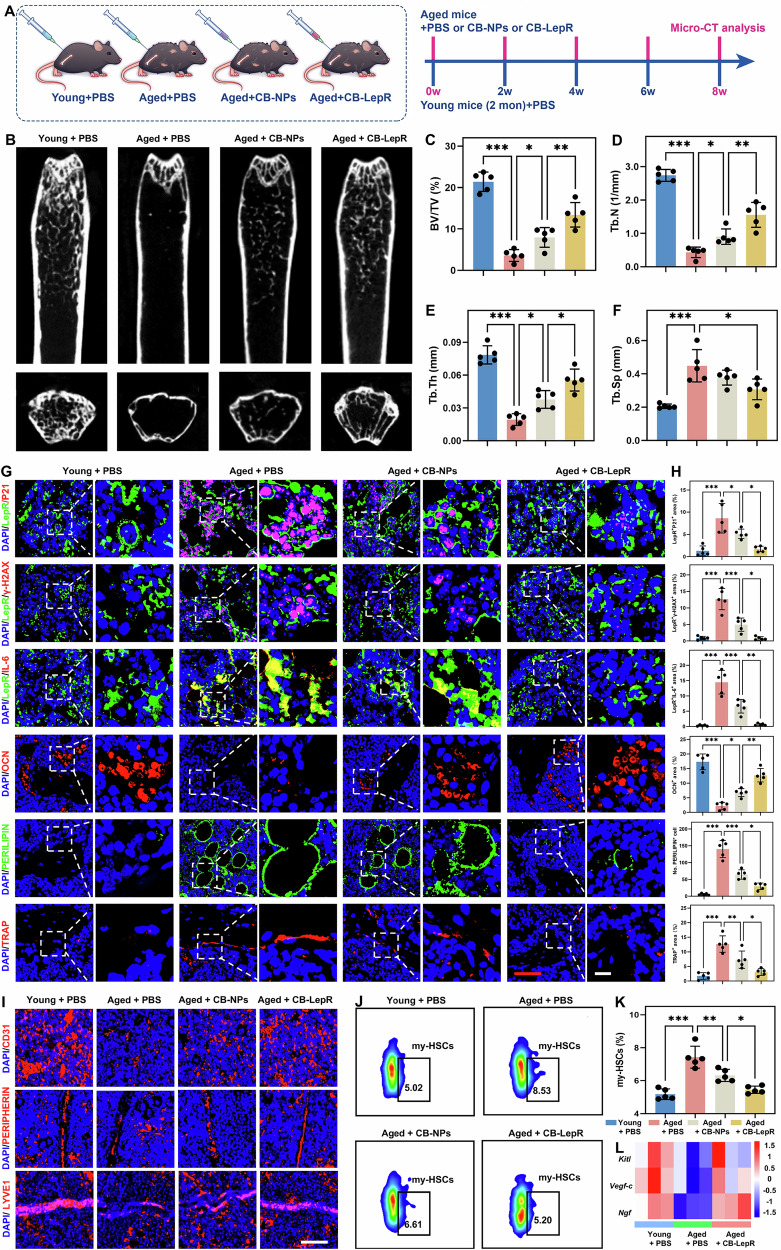
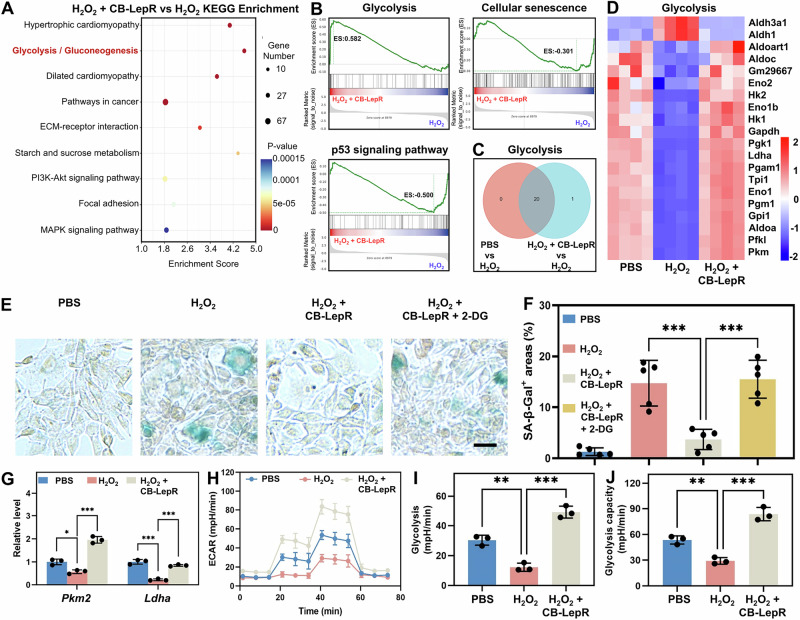
Resident leptin-receptor-expressing (LepR+) cells senescence in the aged bone marrow impairs the regenerative capacity of osteo- and other lineages of cells. In this study, a LepR+ cell-targeting nitric oxide (NO) nanopump with in vivo self-controlled turn-on ability was constructed to rejuvenate the LepR+ cells in the aged bone marrow. The nanopump co-entrapped hydrophobic chemiluminescence substrate and NO donor into the matrix of amphiphilic polymer through a nanoprecipitation process. The chemiluminescence substrate in the NO nanopump automatically reacts with the accumulated H2O2 in the aged bone marrow and then directly transfers the chemical energy to the NO donor to induce in situ NO release. The NO produced in situ within the aged bone marrow triggered the regeneration of the osteoblastic and the other niches in vivo through activating the glycolysis signaling in the senescent LepR+ cells. Conclusively, the constructed NO nanopump is a promising tool to counter aging-induced bone marrow disorders.


Conflict of interest statement

Competing interests: The authors declare no competing interest.

Figures

Fig. 1
Fig. 1. The process to re-establish homeostasis in aging-induced bone marrow collapse via the rejuvenation of senescent LepR+ cells with the NO nanopump.
A Construction of NO nanopump targeting LepR+ cells. B The NO nanopump scavenges the accumulated H2O2 in the aged BM, followed by the production of 1,2-dioxetanedione (DOD), the high-energy intermediate to directly excite the NO donor, causing in situ NO release to rejuvenate the senescent LepR+ cells by activating glycolysis signaling. C Rejuvenation of senescent LepR+ cells with the NO nanopump reestablished homeostasis via regeneration of HSCs, blood vessels, lymphatic vessels, and nerve fibers in aged BM.
Fig. 2
Fig. 2. Decreased ASL, increased senescence and H2O2 in the LepR+ cells of aged mice.
AD Levels of P21, ASL, CD31, OCN, PERIPHERIN and LYVE1 in young or aged mice and quantitative results (n = 5 mice). Scale bars, 500 μm (red), 10 μm (white) and 50 μm (green). E, F Proportion of my-HSCs (LineageSca-1+c-Kit+(LSK)CD48CD150high HSCs) in the femoral BM of young or aged mice (n = 5 mice). G Quantification of the mRNA levels of SCF (encoded by Kitl gene) in sorted LepR+ cell (n = 5 mice). H, I The fluorescence intensity of H2O2 probe in the femoral BM of young and aged mice. J H2O2 content in the femoral BM of young or aged mice (n = 5 mice). The data are shown as the means ± SDs. Statistical significance was determined by two-tailed unpaired Student’s t test (two groups); *P < 0.05, **P < 0.01, ***P < 0.005. Source data are provided as a Source Data file.
Fig. 3
Fig. 3. Design of CB-NPs and CB-LepR for NO production.
A Preparation of CB-NPs. B, C Transmission electron micrographs (TEM) and diameter distributions measured by dynamic light scattering (DLS) of CB-NPs and CB-LepR, respectively. Scale bar, 200 nm. D Size stability of CB-NPs and CB-LepR detected by DLS (n = 3 independent experiments). E HPLC chromatograms of CPPO, BNN6, and CB-NPs. F, G Energy levels of BNN6 and the active DOD. H Levels of NO released after co-incubation of H2O2 (different concentrations) with CB-LepR. (n = 3 independent experiments) I, J Fluorescence images of LepR+ cells stained with an NO fluorescent probe (DAF-FM DA) after different treatments (n = 3 independent experiments). The data are shown as the means ± SDs. Statistical significance was determined by two-tailed unpaired Student’s t test (two groups) or one-way ANOVA with Dunnett’s multiple comparison tests (multiple groups); **P < 0.01, ***P < 0.005. Source data are provided as a Source Data file.
Fig. 4
Fig. 4. Assessment of LepR+ cells-targeting properties.
A, B Fluorescence imaging of the ability of CBCY5.5-NPs and CBCY5.5-LepR to target LepR+ cells after FITC-conjugated secondary antibody labeling of LepR+ cells in femoral sections from the aged mice. Scale bars, 500 μm (red) and 50 μm (white). C, D Schematic diagram and representative fluorescence images of CBFITC-LepR-targeted LepR+ cells in LepR-tdTomato mice. Scale bar, 50 μm.
Fig. 5
Fig. 5. NO nanopumps effectively remove H2O2 and generate NO.
A Schematic diagram of the detection of H2O2 and NO in mice subjected to different treatments. B, C Representative fluorescence images and quantitative analysis of H2O2 probe-treated different mice (n = 3 mice). D Intracellular levels of H2O2 in the BM of the different groups after 2 weeks (n = 3 mice). E Intracellular H2O2 levels in sorted LepR+ and LepR cells from different treated mice (n = 3 mice). F Intracellular NO levels in sorted LepR+ cells from different treated mice (n = 3 mice). G Schematic diagram of a live-cell workstation capturing NO release from CB-LepR. H Representative images of NO release from LepR+ cells after co-incubation with CB-LepR + H2O2. 3 times each experiment was repeated independently with similar results. Scale bar, 50 μm. The data are shown as the means ± SDs. Statistical significance was determined by two-tailed unpaired Student’s t test (two groups) or one-way ANOVA with Dunnett’s multiple comparison tests (multiple groups); *P < 0.05, **P < 0.01, ***P < 0.005. Source data are provided as a Source Data file.
Fig. 6
Fig. 6. NO nanopumps alleviate the senescence of LepR+ cells and reverse their differentiation fate.
A In vitro treatment schedule. B, C Representative images and quantitative analysis of SA-β-Gal staining in different treatment groups (n = 3 independent experiments). Scale bar, 100 μm. (DG) Representative images and quantitative analysis of ALP and ARS staining in different treatment groups (n = 3 independent experiments). Scale bar, 100 μm. H, I Representative images and quantitative analysis of Oil red O staining in different treatment groups (n = 3 independent experiments). Scale bar, 100 μm. JO qPCR analysis of osteogenic (Alp, Ocn, Osx, and Runx2) and adipogenic (Fabp4 and Pparγ) gene expression in LepR+ stromal cells (n = 3 independent experiments). The data are shown as the means ± SDs. Statistical significance was determined by one-way ANOVA with Dunnett’s multiple comparison tests (multiple groups); *P < 0.05, **P < 0.01, ***P < 0.005. Source data are provided as a Source Data file.
Fig. 7
Fig. 7. CB-LepR exhibits anti-BM microenvironment aging efficacy.
A Treatment schedule in vivo. BF Representative micro-CT images and quantitative analysis of the bone volume per tissue volume (BV/TV), trabecular bone number (Tb.N), trabecular thickness (Tb.Th), and trabecular separation (Tb.Sp) (n = 5 mice). GH Immunofluorescence staining for senescence, bone formation, lipid droplet formation and osteoclastic activity (n = 5 mice). Scale bars, 50 μm (red) and 10 μm (white). I Representative fluorescence images of LepR+ cells promoting lymphatic, vascular, and neural regeneration. Scale bar, 50 μm. J, K Proportion of my-HSCs in different treatment groups (n = 5 mice). L Heatmap of SCF (encoded by Kitl gene), Vegf-c and Ngf in the young + PBS, aged + PBS, and aged + CB-LepR groups. The data are shown as the means ± SDs. Statistical significance was determined by one-way ANOVA with Dunnett’s multiple comparison tests (multiple groups); *P < 0.05, **P < 0.01, ***P < 0.005. Source data are provided as a Source Data file.
Fig. 8
Fig. 8. NO nanopumps upregulate the glycolytic pathway to alleviate LepR+ cell senescence.
A KEGG pathway analysis of the H2O2 + CB-LepR and H2O2 groups. B GSEA of the H2O2 + CB-LepR and H2O2 groups. C Venn analyses of genes related to glycolysis in the PBS, H2O2, and H2O2 + CB-LepR groups. D Heatmap of differentially expressed glycolysis-related genes in the PBS, H2O2 and H2O2 + CB-LepR groups. E, F Representative images and quantitative analysis of SA-β-Gal staining (n = 3 independent experiments). Scale bars, 50 μm. G mRNA levels of genes in the glycolytic pathway, including Pkm2 and Ldha (n = 3 independent experiments). HJ Seahorse assay of glycolytic activity (ECAR) in LepR+ cells after 24 h of different treatments (n = 3 independent experiments). The data are shown as the means ± SDs. Statistical significance was determined by one-way ANOVA with Dunnett’s multiple comparison tests (multiple groups); *P < 0.05, **P < 0.01, ***P < 0.005. Source data are provided as a Source Data file.

Similar articles

References

    1. Ambrosi, T. H. et al. Aged skeletal stem cells generate an inflammatory degenerative niche. Nature597, 256–262 (2021). - PMC - PubMed
    1. Zhou, B. O., Yue, R., Murphy, M. M., Peyer, J. G. & Morrison, S. J. Leptin-receptor-expressing mesenchymal stromal cells represent the main source of bone formed by adult bone marrow. Cell Stem Cell15, 154–168 (2014). - PMC - PubMed
    1. Yue, R., Zhou, B. O., Shimada, I. S., Zhao, Z. & Morrison, S. J. Leptin receptor promotes adipogenesis and reduces osteogenesis by regulating mesenchymal stromal cells in adult bone marrow. Cell Stem Cell18, 782–796 (2016). - PubMed
    1. Gao, X. et al. Leptin receptor(+) cells promote bone marrow innervation and regeneration by synthesizing nerve growth factor. Nat. Cell Biol.25, 1746–1757 (2023). - PMC - PubMed
    1. Biswas, L. et al. Lymphatic vessels in bone support regeneration after injury. Cell186, 382–397.e324 (2023). - PMC - PubMed

MeSH terms

LinkOut - more resources