. 2025 Jul 1;16(1):5943.
doi: 10.1038/s41467-025-61178-2.

Paraventricular hypothalamic input to anterior cingulate cortex controls food preferences in chronic visceral pain mice

Affiliations

Paraventricular hypothalamic input to anterior cingulate cortex controls food preferences in chronic visceral pain mice

Qi-Ya Xu et al. Nat Commun. .

Abstract

Chronic visceral pain is frequently accompanied by changes in food preference. The paraventricular hypothalamus (PVH) and the anterior cingulate cortex (ACC) are well-known regions involved in pain processing and food intake. However, the underlying neural circuitry mechanisms remain unclear. Here, we showed that a circuit from cholecystokinin neurons in the PVH (PVHCCK) projecting to glutamatergic neurons in the ACC (ACCGlu) to regulate food preference in male mice with chronic visceral pain induced by neonatal colonic inflammation (NCI). The mice with chronic visceral pain preferred for sucrose when compared with control mice. Chemogenetic inhibition of the PVHCCK to ACCGlu circuit reduced chronic visceral pain and led to food preference switched from sucrose to intralipid, which was reversed by an injection of an agonist of CCKBRs in the ACC. Chemogenetic activation of PVHCCK to ACCGlu circuit increased visceral pain and resulted in food preference switched from intralipid to sucrose, which was reversed by an injection of an antagonist of cholecystokinin receptors (CCKBRs) in the ACC. Our study indicates that the PVHCCK to ACCGlu circuit encodes changes in food preference during chronic visceral pain. Intervention targeting this neural circuitry might be a potential therapeutic strategy for patients with chronic visceral pain.


Conflict of interest statement

Competing interests: The author(s) declare no competing interests.

Figures

Fig. 1
Fig. 1. Chronic visceral pain led to changes in food preference.
a Timeline for establishing and testing the chronic visceral pain model. b The colorectal distension (CRD) threshold in CON and NCI mice from weeks 6 to 12 (n = 8 mice/group, p < 0.0001 in 6 and 8weeks, p < 0.0001 in 10 weeks, p = 0.0011 in 12weeks). c Experimental model of food preference. d Heatmaps of mouse location throughout the free-feeding tests. e The percentage of time spent in each food zone and percentage of each type of liquid intake (n = 9 mice/group, Food zone time: p < 0.0001 in IL, p = 0.0002 in S; Food intake percentage: p < 0.0001 in IL, p < 0.0001 in S). f Correlation between the percentage of food zone time and percentage of food intake (p < 0.0001, r = 0.7318). g Body weights of CON and NCI mice (n = 9 mice/group, p = 0.0003 in 12 h). h Intraperitoneal injection of ibuprofen or indomethacin significantly relieved visceral pain (n = 9 mice/group, p < 0.0001 in ibuprofen and indomethacin). i The percentage of time spent in each food zone and percentage of each type of liquid intake (n = 9 mice/group, Food zone time: p = 0.0052 and 0.0203 in ibuprofen, p = 0.0087 and 0.0053 in indomethacin; Food intake percentage: p < 0.0001 in ibuprofen, p < 0.0001 in indomethacin). All the data are presented as the means ± SEMs. Two-way ANOVA with Sidak’s multiple comparisons test (b, e, gi). Linear regression and Correlation (f). *p < 0.05; **p < 0.01; ***p < 0.001.
Fig. 2
Fig. 2. PVHCCK encodes chronic visceral pain-induced change in food preference.
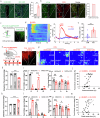
a Representative images of c-Fos expression after CRD stimulation and the total number of c-Fos-expressing neurons (n = 3 mice, p < 0.0001). Scale bar:20 µm. b Representative images of coexpressing c-Fos (green) and CCK (red) neurons and the percentage of coexpressing c-Fos in the PVH (n = 3 mice). Scale bar:20 µm. c Schematic of the optical fiber photometry assay and representative images of EGFP expression in the PVH. Scale bar:20 µm. d Heatmaps and average calcium activity showing Ca2+ signals time-locked to the CRD stimulus in NCI and CON mice. e Area under the curve of Ca2+ activity in PVH CCK-positive neurons from NCI and CON mice receiving CRD stimulation (n = 7 mice, p = 0.0022). f Schematic of viral injection (top) and the experimental protocol of chemogenetics (bottom) and representative images of mCherry expression in the PVH. Scale bar:20 µm. g Heatmaps of mouse location during the free-feeding tests. h Colorectal distention (CRD) threshold changes before and after hM3Dq activation of PVHCCK neurons in CON mice (n = 9 mice/group, p < 0.0001). i Percentage of time and intake for each type of food before and after hM3Dq activation of PVHCCK neurons in CON mice (n = 9 mice/group, Food intake percentage: p < 0.0001; Food zone time: p = 0.0049 in IL and p = 0.0097 in S). j Correlation between the percentage of food zone time and percentage of food intake (p < 0.0001, r = 0.6688). k CRD threshold before and after hM4Di inhibition of PVHCCK neurons in NCI mice (n = 9 mice/group, p < 0.0001). l The percentage of food zone time and intake for each food type before and after hM4Di inhibition of PVHCCK neurons in NCI mice (n = 9 mice/group, Food intake percentage: p < 0.0001; Food zone time: p = 0.0013 in IL and p = 0.032 in S). m Correlation between the percentage of food zone time and percentage of food intake (p = 0.0025, r = 0.5153). All the data are presented as the means ± SEMs. Two-sided student’s t test (a, e). Two-way ANOVA with Sidak’s multiple comparisons test (i, l). Ordinary one-way ANOVA with Dunnett’s multiple comparisons test (h, k). Linear regression and Correlation (j, m). *p < 0.05; **p < 0.01; ***p < 0.001.
Fig. 3
Fig. 3. PVHCCK neurons projected to ACCGlu neurons.
a Schematic of the anterograde virus tracing strategy (left) and typical images of virus injection sites within the PVH and viral expression in the ACC (right). Scale bar:20 µm. b Schematic of virus injection (left) and representative images showing RV-DsRed expression in the PVH (right). Scale bar:20 µm. c Schematic of the retrograde virus tracing strategy. d Typical images of virus injection sites within the ACC and viral expression in other brain regions. Scale bar:20 µm. e Schematic of viral injection and the real-time optical fiber photometry assay (top) and representative images showing EGFP and mCherry expression in the ACC and PVH (bottom). Scale bar:20 µm. f Heatmaps and average Ca2+ transient signals of ACCGlu neurons in hM4Di+CNO and hM4Di+NS mice receiving CRD stimulation. g Area under the curve of Ca2+ activity of ACCGlu neurons in hM4Di+CNO and hM4Di+NS mice receiving CRD stimulation (n = 7 mice/group, p = 0.0337). h Heatmaps and average Ca2+ transient signals of ACCGlu neurons in hM3Dq+CNO and hM3Dq+NS mice receiving CRD stimulation. i Area under the curve of Ca2+ activity of ACCGlu neurons in hM3Dq+CNO and hM3Dq+NS mice receiving CRD stimulation (n = 7 mice/group, p = 0.0413). All the data are presented as the means ± SEMs. Two-sided student’s t test (g, i). *p < 0.05.
Fig. 4
Fig. 4. ACCGlu modulates chronic visceral pain-induced change in food preference.
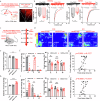
a Representative images of c-Fos expression following CRD stimulation in the ACC and the total number of c-Fos-expressing neurons (n = 3 mice, p < 0.0001). Scale bar:20 µm. b Representative images showning the coexpression of c-Fos neurons (green) and glutamatergic neurons (red) in the ACC, along with the percentage of coexpressed neurons (n = 3 mice). Scale bar:20 µm. c Schematic representation of the optical fiber photometry assay and representative images of EGFP expression in the ACC. Scale bar:20 µm. d Heatmaps and average calcium activity showing Ca2+ signals time-locked to the CRD stimuli in NCI and CON mice. e Area under the curve of Ca2+ activity in Glu-positive ACC neurons in CON and NCI mice receiving CRD stimulation (n = 7 mice, p = 0.0435). f Schematic of viral injection (top) and experimental protocol of chemogenetic (bottom) and representative images of mCherry expression in the ACC. Scale bar:20 µm. g Spatial location heatmaps from free-feeding tests. h Colorectal distention (CRD) thresholds before and after hM3Dq activation of ACCGlu neurons in CON mice (n = 9 mice/group, p < 0.0001). i Percentage of time spent in each food zone and intake of each food type before and after hM3Dq activation of ACCGlu neurons in CON mice (n = 9 mice/group, Food intake percentage: p < 0.0001, Food zone time: p = 0.0173 in IL and p = 0.0107 in S). j Correlation between the percentage of food zone time and percentage of food intake (p = 0.001, r = 0.5254). k CRD threshold before and after hM4Di inhibition of ACCGlu neurons in NCI mice (n = 9 mice, p = 0.0005). l The percentage of food zone time and food intake for each food before and after hM4Di inhibition of ACCGlu neurons in NCI mice (n = 9 mice/group, Food intake percentage: p < 0.0001, Food zone time: p = 0.0172 in IL and p = 0.0356 in S). m Correlation between the percentage of food zone time and percentage of food intake (p < 0.0001, r = 0.6115). All the data are presented as the means ± SEMs. Two-sided student’s t test (a, e). Two-way ANOVA with Sidak’s multiple comparisons test (i, l). Ordinary one-way ANOVA with Dunnett’s multiple comparisons test (h, k). Linear regression and Correlation (j, m). *p < 0.05; **p < 0.01; ***p < 0.001.
Fig. 5
Fig. 5. PVHCCK-ACCGlu circuit regulates chronic visceral pain-induced changes in food preference.
a Schematic of chemogenetics manipulation (left) and representative images of chemogenetic viral expression in the PVH (right). Scale bar:20 µm. b Top: Representative traces of sEPSCs in ACC neurons following bath application of ACSF and then CNO. Bottom: sEPSC peak amplitude and cumulative fraction plots (n = 7 cells/group, Pre+hM3Dq vs Post+hM3Dq, p = 0.0349; Pre+hM4Di vs Post+hM4Di, p = 0.0255). c Schematic of chemogenetic manipulation (left) and the experimental protocol of chemogenetic manipulation (right). d Heatmaps of mouse location during the free-feeding tests. e Colorectal distention thresholds before and after hM3Dq activation of PVHCCK neurons terminal in the ACC region in CON mice (n = 9 mice/group, p < 0.0001). f Food zone time percentage and food intake percentage for each liquid type before and after hM3Dq activation of PVHCCK neurons terminal in the ACC region in CON mice (n = 9 mice/group, Food intake percentage, p < 0.0001; Food zone time, IL:hM3Dq+NS vs hM3Dq+CNO, p = 0.0103, S: hM3Dq+NS vs hM3D+CNO, p = 0.0059). g Correlation between the percentage of food zone time and percentage of food intake (p = 0.0005, r = 0.5527). h CRD threshold before and after hM4Di inhibition of PVHCCK neurons terminal in the ACC region in NCI mice (n = 9 mice/group, p < 0.0001). i The percentage of food zone time and percentage of intake for each of the three liquids before and after hM4Di inhibition of the PVHCCK neurons terminating in the ACC region in NCI mice (n = 9 mice/group, Food intake percentage, p < 0.0001; Food zone time: p = 0.0002 in IL and p = 0.0007 in S). j Correlation between the percentage of food zone time and percentage of food intake (p = 0.0088, r = 0.4557). All the data are presented as the means ± SEMs. Two-sided student’s t test (b). Two-way ANOVA with Sidak’s multiple comparisons test (f, i). Ordinary one-way ANOVA with Dunnett’s multiple comparisons test (e, h). Linear regression and Correlation (g, j). *p < 0.05; **p < 0.01; ***p < 0.001.
Fig. 6
Fig. 6. ACC expression of CCKBRs is increased in NCI mice.
a Representative western blot of CCKAR and CCKBR expression in the ACC. b CCKB receptor expression was significantly greater in the ACC of NCI mice than in that of CON mice (n = 6 mice/group, p = 0.0002). c The mRNA level of CCKBRs was markedly greater in the ACC of NCI mice than in that of CON mice (n = 6 mice/group, p < 0.0001). d Schematic of proglumide sodium or tetragastrin injection (left), and the red boxes show the site of microinjection into the ACC (right). e Bar plot showing the colorectal distension (CRD) threshold in NCI mice treated with proglumide sodium compared with those in the NCI and NS groups (n = 8 mice/group, p < 0.0001). f Bar plot showing the CRD threshold in CON mice treated with tetragastrin compared with those in the CON and NS groups (n = 8 mice/group, p < 0.0001). g Representative images showing the colocalization of CCKBR (green) and glutamatergic neurons (red) in the ACC of NCI mice. Scale bar:20 µm. h Percentage of colocalization in the ACC region (n = 3 mice). All the data are presented as the means ± SEMs. Two-way ANOVA with Sidak’s multiple comparisons test (b, c). Ordinary one-way ANOVA with Dunnett’s multiple comparisons test (e, f). **p < 0.01.
Fig. 7
Fig. 7. CCKBRs mediate the regulatory role of the PVHCCK-ACCGlu circuit in chronic visceral pain-induced food preference changes.
a Schematic of chemogenetics manipulation and representative images of viral expression in the PVH and ACC. Scale bar:20 µm. b Representative traces of sEPSCs in ACC neurons following bath application of ACSF, CNO and then CNO with proglumide sodium. c Cumulative fraction plots and quantification of sEPSCs peak amplitude (n = 8 cells/group, Pre vs CNO, p = 0.0114; CNO vs CNO+Pro, p = 0.0121). d Schematic of chemogenetic manipulation and representative images of viral expression in the PVH and ACC. Scale bar:20 µm. e Representative traces of sEPSCs in ACC neurons following bath application of ACSF or CNO, and subsequent application of CNO with tetragastrin. f Cumulative fraction plots and quantification of sEPSCs peak amplitude (n = 6 cells/group, Pre vs CNO, p = 0.0447; CNO vs CNO+Tet, p = 0.0252). g Schematic of chemogenetic manipulation (left) and related experimental protocol (right). h Heatmaps of mouse location during the free-feeding tests. i Colorectal distension (CRD) thresholds following hM3Dq+NS, hM3Dq+CNO or hM3Dq+CNO+proglumide sodium administration to CON mice (n = 8 mice/group, p < 0.0001). j Food zone time percentage and food intake percentage following hM3Dq+NS, hM3Dq+CNO or hM3Dq+CNO+proglumide sodium administration to CON mice (n = 8 mice/group, Food intake percentage: p < 0.05; Food zone time: p < 0.05). k Correlation analysis between food zone percentage time and food intake percentage (p = 0.0107, r = 0.3652). l CRD threshold following hM4Di+NS, hM4Di+CNO or hM4Di+CNO+tetragastrin administration to NCI mice (n = 8 mice/group, p < 0.0001). m Food zone time percentage and food intake percentage following hM4Di+NS, hM4Di+CNO or hM4Di+CNO+tetragastrin administration to NCI mice (n = 8 mice/group, Food intake percentage: p < 0.05; Food zone time: p < 0.05). n Correlation between the percentage of food zone time and percentage of food intake (p = 0.0322, r = 0.3097). All the data are presented as the means ± SEMs. Two-way ANOVA with Sidak’s multiple comparisons test (j, m). Ordinary one-way with ANOVA Tukey’s multiple comparisons test (c, f, i, l). Linear regression and Correlation (k, n). *p < 0.05; **p < 0.01; ***p < 0.001.

References

    1. Elsenbruch, S., Häuser, W. & Jänig, W. Visceral pain. Schmerz (Berl., Ger.)29, 496–502 (2015). - PubMed
    1. Zamyad, M., Abbasnejad, M., Esmaeili-Mahani, S., Sheibani, V. & Raoof, M. Pain influences food preference and food-related memory by activating the basolateral amygdala in rats. Exp. Brain Res.239, 79–93 (2021). - PubMed
    1. Diogo, M. A., Ribas, G. G. & Skare, T. L. Frequency of pain and eating disorders among professional and amateur dancers. Sao Paulo Med. J.134, 0 (2016). - PMC - PubMed
    1. Ciwoniuk, N., Wayda-Zalewska, M. & Kucharska, K. Distorted Body Image and Mental Pain in Anorexia Nervosa. Int. J. Environ. Res. Public Health20,718 (2022). - PMC - PubMed
    1. Verbanac, D., Maleš, Ž & Barišić, K. Nutrition - facts and myths. Acta Pharm. (Zagreb, Croat.)69, 497–510 (2019). - PubMed

MeSH terms

LinkOut - more resources