. 2025 Jul 1;16(1):6057.
doi: 10.1038/s41467-025-61379-9.

Lactate promotes invasive Klebsiella pneumoniae liver abscess syndrome by increasing capsular polysaccharide biosynthesis via the PTS-CRP axis

Affiliations

Lactate promotes invasive Klebsiella pneumoniae liver abscess syndrome by increasing capsular polysaccharide biosynthesis via the PTS-CRP axis

Junying Zhu et al. Nat Commun. .

Abstract

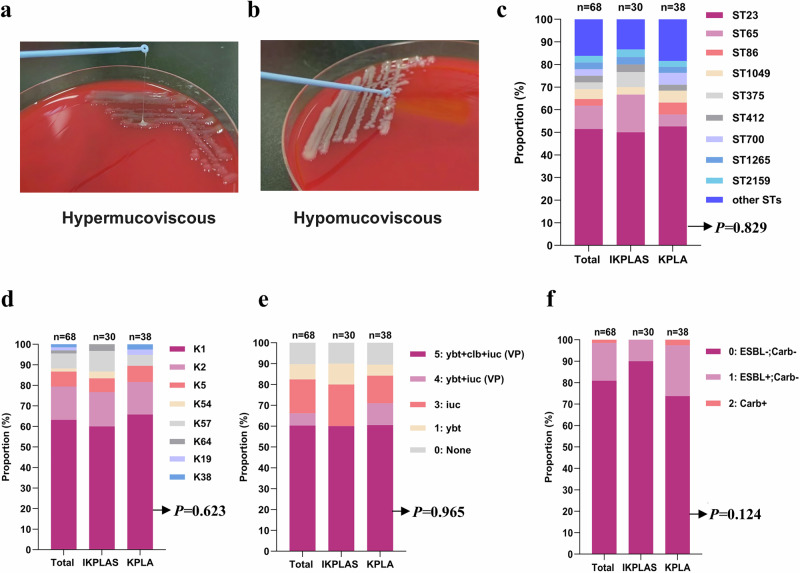
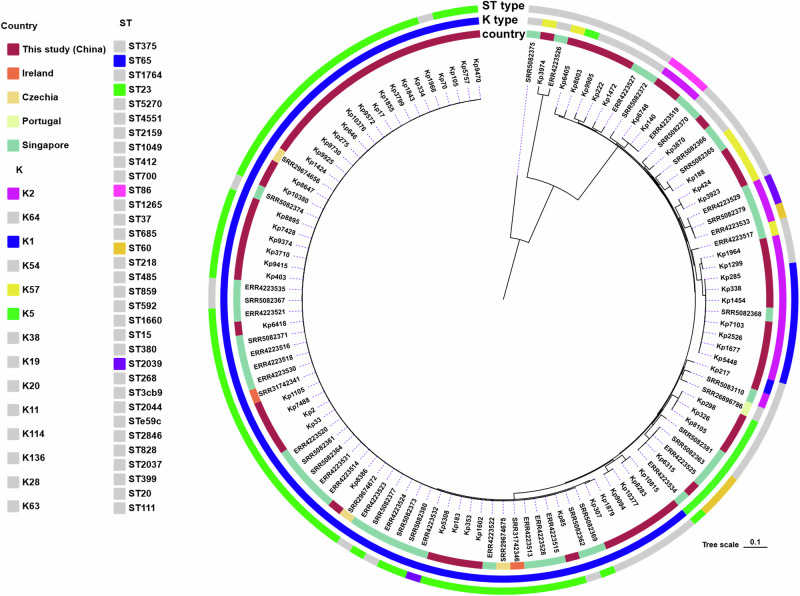
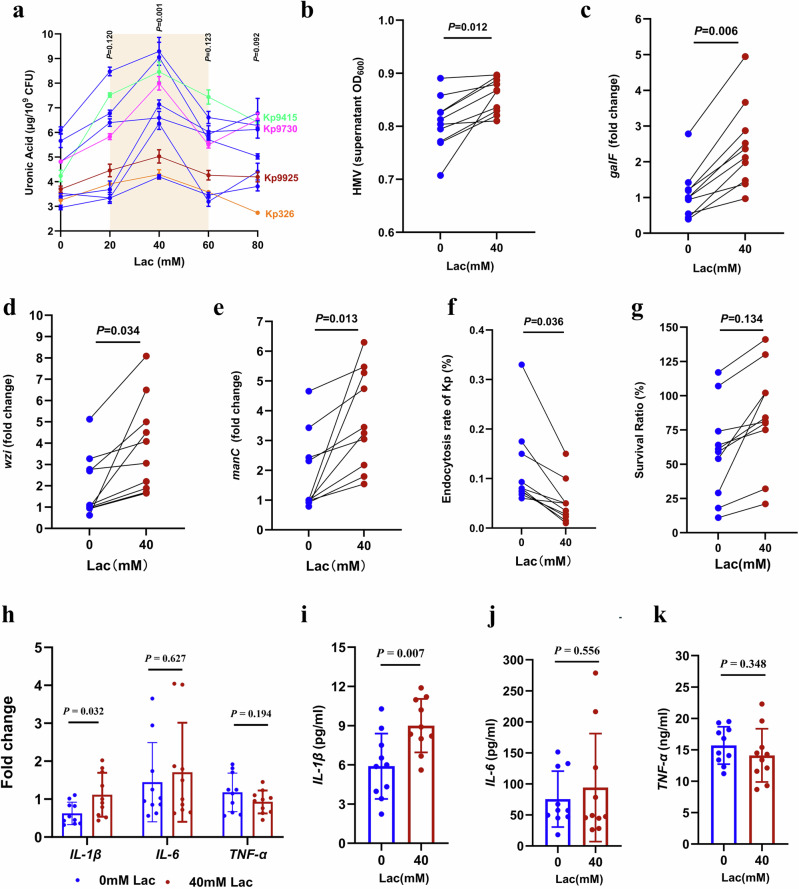
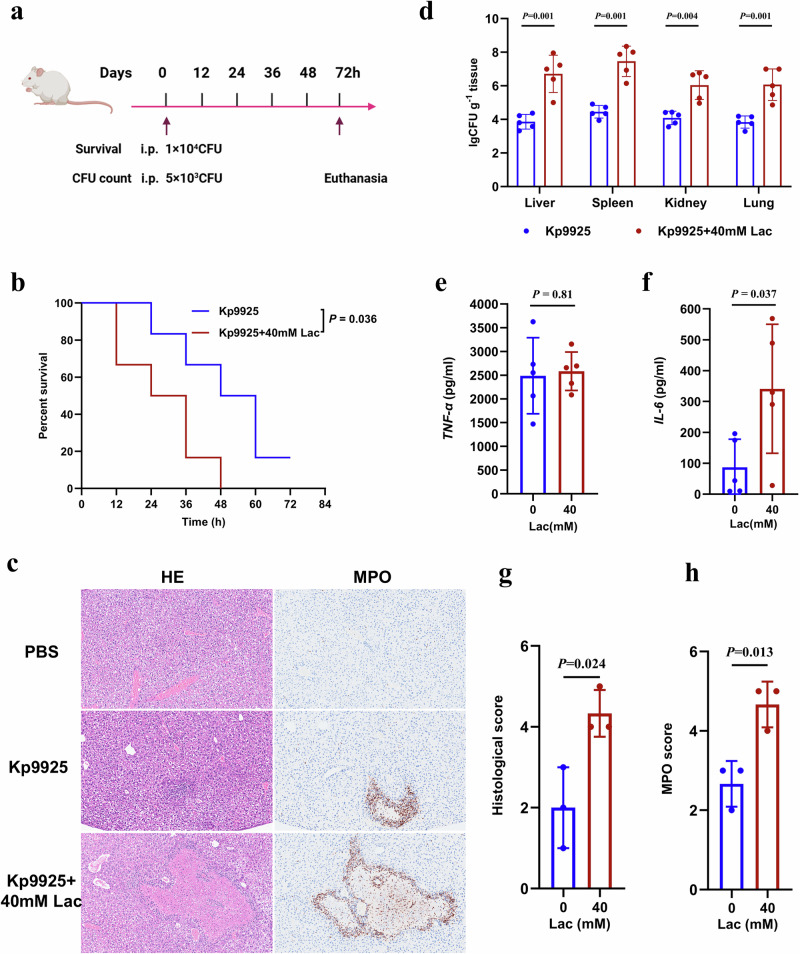
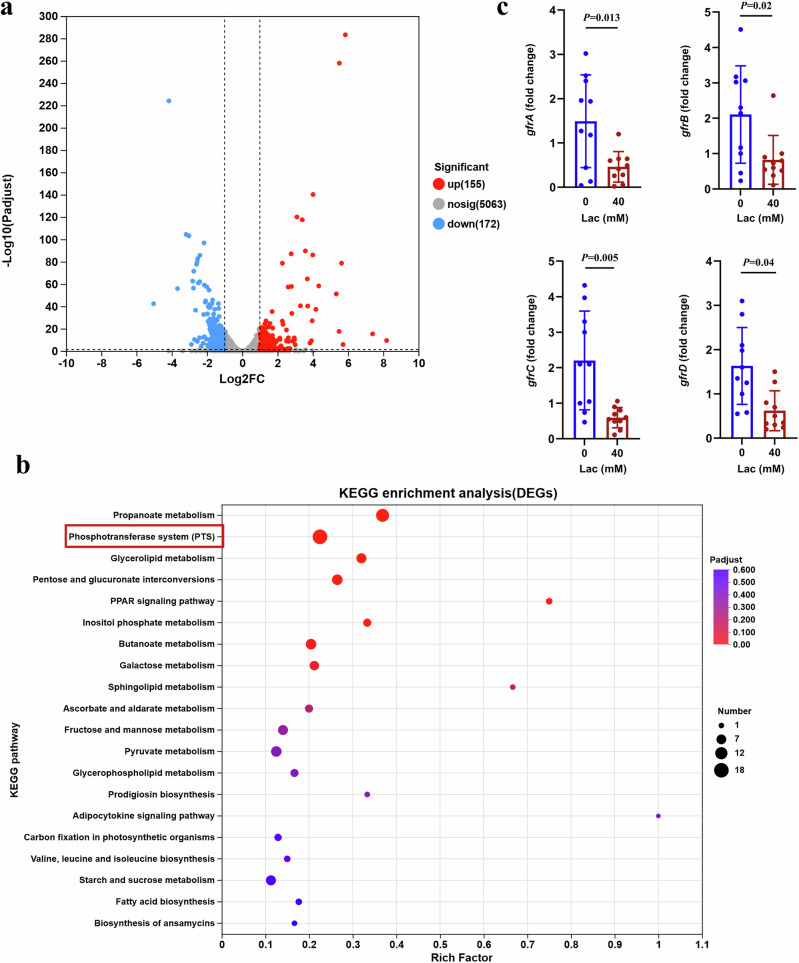
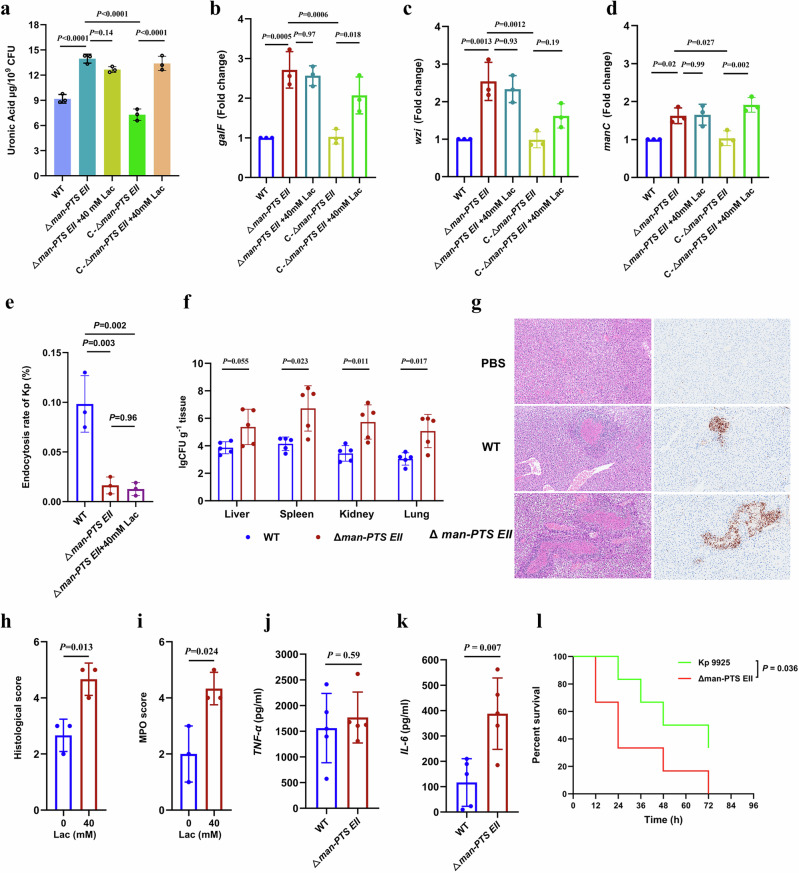
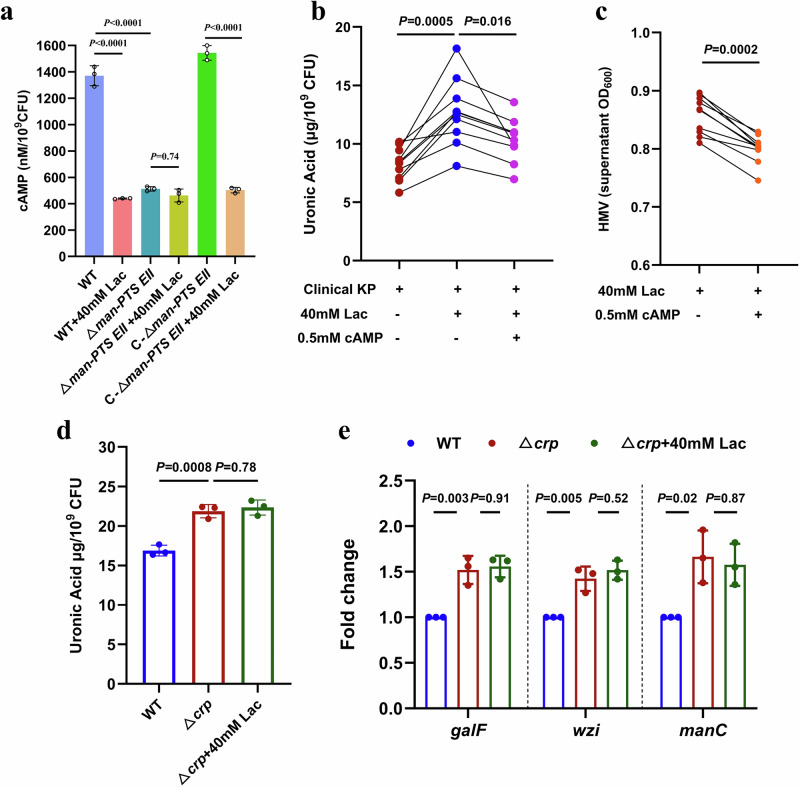
The global incidence of invasive Klebsiella pneumoniae liver abscess syndrome (IKPLAS) increases, yet its underlying molecular mechanisms remain elusive, hindering the development of effective therapeutic strategies. In this study, we analyze bacterial molecular profiles and clinical data from patients with KPLA and IKPLAS, and find no significant difference in the molecular characteristics of K. pneumoniae between the two groups, however, we identify elevated blood lactate levels as an independent predictor of IKPLAS. Further investigation reveals that lactate enhances K. pneumoniae virulence by promoting capsular polysaccharide (CPS) biosynthesis. Mechanistically, lactate reduces cyclic adenosine monophosphate (cAMP) levels by downregulating the expression of mannose-specific phosphotransferase system (man-PTS) enzyme IIA-D genes (gfrA, gfrB, gfrC and gfrD). This reduction in cAMP levels enhances CPS biosynthesis by decreasing its binding to the cAMP receptor protein (CRP). Our results highlight lactate's role in enhancing the virulence of K. pneumoniae via the PTS-CRP axis, offering insights into the pathogenesis of IKPLAS.


Conflict of interest statement

Competing interests: The authors declare no competing interests.

Figures

Fig. 1
Fig. 1. Molecular characteristics of K. pneumoniae from the IKPLAS and KPLA groups.
a, b Representative positive and negative string tests of K. pneumoniae isolates from the two groups. c Percentage of ST clones among K. pneumoniae isolates from the IKPLAS and KPLA groups. The nine most common ST types (ST23, ST65, ST86, ST1049, ST375, ST412, ST700, ST1265, ST2159) and other ST types are shown. d Percentage of K serotype in K. pneumoniae isolates from the IKPLAS and KPLA groups. e, f Percentage of virulence (e) and resistance (f) scores in K. pneumoniae from the IKPLAS and KPLA groups. Panels c–f were analyzed using a two-sided Pearson’s Chi-square test or Fisher’s exact test, as appropriate. Virulence and resistance score classifications, as defined by Kleborate, are presented on the right side of (e, f). The number of K. pneumoniae isolates in each group (n) is indicated above. ybt, yersiniabactin; clb, colibactin; iuc, aerobactin; VP, virulence plasmid; ESBL, extended-spectrum β-lactamase; Carb, carbapenemase. Source data are provided as a Source Data file.
Fig. 2
Fig. 2. The Phylogenetic structure of 117 K. pneumoniae isolates responsible for liver abscess.
The innermost circle represents the source countries of each isolate. The middle and outermost circles correspond to the K types and ST types, respectively. In K and ST types, gray block indicated the strain number of certain ST type or K type is less than three. Source data are provided as a Source Data file.
Fig. 3
Fig. 3. Lactate promotes the CPS production in clinical K. pneumoniae isolates.
a CPS quantification of 10 clinical K. pneumoniae isolates cultured in LB with increasing concentrations of sodium lactate. P values comparing each group to the control (0 mM lactate) are shown above the respective groups. The Kp9925 (highlighted in red) was used for RNA-seq and further mechanism investigation, while Kp9730 isolate (purple), Kp9415 (green) and Kp326 (yellow) were used in further animal experiments. b HMV of the 10 clinical K. pneumoniae isolates cultured in LB and Lac-LB. c–e RT-PCR analysis of CPS genes expression in the 10 clinical isolates cultured in LB and Lac-LB. Fold changes are relative to a randomly selected isolate cultured in LB alone. f Endocytosis rate of the 10 clinical K. pneumoniae isolates by RAW 264.7 macrophages. Data represents the ratio of intracellular bacterial CFU to the input bacteria CFU. g Serum resistance assays of 10 clinical K. pneumoniae isolates. Percent survival was determined as the number of surviving bacteria relative to the initial bacterial addition. h Transcriptional expression of proinflammatory cytokines in the RAW 264.7 macrophages infected with 10 clinical K. pneumoniae. i–k ELISA assays measuring proinflammatory cytokines in the supernatant of RAW 264.7 Macrophages infected with 10 clinical K. pneumoniae. For panels (h–k) K. pneumoniae isolates were cultured in LB and Lac-LB for 16 h, washed three times with PBS, and then used to infect RAW 264.7 cells. After 1 h of infection, extracellular bacteria were removed, followed by an additional 2 h of incubation for panel h, and 23 h for panels (i–k). The transcriptional levels of cytokines in RAW 264.7 cells and protein levels in the supernatant of K. pneumoniae-infected RAW 264.7 cells were then measured. Statistical analysis for panels (a–k) was performed using a two-sided independent-samples t-test. In panels (a, h–k), error bars show the mean ± SD. In panels (b–g), Each point represents the mean value of three biological replicates for each strain. All experiments were independently repeated three times with similar results. Source data are provided as a Source Data file.
Fig. 4
Fig. 4. Lactate enhances K. pneumoniae virulence in mice.
a Mouse model of liver abscess. For the survival experiment, mice were intraperitoneally injected with 1 × 104 CFU of K. pneumoniae. For bacterial load analysis in tissues, mice were received 5 × 103 CFU via intraperitoneal injection. b Survival curves of mice infected with Kp9925 cultured in LB or Lac-LB. Mice (n = 6/group) were monitored for 3 days. Statistical analysis was performed using the log-rank tests. c Representative histopathology of liver tissues (Hematoxylin-eosin and MPO staining). Images were shown at 200× magnification. d Bacterial load in the liver, spleen, kidney and lung tissues of mice (n = 5/group). e-f Serum levels of proinflammatory cytokines (IL-6 and TNF-α) measured by ELISA in mice infected with Kp9925 cultured in LB or Lac-LB (n = 5/group). g Histological scores (n = 3/group). h MPO scores (n = 3/group). For panels g and h, two tissue sections per sample were scored on a 0 to 3 scale, and the cumulative lesion score was obtained by summing the individual scores. For panels d-h, n represents the number of biological replicates and statistical analysis was conducted using a two-sided independent-samples t-test. Error bars represent the mean ± SD. All experiments were independently repeated three times with similar results. Source data are provided as a Source Data file.
Fig. 5
Fig. 5. Lactate induces transcriptome sequencing and differential gene analysis in K. pneumoniae.
a Volcano map showing differentially expressed genes in Kp9925 cultured in LB versus Lac-LB. b KEGG pathway enrichment analysis of differentially expressed genes. c Validation of gfrA, gfrB, gfrC and gfrD expression in 10 K. pneumoniae isolates cultured in LB and Lac-LB. For (a, b) Fisher’s exact test was used to test significance and adjusted by Benjamini and Hochberg. For panel c, statistical analysis was conducted using a two-sided independent-samples t-test. Error bars represent the mean ± SD. Source data are provided as a Source Data file.
Fig. 6
Fig. 6. Man-PTS EII knockout mutant produces more CPS and induces more severe infection in mice compared to the WT strain.
a CPS quantification of the wild type (WT), Δman-PTS EII mutant and complemented mutant (C-Δman-PTS EII) strains cultured in LB or Lac-LB. b–d RT-PCR analysis of CPS encoding genes expression (galf, wzi and manC) in the WT, Δman-PTS EII mutant and C-Δman-PTS EII strains cultured in LB and Lac-LB. e Endocytosis rate of the WT and Δman-PTS EII strains by RAW 264.7 macrophages. Data represent the ratio of intracellular bacterial CFU to the input bacteria CFU. f Bacterial loads in liver, spleen, kidney and lung tissues. n = 5/group. g Representative histopathology of liver tissues (Hematoxylin-eosin and MPO staining). Images captured at 200× magnification. h, i Histological and MPO score (n = 3/group). Two tissue sections per sample were scored on a 0 to 3 scale, and cumulative lesion scores were calculated by summing the individual section scores. j–k Serum protein levels of proinflammatory cytokines IL-6 and TNF-α in mice infected with the WT and Δman-PTS EII strains, measured by ELISA. n = 5/group. l Survival curves of mice infected with the WT and Δman-PTS EII strains. Mice (n = 6/group) were intraperitoneally injected with 1 × 104 CFU bacteria and monitored for 3 days. Statistical analysis for panels a-e was performed using one-way ANOVA with Tukey’s post-tests; (f–k) were analyzed using two-sided independent-samples t-test. The survival analysis (l) was performed using the log-rank test. Error bars show the mean ± SD. n indicates the number of biological replicates for all experiments. Source data are provided as a Source Data file.
Fig. 7
Fig. 7. Downregulation of Man-PTS EII increases CPS biosynthesis via the cAMP-CRP regulon.
a Intracellular cAMP concentration in the wild-type (WT), Δman-PTS EII mutant, and complemented mutant (C-Δman-PTS EII) strains cultured in LB or Lac-LB (n = 3). b CPS quantification of the 10 clinical K. pneumoniae isolates grown in LB broth supplemented with lactate and/or cAMP. c HMV of the same 10 isolates cultured in Lac-LB with or without cAMP supplementation. d CPS quantification of the WT and Δcrp strains in LB or Lac-LB (n = 3). e Transcriptional expression of CPS gene cluster in the WT and Δcrp strains cultured in LB or Lac-LB (n = 3). the isolates used in panels b and c are the same as those shown in Fig. 3a. n indicates the number of biological replicates for all experiments. Statistical analysis in (c) was performed using a two-sided independent-samples t-test, while other panels were analyzed by one-way ANOVA with Tukey’s post-tests. In panels (a, d, e), error bars show the mean ± SD. In panels (b, c), Each point represents the mean value of three biological replicates for each strain. Source data are provided as a Source Data file.

Similar articles

References

    1. Siu, L. K., Yeh, K.-M., Lin, J.-C., Fung, C.-P. & Chang, F.-Y. Klebsiella pneumoniae liver abscess: a new invasive syndrome. Lancet Infect. Dis.12, 881–887 (2012). - PubMed
    1. Lin, Y. et al. Clinical characteristics of pyogenic liver abscess with and without biliary surgery history: a retrospective single-center experience. BMC Infect. Dis.24, 479 (2024). - PMC - PubMed
    1. Li, W., Chen, H., Wu, S. & Peng, J. A comparison of pyogenic liver abscess in patients with or without diabetes: a retrospective study of 246 cases. BMC Gastroenterol.18, 144 (2018). - PMC - PubMed
    1. Song, H., Wang, X., Lian, Y. & Wan, T. Analysis of the clinical characteristics of 202 patients with liver abscess associated with diabetes mellitus and biliary tract disease. J. Int. Med. Res.48, 300060520949404 (2020). - PMC - PubMed
    1. Zhang, J. et al. Clinical features and prognosis of gas-forming and non-gas-forming pyogenic liver abscess: a comparative study. Surg. Infect. (Larchmt.)22, 427–433 (2021). - PubMed

MeSH terms

LinkOut - more resources