. 2025 Jul 1;10(1):51.
doi: 10.1038/s41525-025-00505-4.

Assessing the diagnostic impact of blood transcriptome profiling in a pediatric cohort previously assessed by genome sequencing

Affiliations

Assessing the diagnostic impact of blood transcriptome profiling in a pediatric cohort previously assessed by genome sequencing

Huayun Hou et al. NPJ Genom Med. .

Abstract

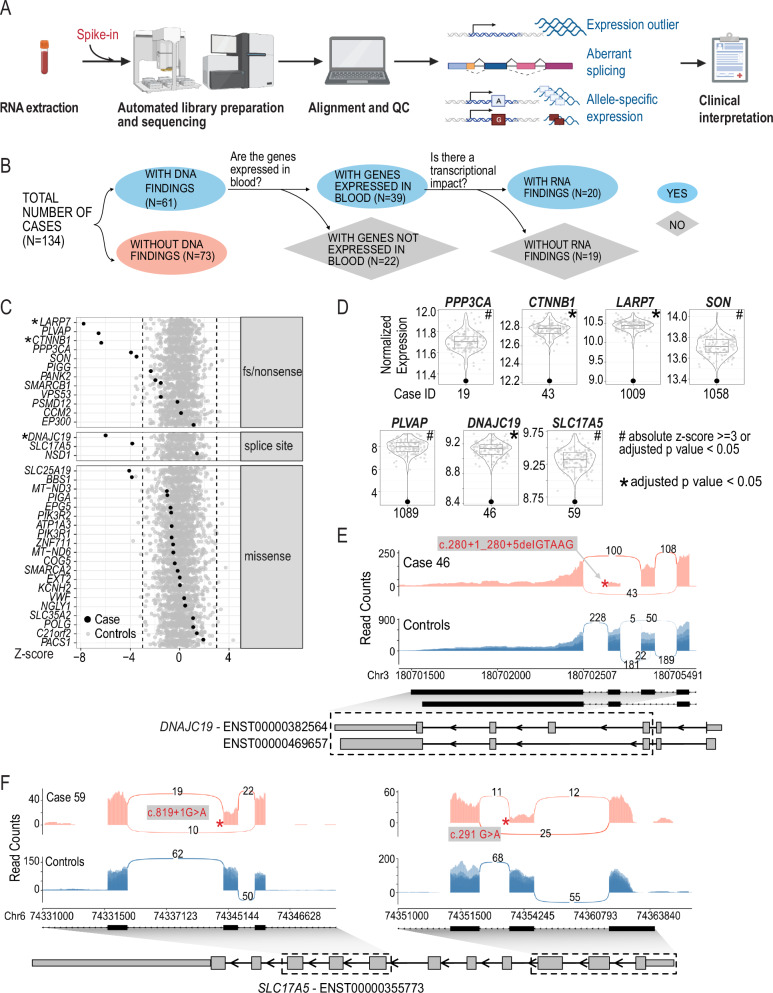
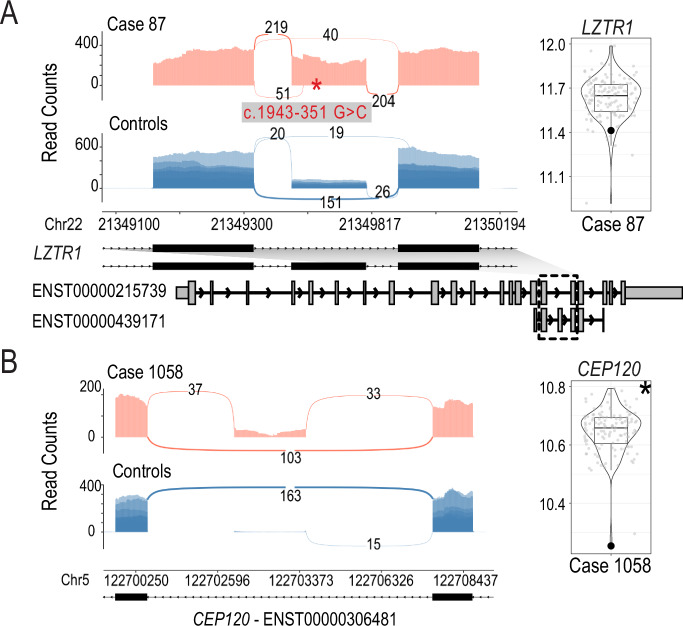
Despite advances in genome sequencing, many individuals with rare genetic disorders remain undiagnosed. Transcriptional profiling via RNA-seq can reveal functional impacts of DNA variants and improve diagnosis. We assessed blood-derived RNA-seq in the largely undiagnosed SickKids Genome Clinic cohort (n = 134), which has been subjected to multiple analyses benchmarking the utility of genome sequencing. Our RNA-centric analysis identifies gene expression outliers, aberrant splicing, and allele-specific expression. In one-third of diagnosed individuals (20/61), RNA-seq reinforced DNA-based findings. In 2/61 cases, RNA-seq revised diagnoses (EPG5 to LZTR1 in an individual with a Noonan syndrome-like disorder) and discovered an additional relevant gene (CEP120 in addition to SON in an individual with ZTTK syndrome). Additionally, ~7% (5/73) of undiagnosed cases had at least one plausible candidate gene identified. This study highlights both the benefits and limitations of whole-blood RNA profiling in refining genetic diagnoses and uncovering novel disease mechanisms.


Conflict of interest statement

Competing interests: MBrudno and DJS have equity in PhenoTips. SWS, RC, CRM and AS are affiliated with this journal as Editors or Editorial Board Members. These co-authors are not part of a peer review process or decision making of the manuscript. The other authors declare no competing interests.

Figures

Fig. 1
Fig. 1. Effects of pathogenic or likely pathogenic SNVs and indels on gene expression.
A RNA-seq-based clinical diagnosis workflow. B Flowchart showing the breakdown of samples. Created in BioRender. Wilson, M. (2025) https://BioRender.com/y35t706. C Detection of genes with diagnostic variants as expression outliers. Each row represents one gene. Each dot represents the z-scores of the corresponding gene in all samples. Black: cases in which the corresponding gene had a diagnostic variant; Grey: rest of the cohort as control samples. Asterisks indicate that the candidate gene is also detected as significant (adjusted p value < 0.05). Dashed lines indicated z-score of –3 or 3. Genes are separated into different panels based on the type of mutations they harbor. D Violin and boxplot showing normalized gene expression of selected candidate genes across the cohort. Y axis: log2 normalized read counts of the target gene in all samples in the cohort. Each dot represents one sample. Highlighted dot represents the case of interest. Case IDs are shown below each plot. The gene is considered an outlier in the analysis is designated by ‘#’ when absolute z-score >=3 or adjusted p value < 0.05) or by ‘*’ when the gene is detected as significant outlier with an adjusted p value < 0.05. E Impact of pathogenic variants in DNAJC19 on splicing and gene expression. F. Impact of pathogenic variants in SLC17A5 on splicing and gene expression. Sashimi plots show reads and junctions in the affected region for case (red track) and control samples (blue track, n = 10, randomly selected from the cohort) with the DNA variant labeled with an asterisk. Structures of relevant transcripts are shown with UTRs shown as thinner boxes. Only UTRs of transcripts annotated as “protein-coding” are shown. Exons shown in the sashimi plots are highlighted with a dashed box.
Fig. 2
Fig. 2. Modulation of gene expression by CNVs.
A Z-score summary of genes within pathogenic CNVs. Y axis: average z-score of genes in pathogenic CNVs. Each dot represents one sample. Red: sample in which the pathogenic CNV is detected. Genomic locations of CNVs are shown as panel headers and case IDs are shown below. B Z-scores of all genes on chromosome 22 in case 1034. An ideogram of human chromosome 22 is shown. The heterozygous deleted region is highlighted in grey. Gene start is used as the proxy for gene location. Genes with an absolute z-score >= 3 are highlighted in red. C Expression changes of genes within the CNV. Dot plots show z-scores and fold-changes of detected protein-coding genes within the deleted region. Color represents the expression level (log2 normalized counts) of genes in this sample. Genes are ordered by genomic coordinates.
Fig. 3
Fig. 3. Aberrant splicing events and expression of candidate genes identified using RNA-seq.
A. Violin and boxplot showing normalized gene expression of selected candidate genes across the cohort. Y axis: log2 normalized read counts of the target gene in all samples in the cohort. Each dot represents one sample. Highlighted dot represents the case of interest. Case IDs are shown below each plot. Number sign: the gene is considered an outlier in the analysis (absolute z-score >=3 or adjusted p value < 0.05); asterisk: the gene is detected as a significant outlier (adjusted p value < 0.05). B. Case 1035. Sashimi plot showing an increased exon usage event in NFIX in case (red track) and control samples (blue track, n = 10, randomly selected from the cohort). Bottom left: Structures of relevant transcripts. Exons shown in the sashimi plots are highlighted with a dashed box. Bottom right: Boxplot showing the percent isoform usage (“IsoPct” from RSEM output) of the corresponding transcript across the cohort. Each dot represents a sample. Isoform usage of the case is highlighted as a triangle. Only the transcripts detected in the case are shown. C Case 1085. Sashimi plot showing an intron retention event in PTK2B. The DNA variant is shown with an asterisk.
Fig. 4
Fig. 4. Aberrant splicing events and expression of candidate genes identified using RNA-seq.
A Case 87. Sashimi plot showing the inclusion of a rarely used exon within intron 16 in LZTR1 and violin plot showing the decreased expression of LZTR1. Models of relevant isoforms are shown below. B Case 1058. Sashimi plot showing an exon inclusion event in CEP120 and a violin plot showing decreased expression of CEP120.

Similar articles

  • Clinical applications of and molecular insights from RNA sequencing in a rare disease cohort.
    Stark JC, Pipko N, Liang Y, Szuto A, Tsoi CT, Dickson MA, Yuki KE, Hou H, Scholten S, Pulsifer K, Acker M, Laver M, Murthy H, Moran OM, Bonnell E, Liang N, Sidhu J, Dupuis L, Seno MMG; Care4Rare Canada Consortium; Chard M, Jobling RK, Cameron J, Chami R, Inbar-Feigenberg M, Wilson MD, Chitayat DA, Boycott KM, Kyriakopoulou L, Mendoza-Londono R, Marshall CR, Dowling JJ, Costain G, Deshwar AR. Stark JC, et al. Genome Med. 2025 Jul 1;17(1):72. doi: 10.1186/s13073-025-01494-w. Genome Med. 2025. PMID: 40597352 Free PMC article.
  • Signs and symptoms to determine if a patient presenting in primary care or hospital outpatient settings has COVID-19.
    Struyf T, Deeks JJ, Dinnes J, Takwoingi Y, Davenport C, Leeflang MM, Spijker R, Hooft L, Emperador D, Domen J, Tans A, Janssens S, Wickramasinghe D, Lannoy V, Horn SRA, Van den Bruel A; Cochrane COVID-19 Diagnostic Test Accuracy Group. Struyf T, et al. Cochrane Database Syst Rev. 2022 May 20;5(5):CD013665. doi: 10.1002/14651858.CD013665.pub3. Cochrane Database Syst Rev. 2022. PMID: 35593186 Free PMC article.
  • Uncommon Non-MS Demyelinating Disorders of the Central Nervous System.
    Mukherjee A, Roy D, Chakravarty A. Mukherjee A, et al. Curr Neurol Neurosci Rep. 2025 Jul 1;25(1):45. doi: 10.1007/s11910-025-01432-8. Curr Neurol Neurosci Rep. 2025. PMID: 40591029 Review.
  • Clinical and analytical validation of a combined RNA and DNA exome assay across a large tumor cohort.
    Yudina A, Tazearslan C, Baisangurov A, Nuzhdina E, Lauziere K, Segodin V, Podsvirova S, Starikov S, Chasse M, Shaposhnikov K, Kaneunyenye L, Klimchuk O, Kuzkina N, English N, Khegai G, Sookiasian D, Shafranskaya D, Fernandez D, Lozinsky Y, Sobolev A, Abdou M, Turova P, Chernyshov K, Efremov A, Andrewes S, Feinberg A, McKenna B, Brown JH, Love A, Curran J, Lennerz J, Bagaev A. Yudina A, et al. Commun Med (Lond). 2025 Jun 16;5(1):236. doi: 10.1038/s43856-025-00934-3. Commun Med (Lond). 2025. PMID: 40523952 Free PMC article.
  • Comprehensive mutational profiling identifies new driver events in cutaneous leiomyosarcoma.
    van der Weyden L, Del Castillo Velasco-Herrera M, Cheema S, Wong K, Boccacino JM, Offord V, Droop A, Jones DRA, Vermes I, Anderson E, Hardy C, de Saint Aubain N, Ferguson PM, Clarke EL, Merchant W, Mogler C, Frew D, Harms PW, Monteagudo C, Billings SD, Arends MJ, Ferreira I, Brenn T, Adams DJ. van der Weyden L, et al. Br J Dermatol. 2025 Jan 24;192(2):335-343. doi: 10.1093/bjd/ljae386. Br J Dermatol. 2025. PMID: 39392932

References

    1. Wojcik, M. H. et al. Genome sequencing for diagnosing rare diseases. N. Engl. J. Med.390, 1985–1997 (2024). - PMC - PubMed
    1. Wigby, K. M. et al. Evidence review and considerations for use of first line genome sequencing to diagnose rare genetic disorders. NPJ Genom. Med.9, 15 (2024). - PMC - PubMed
    1. Sullivan, J. A., Schoch, K., Spillmann, R. C. & Shashi, V. Exome/genome sequencing in undiagnosed syndromes. Annu. Rev. Med.74, 489–502 (2023). - PMC - PubMed
    1. Wai, H. A. et al. Blood RNA analysis can increase clinical diagnostic rate and resolve variants of uncertain significance. Genet. Med.22, 1005–1014 (2020). - PMC - PubMed
    1. Murdock, D. R. et al. Transcriptome-directed analysis for Mendelian disease diagnosis overcomes limitations of conventional genomic testing. J. Clin. Investig.131, e141500 (2021). - PMC - PubMed

LinkOut - more resources