. 2025 Jul 1;11(1):189.
doi: 10.1038/s41531-025-01040-w.

Enrichment of gut-derived metabolites in a Parkinson's disease subtype with REM sleep behavior disorder

Affiliations

Enrichment of gut-derived metabolites in a Parkinson's disease subtype with REM sleep behavior disorder

Sunjae Lee et al. NPJ Parkinsons Dis. .

Abstract

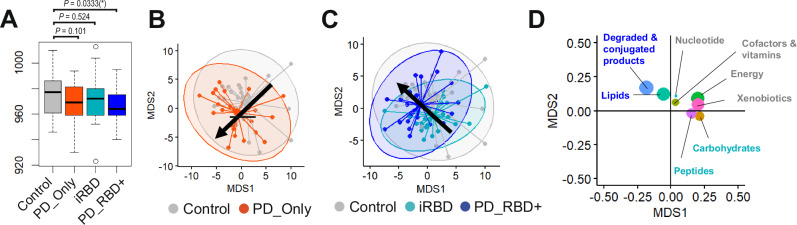
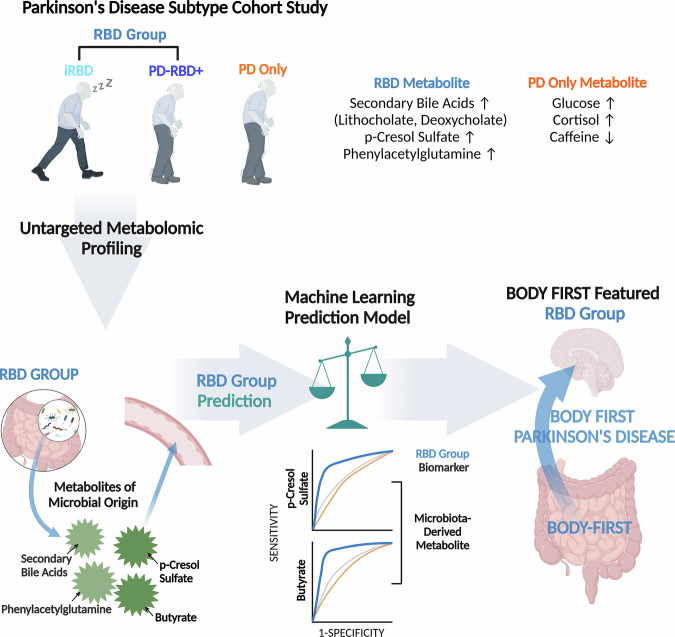
Recent reports indicate that Parkinson's disease (PD)-like changes in gut microbial signatures develop in idiopathic REM sleep behavior disorder (iRBD), a prodrome of α-synucleinopathies. However, <50% of PD cases exhibit RBD at onset, underscoring PD's heterogeneity. Using untargeted metabolomics, plasma samples from PD patients with and without RBD, iRBD subjects, and healthy controls were analyzed to characterize the metabolic differences in PD patients with and without RBD. Metabolomic analysis revealed the enrichment of gut microbial-origin metabolites, such as secondary bile acids and p-cresol sulfate, in PD patients with RBD, while metabolites linked to neuropsychiatric diseases were elevated in PD patients without RBD. Additionally, our prediction that p-cresol sulfate, enriched in the RBD groups with a gut microbial origin, crosses the blood-brain barrier, suggests a potential mechanistic link between gut microbial dysbiosis, iRBD, and PD with RBD. Our study elucidates the heterogeneous nature of PD subtypes.


Conflict of interest statement

Competing interests: The authors declare no competing interests.

Figures

Fig. 1
Fig. 1. Overview of the plasma metabolic features of cohorts.
A Number of annotated metabolites in each group based on untargeted metabolomics profiling. The control group (n = 24), Parkinson’s disease (PD)_Only group (n = 24), idiopathic rapid eye movement sleep behavior disorder (iRBD) group (n = 25), and PD with RBD (PD_RBD+) group (n = 25) are represented in gray, scarlet, turquoise, and blue, respectively. A decreasing trend in the average number of detected metabolites was observed among control, PD_Only, iRBD, and PD_RBD+. * P < 0.05. P-values were determined by Student’s t-tests. B Non-Metric Multidimensional Scaling (NMDS) plot comparing untargeted metabolomics profiles between the PD_Only and control groups. Centroids represent group means, with ellipses indicating group dispersion. PD_Only group exhibits a distinct metabolic shift, with low values both on Multidimensional Scaling (MDS)1 and MDS2 axes. C NMDS plot comparing untargeted metabolomics profiles between RBD groups (iRBD and PD_RBD+) and control groups. The PD_RBD+ group shows a distinct shift, characterized by higher values on the MDS2 axis and lower values on the MDS1 axis. D NMDS loading plot of metabolites, summarized by their respective metabolic pathways. Data are presented as box plots showing minimum, 25% quartile, median, 75% quartile, and maximum.
Fig. 2
Fig. 2. Metabolites discriminating patients with RBD and PD without RBD.
A Comparison of generalized fold changes of significantly altered metabolites (P < 0.05) from the PD_Only group, iRBD group, and PD_RBD+ group versus controls (Cont.). Pearson’s correlation coefficients (ρ) of generalized fold changes from the three groups versus controls were compared. Based on the correlation coefficients, we identified that metabolite alterations in iRBD group were highly correlated with those in PD_RBD+ group (ρ = 0.510; P = 7.48 × 10−6), which was not observed in other group comparisons. *** P < 0.001. B Generalized fold changes (FC) of metabolites significantly altered (P < 0.05) between RBD groups vs control, summarized by pathway classes (See details of statistics and P values in Supplementary Data S4). Metabolites corresponding to degraded/conjugated products and lipids are colored blue. C Generalized fold changes (FC) of metabolites significantly altered (P < 0.05) between PD_Only vs control, by pathway classes (See details of statistics and P values in Supplementary Data S1). Metabolites corresponding to xenobiotics, cofactors/vitamins, and energy metabolites are colored red.
Fig. 3
Fig. 3. Characterizations of significantly enriched metabolites in RBD (iRBD and PD_RBD+) group and PD_Only group.
A Relative abundance level of cortisol in different groups - a metabolite significantly enriched in PD_Only group (POM). B Relative abundance level of p-cresol level in different groups - a metabolite significantly enriched in RBD group (RM). C Relative abundance level of Glutamate level in different groups - a metabolite significantly enriched in both RBD group and PD_Only group. Statistical significances and confidence intervals were calculated based on student’s t-test between two different clinical groups on this plot. D Significantly enriched known biospecimen type based on Human Metabolome Database (HMDB) annotations (Hypergeometric test P values < 0.05). RBD metabolites (RM) were significantly enriched among feces metabolites, whereas PD_Only metabolites (POM) were significantly enriched among saliva, sweat, and CSF metabolites (See P-values and other details in Supplementary Data S8). E Significantly enriched the origins of metabolites based on Human Metabolome Database (HMDB) annotations (Hypergeometric tests P < 0.05). RBD metabolites (RM) were significantly enriched among microbial metabolites (See P-values and other details in Supplementary Data S7). F Significantly enriched disease metabolites of given RBD metabolites (RM) (P < 0.05) (See P values and other details in Supplementary Data S11). Statistical significance (hypergeometric tests P values) and fraction of shared RM metabolites with disease metabolites (shared ratio) were shown by color scales and circle sizes. G Significantly enriched disease metabolites of given PD_Only metabolites (POM) (P < 0.05) (See P values and other details in Supplementary Data S10). Statistical significance (hypergeometric tests P-values) and fraction of shared RM metabolites with disease metabolites (shared ratio) were shown by color scales and circle sizes. *P < 0.05, **P < 0.01.
Fig. 4
Fig. 4. Evaluation of logistic regression models using PD_Only metabolites (POM) and RBD metabolites (RM) for the classification of clinical groups.
Performance of logistic regression models using most discriminative markers of (A) three PD_Only metabolites (PM)—glucose, cortisol, sphingomyelin to classify between two different clinical groups as PD model and (B) three RBD metabolites (RM)—butyrate, p-cresol sulfate, and hydrocinnamate to classify between two different clinical groups as RBD model. In the model, age and sex were considered as covariates. Color coding for group comparisons: gray - control vs. any PD cases; scarlet - control vs. PD_Only; cyan - control vs. any RBD case; blue - control vs. PD_RBD + .
Fig. 5
Fig. 5. Schematic illustration of plasma metabolic profiles in PD subtypes based on RBD.
This figure illustrates the plasma metabolic profiles observed in PD subtypes, categorized by the presence or absence of RBD, utilizing an untargeted metabolomics approach. Across PD cases with and without RBD, elevated levels of secondary bile acids, p-cresol sulfate, phenylacetylglutamine, and cortisol, alongside decreased caffeine, were identified, consistent with previously reported PD-associated metabolites. However, upon closer examination focusing on the presence of RBD, a significant divergence was noted. Specifically, secondary bile acids, p-cresol sulfate, and phenylacetylglutamine—metabolites originating from gut microbial activity—were distinctly evident in PD cases with RBD but absent in those without RBD. This finding suggests a potential association between PD subtypes characterized by RBD as a “body-first” type PD. Figure 5 was created using www.biorender.com.

Similar articles

References

    1. Morris, H. R., Spillantini, M. G., Sue, C. M. & Williams-Gray, C. H. The pathogenesis of Parkinson’s disease. Lancet403, 293–304 (2024). - PubMed
    1. Berg, D. et al. Prodromal Parkinson disease subtypes - key to understanding heterogeneity. Nat. Rev. Neurol.17, 349–361 (2021). - PubMed
    1. Braak, H. et al. Staging of brain pathology related to sporadic Parkinson’s disease. Neurobiol. Aging24, 197–211 (2003). - PubMed
    1. Horsager, J. et al. Brain-first versus body-first Parkinson’s disease: a multimodal imaging case-control study. Brain143, 3077–3088 (2020). - PubMed
    1. Cersosimo, M. G. & Benarroch, E. E. Pathological correlates of gastrointestinal dysfunction in Parkinson’s disease. Neurobiol. Dis.46, 559–564 (2012). - PubMed

LinkOut - more resources