. 2025 Jul 1;11(1):67.
doi: 10.1038/s41540-025-00545-7.

Temporal analysis of doxorubicin-induced cardiac toxicity and hypertrophy

Affiliations

Temporal analysis of doxorubicin-induced cardiac toxicity and hypertrophy

Yu-Te Lin et al. NPJ Syst Biol Appl. .

Abstract

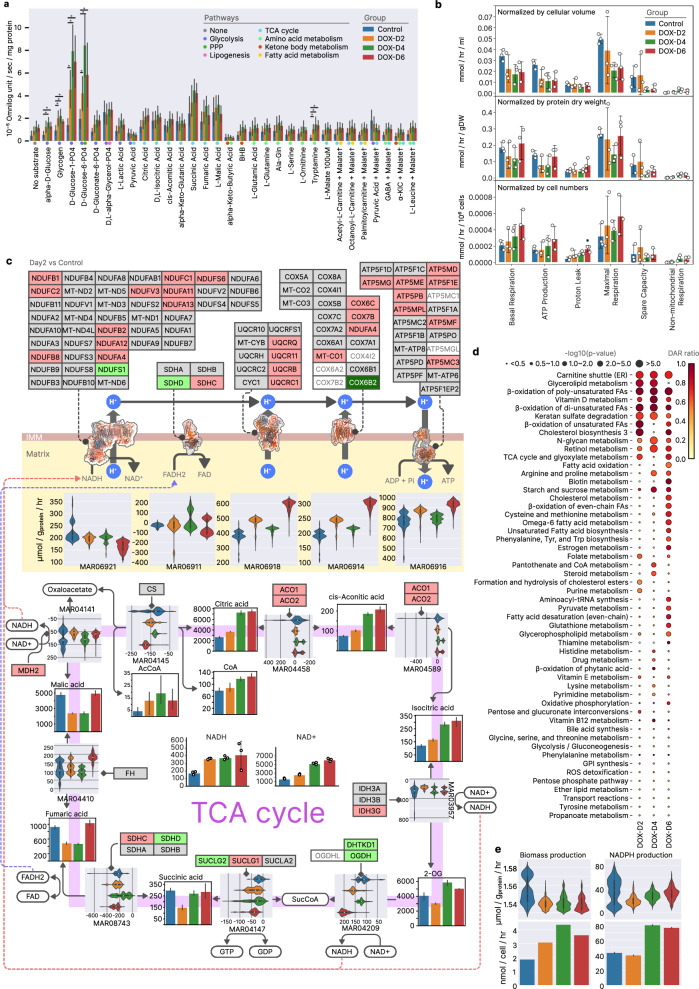
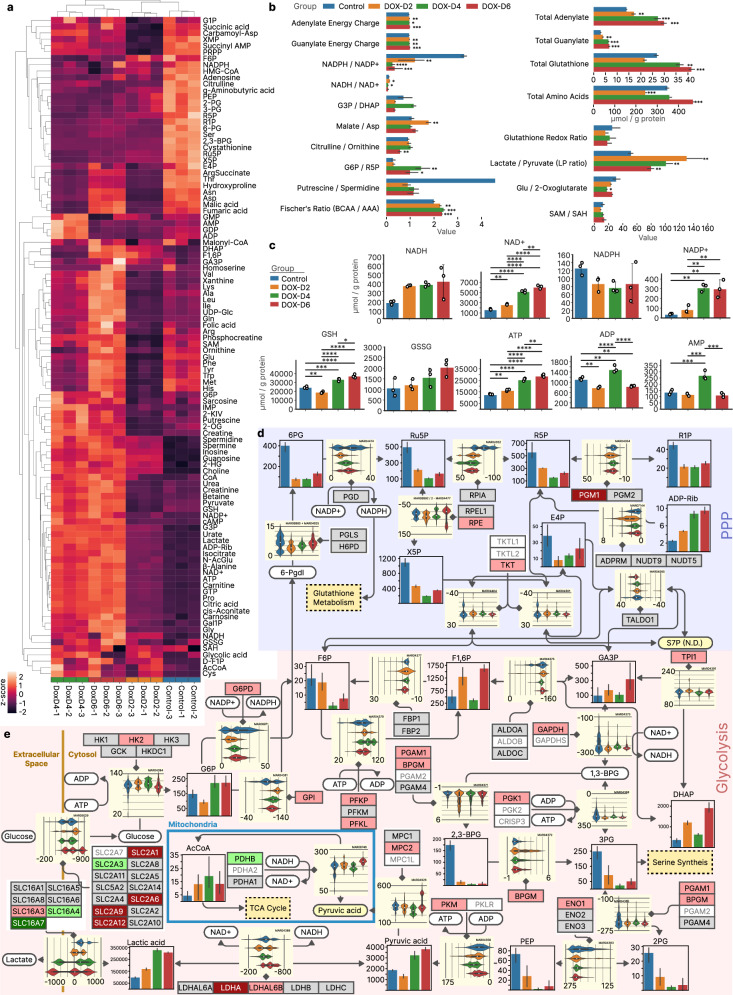
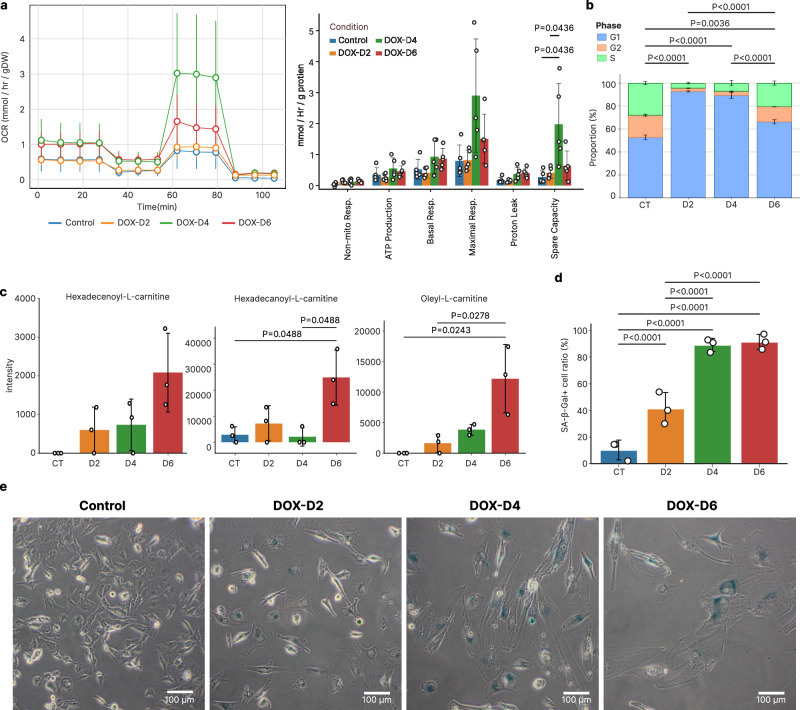
Doxorubicin (DOX), although effective in treating cancer, has significant cardiac side effects, which limit its clinical utility. In this study, we collected time-course transcriptomics and metabolomics data from the human cardiomyocyte cell line AC16, which we analyzed along with curated public transcriptomics data on DOX-induced toxicity. We developed a multiomics analysis workflow and a computational toolbox, pipeGEM, to integrate RNA-seq data with metabolic models, enabling the simulation of DOX-induced metabolic perturbations at a sample-specific level. Our results revealed that DOX affected mitochondrial damage and mitochondria-to-nucleus retrograde signaling, potentially contributing to the observed cellular enlargement, senescence and metabolic shift. Cardiac cells that survived DOX treatment presented elevated glycolysis, increased pentose phosphate pathway activity, an altered TCA cycle, and modified glutathione and fatty acid metabolism. These findings provide a comprehensive understanding of DOX-induced toxicity and its implications for cardiac hypertrophy, suggesting potential strategies to mitigate side effects while retaining the anticancer efficacy of DOX.


Conflict of interest statement

Competing interests: The authors declare no competing interests.

Figures

Fig. 1
Fig. 1. AC16 cells exposed to DOX exhibit morphological and cellular stress level alterations.
a Drug screening results showing changes in the mitochondrial potential caused by 23 distinct compounds (n = 6 for each concentration) and controls (no drug treatment) (n = 40 plates of cells). The y-axis represents the normalized mitochondrial membrane potential estimated from confocal images. The values were normalized to the mean values of the control samples from the same experimental batch. The subtitles indicate the drugs, and the x-axis denotes concentrations. The minimum, low, moderate, and high concentrations of drugs were derived from MitoPlate I-1 assays. Notably, the MitoPlate I-1 assay does not provide absolute concentrations but instead establishes a predefined order of concentrations (minimum, low, moderate, and high). This hierarchical arrangement facilitates comparative analysis across treatments under standardized experimental conditions. To compare the treated groups with the controls, we performed one-way ANOVA on each drug-treated group, followed by Student’s t test. The data points shown are measured values from distinct wells. b Confocal images showing the size increases caused by DOX. DOX caused observable size and structural changes. DOX-D2, DOX-D4, and DOX-D6 refer to AC16 cells treated with 0.1 µM DOX for 2, 4, and 6 days, respectively. c AC16 cells treated with DOX had decreased cell viability (n = 3 per group, except for the DOX-D6 group, which had n = 4). d Increased ROS levels (n = 3 per group) over time. The cell viability values were normalized to the control values, which were obtained on the same date. Bar heights are means, with error bars denoting SD values. P values were obtained via Tukey’s multiple comparison tests following a significant two-tailed one-way ANOVA result (P < 0.05). The DOX-D1 group was treated with DOX for 24 h. e DOX treatment caused increased mtDNA copy numbers (left) (n = 4 plates of cells per group) and f decreased TMRM intensities (right) (n = 3 cells per group). g Mitochondrial morphology analysis results. DOX led to elevated total counts and areas of mitochondria per cell in AC16 cells. The data points are the mean values of the cells on the same plates. P values were obtained from t tests as multiple comparison tests following a significant two-tailed one-way mixed-design ANOVA result (P < 0.05). h Nucleus and cell area of the adherent AC16 cells estimated via confocal microscopy. DOX exposure significantly increased the number of AC16 cells. Each data point represents the mean value of the cells cultured on the same plate. P values were obtained via t tests for multiple comparisons following a significant two-tailed one-way mixed-design ANOVA result (P < 0.05). i, j Computer simulations of cardiomyocytes with and without doxorubicin treatment. The simulation revealed that the cellular membrane potential, mitochondrial membrane potential (ΔѰm), and oxygen consumption rate decreased ~740 s after the 260 μM DOX treatment. The different colors represent different conditions. The orange lines represent the prediction results for cardiomyocytes treated with 260 μM DOX, the blue lines represent cardiomyocytes treated with 250 μM DOX for 0 s, and the blue lines represent the controls. DOX effects were simulated by decreasing complex I and III activities and enhancing redox cycling in complex I. The significance levels of the subplots are as follows: ****P < 0.0001, ***P < 0.001, **P < 0.01, and *P < 0.05. The heights of the bar plots are the means, and the error bars represent the standard deviation (SD) values.
Fig. 2
Fig. 2. Scheme of the study design and workflow for transcriptomic and metabolomic analyses.
a RNA sequencing. The raw sequencing data from AC16 cells and publicly available datasets were aligned to the human reference genome. The public datasets included samples from normal tissues or cells treated with DOX. We then used the gene counts to perform RNA-seq analysis and metabolic model simulation. b RNA-seq analysis. We used the gene expression data to identify DEGs and subsequently performed functional and pathway analyses to identify the DOX-affected pathways. c GEM reconstruction and simulation. By integrating the RNA-seq data and a human metabolic model, we obtained a sample-specific GEM for each sample. These models were used to simulate metabolic fluxes and gene knockout effects, suggesting the occurrence of DOX-induced metabolic alterations between the groups. The figure was created using BioRender.com.
Fig. 3
Fig. 3. DOX treatment of AC16 cells for different durations resulted in transcriptomic differences.
a Bubble plots showing the most significant DEGs with the greatest differences between DOX-D2 (right), DOX-D4 (middle), and DOX-D6 (left) and the control (n = 3 per condition). The colors are log2-fold changes, and the sizes of the dots represent negative log10-transformed adjusted P values. b A PPI subnetwork generated from DOX-D6 DEGs. c Bar plots showing enrichment analysis results for upregulated (left) and downregulated DEGs (right) in the DOX-treated samples compared with the control samples. d GSEA results split into pathways with NES > 0 (left) and NES < 0 (right). e Bar plots showing the IPA results of the upregulated (left) and downregulated DEGs (right). f Enrichment analysis results of the PPI nodes constructed from the identified DEGs. g Enrichment analysis (left) and GSEA results (right) for public studies. This panel illustrates the results of overlapping enrichment analysis (left) and GSEA (right) based on DEGs identified from RNA-seq data obtained from various public studies. The studies are categorized into three groups: cultured cardiac cells, heart tissue, and other noncardiac cells. In the left panel, common significant pathways identified through enrichment analysis within each group are displayed. Dot sizes represent the frequency of pathway occurrences in the analysis results, whereas the x-axis indicates the median −log10 adjusted P values of the pathways. The colors differentiate pathways identified through downregulated DEGs (blue) and upregulated DEGs (red). The right panel shows the median NES values from the GSEA results, with positive NES values in red and negative NES values in blue. The x-axis represents the median −log10 adjusted P values of the pathways. Pathways with lengthy descriptions are abbreviated using database IDs and keywords, as detailed in the source data.
Fig. 4
Fig. 4. Meta-analysis and sample-specific metabolic models generated from public transcriptomic datasets.
a Boxplots showing the percentiles of the fitted thresholds for fitting two Gaussian distributions for the RAN-seq data and constructing genome-scale metabolic network models. The expression thresholds are in the 90th and 50th percentiles, and the nonexpression thresholds are between the 50th and 5th percentiles. b The probability distribution of the logTPM values and the fitted thresholds of a sample in our RNA-seq data (one sample obtained from the DOX-D6 group). This is an example showing how the thresholds were fitted. c PCA results indicating model component similarity between context-specific models. The colors represent the groups (left) and cell lines (right) of the samples. VSMC: vascular smooth muscle cell; SI: small intestine. d Volcano plot showing the fold changes (x-axis) and -log-transformed p values (y-axis) of the task scores calculated using the control (n = 143) and DOX models (n = 221). e Venn diagrams showing the number of key metabolic genes found in the knockout analysis. The diagrams on the left show the numbers of common key metabolic genes found in the models of cultured cardiac cells, cardiac organoids (S-HECA10), and heart tissue samples (GSE193861 and S-HECA469) with or without DOX treatment. Light green, purple, and light blue represent the genes found in both the control and DOX-treated models. The numbers of these genes are presented in the three-set Venn diagram on the top right, which shows that 15 genes are found in all the context-specific models. Yellow, red, and dark green represent the key genes found only in the DOX models, with the numbers also presented in the bottom right Venn diagram. f DAR-enriched metabolic pathways identified via the simulated flux results. The x-axis represents the comparisons between the DOX and control groups in each study, whereas the y-axis represents the metabolic pathways in the GEMs. The colors of the circles represent the significance (-log10 of the adjusted p value) derived from a hypergeometric test, and the sizes indicate the ratio of DARs identified in the pathways.
Fig. 5
Fig. 5. Metabolic flux measurement and simulation of the sample-specific GEMs reconstructed from AC16 cell RNA-seq data.
a Rates of electron flow in the electron transport chain from different metabolic substrates that produce NADH and FADH2. Slopes of MitoPlate S-1 substrate utilization indicating the relative amount of reduced cytochrome c subjected to different treatments (colors) and added substrates (x-axis). The colors of the dots represent the pathways in which the substrates are involved. The data are presented as the means ± standard deviations. P values were obtained via t tests to compare the DOX and control samples following a significant two-tailed one-way ANOVA result (P < 0.05). Significance levels: *P < 0.05. b Cellular respiration and oxygen consumption rates. Mitochondrial metabolic parameters were inferred from the oxygen consumption rates measured by O2K high-resolution respirometry. The parameters were normalized on the basis of estimated cell volume (top), cell dry weight (middle) and cell number (bottom). While AC16 cells treated with DOX presented a greater OCR than the controls did, a different trend was observed for the parameters normalized by the dry weight of the cells. This observation suggests that DOX may impede the aerobic respiration ability of cells. Notably, the cells treated with DOX were enlarged, particularly those subjected to prolonged DOX treatment. Each data point shown is an estimated value inferred from an OCR experiment. c Gene expression levels, metabolite concentrations, and predicted fluxes. This figure illustrates the genes, metabolites, and reactions involved in oxidative phosphorylation (top) and the TCA cycle (bottom). The colored rectangles represent metabolic genes: light green indicates downregulated genes (adjusted P < 0.05 and −1 < log2FC < −0.3), pink indicates upregulated genes (adjusted P < 0.05 and 1 > log2FC > 0.3), dark green indicates downregulated DEGs, white indicates genes with minimal expression values (base mean < 30 or one sample has zero value), and gray indicates unchanged genes (none of the above conditions are met). All P values and log2FC values were derived from DGE analysis of the DOX-D2 samples compared with the controls. The plots with violin graphs display the sampled fluxes, with flux values in μmol/gram of protein/hour. The arrows below these plots indicate the reaction directions. The bar plots show substrate concentrations obtained and normalized from CE-MS metabolomics data (unit: nmol/gram of protein). The colors of the violin and bar plots represent different groups: blue for the control, orange for DOX-D2, green for DOX-D4, and red for DOX-D6. d Bubble plot presenting the metabolic pathway analysis results. The bubble sizes indicate -log10 (adjusted P values), and the colors denote the DAR ratio, which is the ratio of DARs to all reactions in the given pathways (Y-axis). The left column shows pathway results using DARs between the DOX-D2 and control samples, the middle column compares the DOX-D4 and control samples, and the right column displays pathway results using the DARs between the DOX-D6 and control samples. e Predicted metabolic fluxes for biomass and NADPH production. The violin plots (top) show sampled fluxes normalized by protein weight, whereas the bar plots (bottom) display fluxes normalized by cell number (n = 1500 per group). The error bars represent 95% confidence intervals. These results suggest that the metabolic capacity per protein weight may differ from that per cell.
Fig. 6
Fig. 6. Metabolomics data and predicted metabolic fluxes.
a Heatmap and hierarchical clustering of the measured metabolite concentrations in the AC16 samples (n = 3 per group) subjected to different treatments. The heatmap colors represent the z scores calculated for the substrates. The bottom colors are the groups of the samples (blue: control; orange: DOX-D2; green: DOX-D4; red: DOX-D6). b Metabolic parameters derived from raw metabolomics data. The data are presented as the means ± SDs. P values were obtained from multiple comparison t tests following a significant two-tailed one-way ANOVA result (P < 0.05). Significance levels: ****P < 0.0001, ***P < 0.001, **P < 0.01, and *P < 0.05. c Absolute concentration (nmol/gram protein dry weight) of energy transfer cofactors and redox cofactors measured by capillary electrophoresis mass spectrometry. The data are presented as the means ± SDs. The data points were measurements of the samples (n = 3 per group). P values were obtained from t tests as multiple comparison tests following a significant two-tailed one-way ANOVA result (P < 0.05). d Pentose phosphate pathway (PPP) and e glycolysis pathway. The subplots in (d) and (e) illustrate metabolite concentrations measured by capillary electrophoresis mass spectrometry (bar plots), metabolic fluxes predicted by pipeGEM (violin plots), and gene expression changes from the RNA-seq data (rectangular boxes). Bar plots display absolute substrate concentrations (nmol/gram protein dry weight), with bar heights representing the mean and error bars indicating SDs. Sample groups are color-coded (blue: control; orange: DOX-D2; green: DOX-D4; and red: DOX-D6). Unmeasured substrates such as glucose, 6-PGDL (D-Glucono-1,5-lactone 6-phosphate), and 1,3-BPG are depicted as white rounded rectangles. The arrows on the edges represent chemical reactions and their directions. Violin plots indicate the predicted fluxes of these reactions, with the flux units (μmol/gram protein dry weight/hour) labeled. Negative values signify reversed reaction directions because of their bidirectional nature. The colored rectangles linking the flux plots correspond to the subunits or isozymes that regulate the reactions. Dark red and dark green indicate upregulated and downregulated DEGs, respectively, in the DOX-D2-treated group compared with the control group. Pink and light green indicate genes with P < 0.05 and logFCs between 1 and 0.3 (pink) or between −1 and −0.3 (green), respectively. White indicates genes with nearly absent raw counts (base mean < 30), whereas gray indicates none of the above.
Fig. 7
Fig. 7. DOX-induced metabolic changes predicted via GEMs and captured in the metabolomics data.
a Randomly sampled OXPHOS fluxes in GEMs normalized to the number of cells in the control (blue), DOX-D2 (orange), DOX-D4 (green), and DOX-D6 (red) groups. b Venn diagram showing the intersections of important metabolic genes predicted via sample-specific GEMs. The yellow boxes indicate some of the genes that are exclusively important for DOX-D2 (left) and DOX-D4&D6 (right). The gray boxes list the metabolic pathways in which these genes are involved. The percentages are the proportions of how many genes are associated with the pathways. In this figure, DOX-D4 & DOX-D6 represent the merged gene data from these two groups, reflecting the effects of mid- to long-term DOX toxicity on cardiac cells (Supplementary Fig. 9). c Volcano plots showing metabolite fold changes and adjusted p values of the DOX-D2 (left) or DOX-D4 and DOX-D6 (right) samples compared with the control samples. The green circles indicate significantly decreased metabolites, and the yellow circles indicate significantly increased metabolites. Similar to (b), the DOX-D4 and DOX-D6 data were merged to represent their combined metabolomic profiles, as these two groups presented similar metabolite concentrations. d Pathway analysis performed using the significantly changed metabolites identified in (c). Pathway impact, the x-axis, was assessed by calculating the ratio of the summed importance measures of the matched metabolites to the total importance measures of all the metabolites in the pathway. Importance was determined using MetaboAnalyst, which uses the relative betweenness centrality and out-degree centrality in directed metabolic pathway networks. The y-axis is the −log(P value) obtained from a hypergeometric test. The left image shows the perturbed DOX-D2 substrates (increased and decreased), and the right image shows the altered DOX-D4 and DOX-D6 substrates.
Fig. 8
Fig. 8. DOX affects respiration and fatty acid metabolism in AC16 cells and causes cell cycle arrest and senescence.
a Seahorse analyzer-measured OCR values (left) and the mitochondrial parameters (right) inferred from the data. N = 4 or 5. The error bars represent the standard deviations. b A bar chart showing the proportions of cells in the G1, G2, and S phases in the control and DOX-treated groups. A lower proportion of cells in the G2 and S phases was observed in the DOX-D2 (G2: 2.71 ± 0.25%, S-phase: 4.53 ± 0.79%), DOX-D4 (G2: 3.47 ± 0.34%, S-phase: 7.25 ± 2.34%), and DOX-D6 conditions (G2: 13.18 ± 0.10%, S-phase: 20.59 ± 1.84%) than in the control conditions (G2: 19.29 ± 0.85%, S-phase: 28.00 ± 1.40%). Each data point represents the cells in one culture plate (n = 3 per group). The P value in the figure was obtained from Tukey’s test of the proportions of cells in the S phase following a significant two-tailed mixed-design one-way ANOVA (P < 0.05). c Nontargeted metabolomic profiling results showing the relative carnitine concentrations in the DOX-treated and control samples. d Percentages of positive senescent cells detected in (e). Data points represent the mean percentages of positive cells in the three confocal images of the culture plates. CT: control; D2: DOX-D2; D4: DOX-D4; and D6: DOX-D6. In the figure, P values were obtained from Tukey’s multiple comparison tests following a significant two-tailed mixed-design one-way ANOVA test result (P < 0.05). e Images of senescent cells. The blue area indicates β-galactosidase activity, which is present in senescent cells.
Fig. 9
Fig. 9. Potential progression of cardiotoxicity induced by high- and low-dose DOX treatment.
a This figure illustrates the possible progression of drug-induced cardiotoxicity (DIC) based on our in vitro and in silico experiments. Our hypothesis suggests that cardiac cells with healthy mitochondria are more resistant to DOX, while those with a higher proportion of damaged mitochondria are more susceptible. High-dose DOX treatment results in increased apoptosis and oxidative stress, leading to cell death in both resistant and susceptible cells. In contrast, cells treated with a lower dose of DOX survive longer. In susceptible cells, DOX treatment reduces energy production, increases apoptosis, and induces inflammation. Resistant cells, on the other hand, maintain higher energy production through enhanced electron transport chain (ETC) activity and glycolysis, leading to a reduced apoptosis rate and improved survival. However, surviving cells, regardless of resistance, develop inflammation, hypertrophy, fibrosis, and senescence. b The biological pathways affected in cardiac cells by DOX treatment. The increase or decrease of these pathways is inferred from biological evidence and computational model simulations.
Fig. 10
Fig. 10. Pathways associated with DOX-induced cardiotoxicity.
This graph illustrates the signaling (blue rectangles) and metabolic pathways (purple rectangles) potentially associated with DOX-induced cardiotoxicity. These pathways can increase (black arrows) or inhibit (red dashed lines) various biological processes (red rounded rectangles), such as oxidative stress, calcium release, fibrosis, inflammation, and apoptosis. Ligands (green rounded rectangles) may bind to receptors (light blue) on the cell membrane, activating signaling processes.

Similar articles

References

    1. Davies, K. J. & Doroshow, J. H. Redox cycling of anthracyclines by cardiac mitochondria. I. Anthracycline radical formation by NADH dehydrogenase. J. Biol. Chem.261, 3060–3067 (1986). - PubMed
    1. Doroshow, J. H. & Davies, K. J. Redox cycling of anthracyclines by cardiac mitochondria. II. Formation of superoxide anion, hydrogen peroxide, and hydroxyl radical. J. Biol. Chem.261, 3068–3074 (1986). - PubMed
    1. Larsen, R. L. et al. Electrocardiographic changes and arrhythmias after cancer therapy in children and young adults. Am. J. Cardiol.70, 73–77 (1992). - PubMed
    1. Steinberg, J. S., Cohen, A. J., Wasserman, A. G., Cohen, P. & Ross, A. M. Acute arrhythmogenicity of doxorubicin administration. Cancer60, 1213–1218 (1987). - PubMed
    1. Von Hoff, D. D. et al. Risk factors for doxorubicin-induced congestive heart failure. Ann. Intern. Med.91, 710–717 (1979). - PubMed

LinkOut - more resources