

Exenatide and glucagon co-infusion increases myocardial glucose uptake and improves markers of diastolic dysfunction in adults with type 2 diabetes
- PMID: 40593987
- PMCID: PMC12217732
- DOI: 10.1038/s41598-025-04559-3
Exenatide and glucagon co-infusion increases myocardial glucose uptake and improves markers of diastolic dysfunction in adults with type 2 diabetes
Abstract
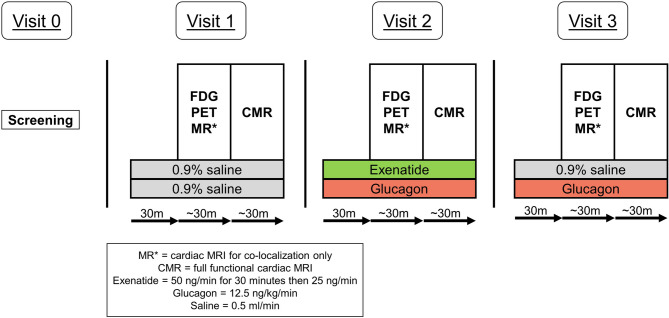
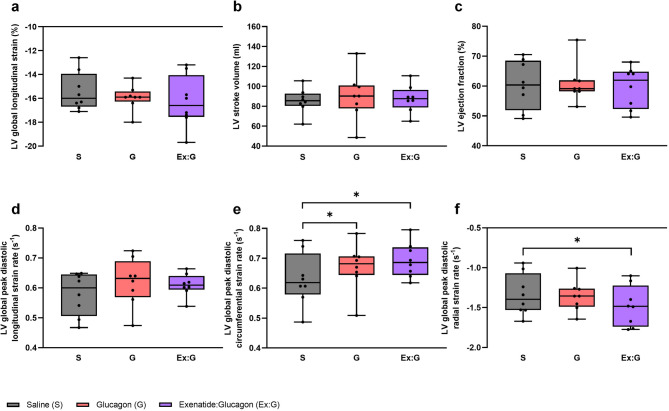
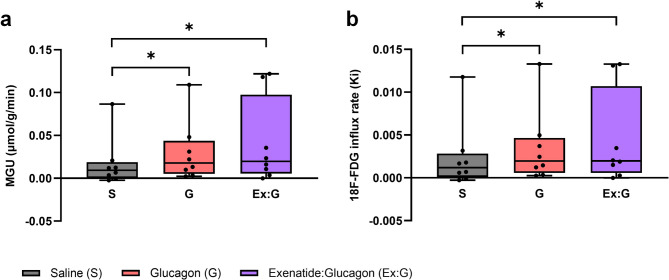
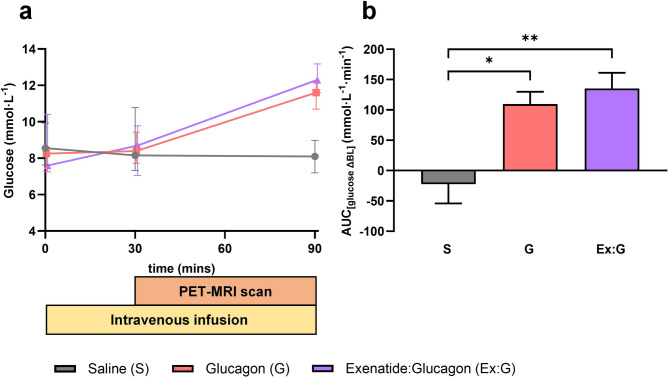
Type 2 diabetes (T2D) significantly increases the risk of heart failure, a major cause of hospitalisation and increased morbidity and mortality. Dual and multi-agonist synthetic peptides at the GLP-1 and glucagon receptor are in clinical development as potential new treatments for a range of chronic metabolic conditions including T2D. Here, we aimed to explore the effects of GLP-1 and glucagon dual receptor agonism on myocardial glucose uptake (MGU) and myocardial function in T2D. Eight adults with a mean age of 52 ± 12 years and body mass index 31 ± 4 kg/m2 attended three randomised infusion visits using combinations of 0.9% saline, glucagon (12.5 ng/kg/min) and exenatide:glucagon co-infusion (exenatide loading dose 50 ng/min for 30 min then 25 ng/min). MGU and myocardial function were assessed using 18F-FDG PET-MRI. MGU increased in n = 7/8 (88%) participants from a median of 9.2 × 10⁻³ µmol/g/min (IQR 0.33-19 × 10-3 µmol/g/min) with saline, to 20 × 10-3 µmol/g/min (5.4-98 × 10-3 µmol/g/min) with exenatide:glucagon, n = 8, z = 2.24, r = 0.79, P < 0.05. Exenatide:glucagon significantly increased the median left ventricular global peak diastolic circumferential strain rate from 0.619 1/s (0.580-0.716 1/s) to 0.686 1/s (0.644-0.737 1/s) n = 8, z = 2.37, r = 0.84, P < 0.05. Left ventricular global longitudinal contraction (as a measure global longitudinal strain) numerically increased by 0.6%, from - 16.0% with saline (-14.0-[-16.7]%) to -16.6% with exenatide:glucagon (-14.1-[-17.6]%), n = 8, z=-1.54, r=-0.54, P = 0.123. Further studies are required to explore whether GLP-1/glucagon dual receptor agonists have a role to play in reducing cardiovascular risk and attenuating heart failure related outcomes in patients with chronic metabolic conditions such as T2D.
Keywords: 18F-FDG; CMR; Cardiac MRI; Dual-agonism; GLP-1; GLP-1/glucagon; Glucagon; Myocardial glucose uptake; PET MRI.
© 2025. The Author(s).
Conflict of interest statement
Declarations. Competing interests: PA and LJ are employees and shareholders of AstraZeneca. All the remaining authors declare no conflict of interest.
Figures
Similar articles
-
Dipeptidyl-peptidase (DPP)-4 inhibitors and glucagon-like peptide (GLP)-1 analogues for prevention or delay of type 2 diabetes mellitus and its associated complications in people at increased risk for the development of type 2 diabetes mellitus.Cochrane Database Syst Rev. 2017 May 10;5(5):CD012204. doi: 10.1002/14651858.CD012204.pub2. Cochrane Database Syst Rev. 2017. PMID: 28489279 Free PMC article.
-
Newer agents for blood glucose control in type 2 diabetes: systematic review and economic evaluation.Health Technol Assess. 2010 Jul;14(36):1-248. doi: 10.3310/hta14360. Health Technol Assess. 2010. PMID: 20646668
-
Efficacy and safety of long-acting glucagon-like peptide-1 receptor agonists compared with exenatide twice daily and sitagliptin in type 2 diabetes mellitus: a systematic review and meta-analysis.Ann Pharmacother. 2011 Jul;45(7-8):850-60. doi: 10.1345/aph.1Q024. Epub 2011 Jul 5. Ann Pharmacother. 2011. PMID: 21730278
-
Effects of glucagon-like peptide-1 receptor agonists on weight loss: systematic review and meta-analyses of randomised controlled trials.BMJ. 2012 Jan 10;344:d7771. doi: 10.1136/bmj.d7771. BMJ. 2012. PMID: 22236411 Free PMC article.
-
Emergence of a New Glucoregulatory Mechanism for Glycemic Control With Dapagliflozin/Exenatide Therapy in Type 2 Diabetes.J Clin Endocrinol Metab. 2023 Dec 21;109(1):161-170. doi: 10.1210/clinem/dgad438. J Clin Endocrinol Metab. 2023. PMID: 37481263 Free PMC article.
References
-
- Mudaliar, S., Alloju, S. & Henry, R. R. Can a shift in fuel energetics explain the beneficial cardiorenal outcomes in the EMPA-REG OUTCOME study?? A unifying hypothesis. Diabetes Care. 39, 1115–1122. 10.2337/dc16-0542 (2016). - PubMed
-
- Stanley, W. C., Recchia, F. A. & Lopaschuk, G. D. Myocardial substrate metabolism in the normal and failing heart. Physiol. Rev.85, 1093–1129. 10.1152/physrev.00006.2004 (2005). - PubMed
-
- Lopaschuk, G. D., Ussher, J. R., Folmes, C. D. L., Jaswal, J. S. & Stanley, W. C. Myocardial fatty acid metabolism in health and disease. Physiol. Rev.90, 207–258. 10.1152/physrev.00015.2009 (2010). - PubMed
-
- Heather, L. C. & Clarke, K. Metabolism, hypoxia and the diabetic heart. J. Mol. Cell. Cardiol.50, 598–605. 10.1016/j.yjmcc.2011.01.007 (2011). - PubMed
-
- Succurro, E. et al. Reduction in global myocardial glucose metabolism in subjects with 1-Hour postload hyperglycemia and impaired glucose tolerance. Diabetes Care. 43, 669–676. 10.2337/dc19-1975 (2020). - PubMed
Publication types
MeSH terms
Substances
Grants and funding
- RG98920, RG78426, RCAG/975 and RCZA/053/University of Cambridge-AstraZeneca Experimental Medicines Training Initiative
- RG98920, RG78426, RCAG/975 and RCZA/053/University of Cambridge-AstraZeneca Experimental Medicines Training Initiative
- NIHR203312/NIHR Cambridge Biomedical Research Centre
- NIHR203312/NIHR Cambridge Biomedical Research Centre
LinkOut - more resources
Full Text Sources
Medical
