El Niño and La Niña differentially drive transmission dynamics of the small ruminant parasite Haemonchus contortus across agroecological zones in Southern Africa
- PMID: 40593988
- PMCID: PMC12216351
- DOI: 10.1038/s41598-025-03156-8
El Niño and La Niña differentially drive transmission dynamics of the small ruminant parasite Haemonchus contortus across agroecological zones in Southern Africa
Abstract
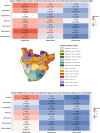
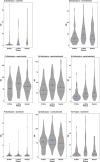
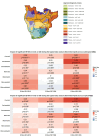
The El Niño La Niña Southern Oscillation (ENSO) exerts a significant influence on agroecological environments and plays a crucial role in influencing crop productivity, yet its impact on animal diseases has been largely overlooked, despite the evident impact of climate on disease transmission. This study aimed to evaluate the impact of ENSO on the transmission potential (Q0) of Haemonchus contortus (H. contortus) across agroecological zones (AEZs) in southern Africa across the region's typical rainy season (November-April). Key results indicate that stronger El Niño events can significantly decrease H. contortus transmission potential in subtropical AEZs. Tropical AEZs exhibit lower sensitivity to El Niño generally, but stronger events can lead to significant transmission potential reductions in certain zones. Conversely, La Niña increases transmission potential in tropical AEZs by small-to-medium effect magnitudes, depending on AEZ. Importantly, the analysis found significant increases in Q0 across direct transitions from El Niño to La Niña, with statistically significant medium effects observed in all tropical AEZs, except for the cool-subhumid AEZ. In subtropical AEZs, notable increases in Q0 were found in the warm-humid and warm-subhumid zones, also according to medium effect sizes. The study highlights the necessity for disseminating proactive and adaptive animal management practices for small ruminants among smallholder farmers, both during ENSO events and continuing into the post-event transition period, particularly through capacity building, nutritional supplementation and targeted selective treatment. The findings underscore the importance of considering small ruminants in ENSO preparedness and response plans, allowing farmers to optimise the resilience-enhancing roles of small ruminants to mitigate the impacts of climate shocks and food insecurity.
© 2025. The Author(s).
Conflict of interest statement
Declarations. Competing interests: The authors declare no competing interests.
Figures


Similar articles
-
Effects of extreme air pollution and El Niño Southern Oscillation on insufficient sleep: a cross-sectional study.BMC Public Health. 2025 Jun 4;25(1):2074. doi: 10.1186/s12889-025-23316-9. BMC Public Health. 2025. PMID: 40468248 Free PMC article.
-
The impact of weather and extreme events on malaria transmission in the Brazilian Amazon: a case-crossover and population-based study.Lancet Reg Health Am. 2025 Jul 17;49:101189. doi: 10.1016/j.lana.2025.101189. eCollection 2025 Sep. Lancet Reg Health Am. 2025. PMID: 40704022 Free PMC article.
-
Future climate change is projected to predominantly suppress the transmission potential of the small ruminant parasite Haemonchus contortus in Africa.Int J Parasitol. 2025 Aug 29:S0020-7519(25)00159-6. doi: 10.1016/j.ijpara.2025.08.013. Online ahead of print. Int J Parasitol. 2025. PMID: 40886818
-
Meta-analysis of the parasitic phase traits of Haemonchus contortus infection in sheep.Parasit Vectors. 2017 Apr 24;10(1):201. doi: 10.1186/s13071-017-2131-7. Parasit Vectors. 2017. PMID: 28438225 Free PMC article.
-
Trichostrongyle infections in domestic ruminants from Egypt: A systematic review and meta-analysis.Vet Parasitol Reg Stud Reports. 2022 Sep;34:100761. doi: 10.1016/j.vprsr.2022.100761. Epub 2022 Jul 16. Vet Parasitol Reg Stud Reports. 2022. PMID: 36041796
References
-
- Sazib, N., Mladenova, E. & Bolten, J. D. Assessing the impact of ENSO on agriculture over Africa using Earth observation data. Front. Sustainable Food Syst.410.3389/fsufs.2020.509914 (2020).
-
- Hoell, A., Gaughan, A. E., Magadzire, T. & Harrison, L. The modulation of daily Southern Africa precipitation by El Niño–Southern Oscillation across the summertime wet season. J. Clim.34, 1115–1134. 10.1175/JCLI-D-20-0379.1 (2021).
-
- Torres-Alavez, J. A., Giorgi, F., Kucharski, F. & Coppola, E. Castro-García, L. ENSO teleconnections in an ensemble of CORDEX-CORE regional simulations. Clim. Dyn.57, 1445–1461. 10.1007/s00382-020-05594-8 (2021).
-
- Mugiyo, H. et al. El Niño’s Effects on Southern African Agriculture in 2023/24 and Anticipatory Action Strategies to Reduce the Impacts in Zimbabwe. Atmosphere14 (2023).
MeSH terms
Grants and funding
LinkOut - more resources
Full Text Sources
Miscellaneous

