. 2025 Jul 1;15(1):21650.
doi: 10.1038/s41598-025-05087-w.

Identification of aging-related biomarkers and immune infiltration analysis in renal stones by integrated bioinformatics analysis

Affiliations

Identification of aging-related biomarkers and immune infiltration analysis in renal stones by integrated bioinformatics analysis

Yuanzhao Wang et al. Sci Rep. .

Abstract

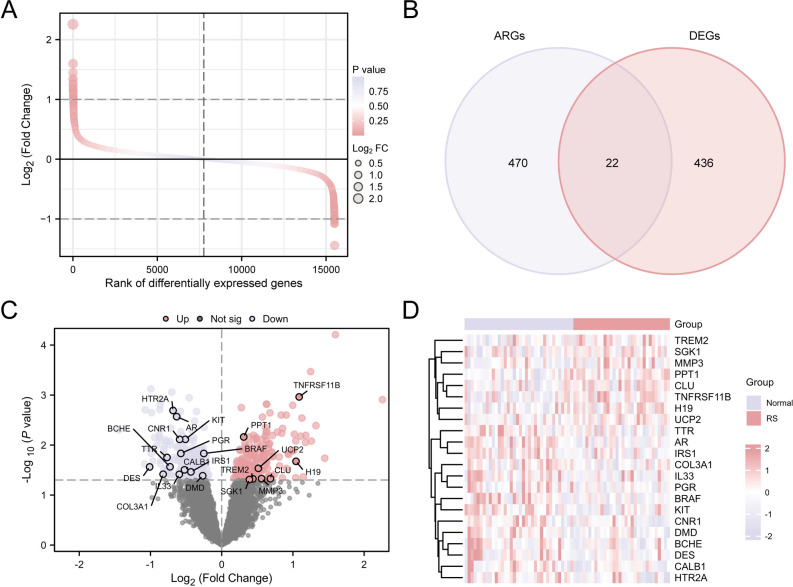
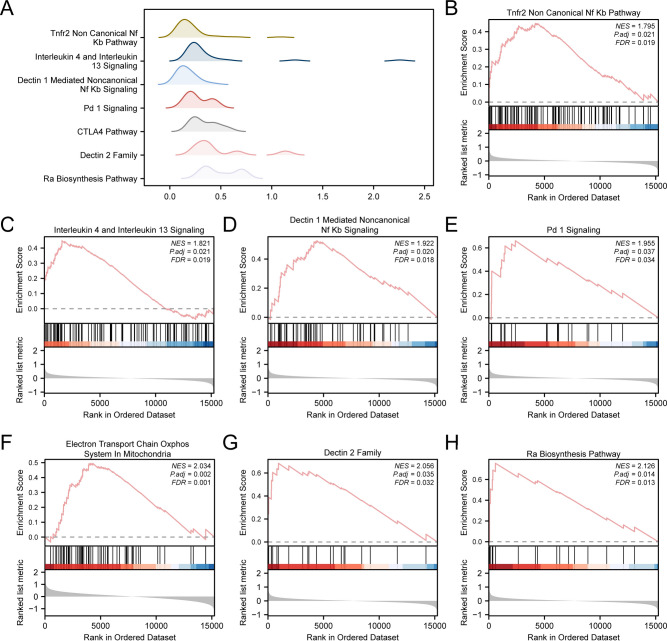
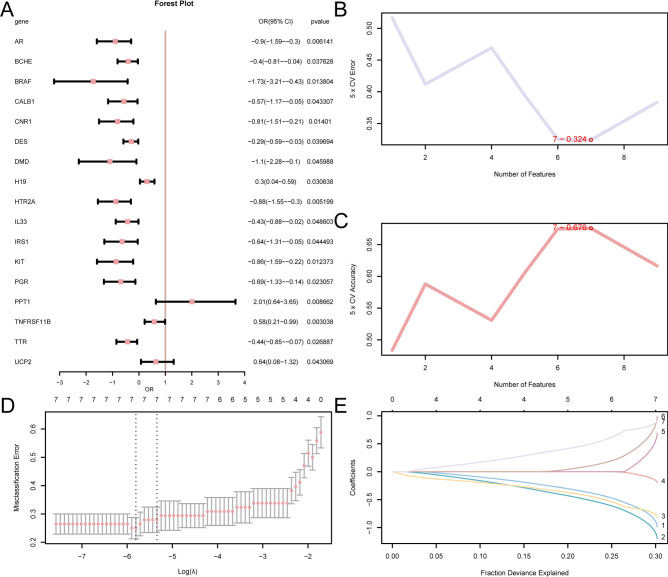
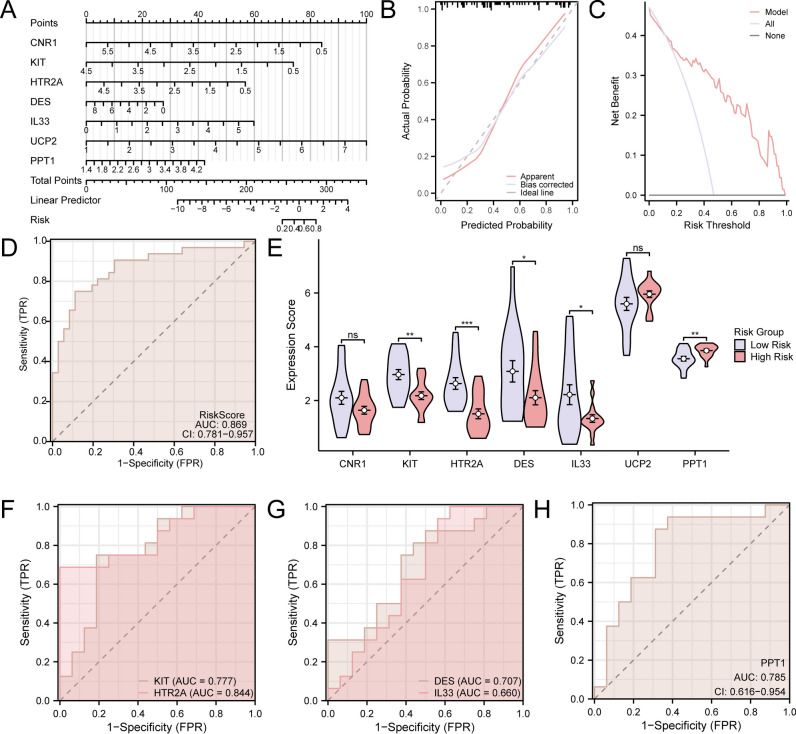
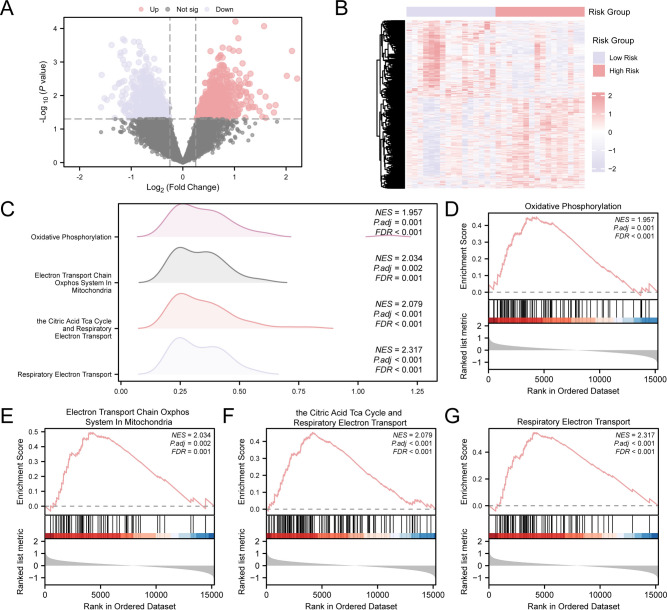
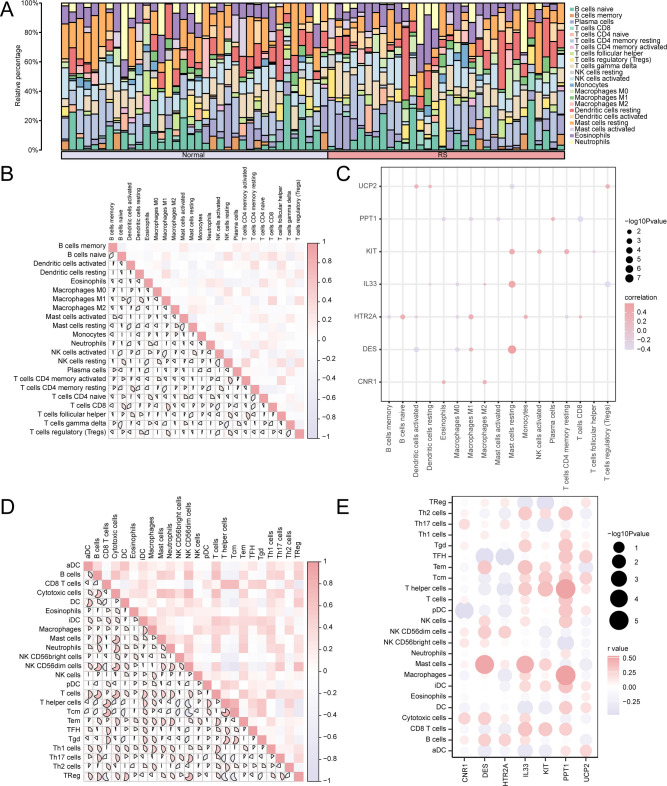
Renal stones (RS) are common urologic condition with unclear pathogenesis. Role of aging-related differentially expressed genes (ARDEGs) in RS remains poorly understood. This study aims to identify potential aging-related biomarkers for RS, explore the functions of aging-associated genes, and investigate the immunological microenvironment in RS. ARDEGs were collected from the GEO, GeneCards, and Molecular Signatures databases. The roles of ARDEGs were analyzed using Gene Ontology (GO) enrichment analysis. Key genes were identified using machine learning methods. Immune infiltration in RS was assessed using the CIBERSORT and ssGSEA algorithms. A total of 22 ARDEGs were identified through analysis, including 9 up-regulated and 13 down-regulated genes. GO enrichment analysis revealed that these genes were mainly involved in RS-related biological processes such as macrophage proliferation and neuroinflammatory response. GSEA analysis showed that RS-associated genes were predominantly involved in immune regulation-related pathways. Using logistic regression, SVM, and LASSO regression algorithms, a successful early-diagnosis model for RS was developed, yielding 7 key genes: CNR1, KIT, HTR2A, DES, IL33, UCP2, and PPT1. Immunocyte infiltration analysis of RS samples showed that CD8 + T cells had the strongest positive correlation with M1 macrophages, while resting NK cells had the strongest negative correlation with activated NK cells. The DES gene showed the strongest positive correlation with resting mast cells, and the IL33 gene displayed the highest negative correlation with regulatory T cells. Bioinformatics analysis screened out 7 new potential markers for RS and explored the possible mechanism of RS senescence. These findings provide novel insights into the relationship between RS and senescence, as well as the diagnosis and treatment of RS, and enhance our understanding of the disease's occurrence and development mechanisms.

Keywords: Biomarkers; Immune Infiltration; Integrated Bioinformatics; Renal Stone.


Conflict of interest statement

Declarations. Competing interests: The authors declare no competing interests.

Figures

Fig. 1
Fig. 1
ARDEGs Comprehensive Analysis Flow Chart.
Fig. 2
Fig. 2
Batch Effects Removal of GSE73680 and GSE117518. (A) Boxplot of distribution of GEO data sets before batch consolidation. (B) Boxplot of the distribution of the integrated GEO dataset after batch removal. (C) 2D PCA plot of data set before batch processing. (D) 2D PCA plot of the debauched integrated GEO dataset. PCA, Principal Component Analysis; DEGs, Differentially Expressed Genes. Light purple represents the RS dataset GSE73680, and light blue represents the RS dataset GSE117518.
Fig. 3
Fig. 3
Differential Gene Expression Analysis for Combined Datasets. Figures A, B, C, and D are based on the comprehensive GEO dataset. (A) Chromosome sequencing map of genes that are expressed differently between the RS group and the control group. (B) Venn map of DEGs and ARGs. (C) Volcano plot of the variances in gene expression between RS and control groups. (D) Heat map of expression values of ARDEGs. DEGs, Differentially Expressed Genes; ARGs, Aging-Related Genes; ARDEGs, Aging-Related Differentially Expressed Genes. Light purple stands for the normal group, and light pink for the RS group.
Fig. 4
Fig. 4
GO Enrichment Analysis for ARDEGs. (A) ARDEGs GO Enrichment Outcomes Bar Chart. (B) Bubble plot of GO enrichment results for ARDEGs. (C) Chord plot of GO enrichment study for ARDEGs. (D) GO Enrichment Results Circle Plot for ARDEGs. The pink dots inside the circle (D) indicate genes that are up-regulated (logFC > 0.00), whereas the purple dots reflect genes that are down-regulated (logFC < 0.00). ARDEGs, Aging-Related Differentially Expressed Genes; GO, Gene Ontology; BP, Biological Process; CC, Cellular Component; MF, Molecular Function. The screening criteria for GO enrichment analysis are adj. p—value < 0.05 and FDR < 0.25.
Fig. 5
Fig. 5
GSEA for Combined Datasets. (A) GSEA7 biological function mountain map presentation of the integrated GEO dataset. (BH) GSEA showed that RS was significantly enriched in Tnfr2 Non-Canonical Nf Kb Pathway (B), Interleukin 4 and Interleukin 13 Signaling(C), Dectin 1 Mediated Noncanonical Nf Kb Signaling, (D) Pd 1 Signaling, (E) Electron Transport Chain Oxphos System in Mitochondria (F), Dectin 2 Family (G) and Ra Biosynthesis Pathway (H). GSEA, Gene Set Enrichment Analysis. GSEA screening criteria: adj. p < 0.05 and FDR < 0.25.
Fig. 6
Fig. 6
Diagnostic Model of RS. (A) Forest plot of 22 ARDEGs contained in Logistic regression model in RS diagnosis model. (B,C) The SVM method visualizes the number of genomes alongside the smallest rates of error (B) and the number of genes with the greatest precision rate (C). (D,E) The LASSO regression model is shown by plots of the diagnosis model (D) and variable locus (E). ARDEGs, Aging-Related Differentially Expressed Genes; SVM, Support Vector Machine; LASSO, Least Absolute Shrinkage, and Selection Operator.
Fig. 7
Fig. 7
(A) Nomogram for key genes in the renal stone (RS) diagnostic model using integrated GEO datasets. (B,C) Calibration curve (B) and decision curve analysis (C) for the RS diagnostic model based on key genes from integrated GEO datasets. (D) ROC curve of Risk Score in integrated GEO datasets. (E). Comparison of key genes in RS samples stratified by high and low risk. In the independent ROC-validated risk score model formula, PPT1 (coefficient =  + 0.8583), IL33 (coefficient =  + 0.5008), HTR2A (coefficient = -0.754), and KIT (coefficient = -1.0539). (F–H) ROC curves of KIT and HTR2A (F), DES and IL33 (G), and PPT1 (H) in RS samples, showing significant expression differences between high and low risk groups. For calibration curves, the y-axis represents net benefit, and the x-axis shows threshold probability. DCA: Decision Curve Analysis; ROC Curve: Receiver Operating Characteristic Curve. *: p—value < 0.05; **: p—value < 0.01; ***: p—value < 0.001. An AUC of 0.7–0.9 indicates moderate accuracy.
Fig. 8
Fig. 8
Differential Gene Expression Analysis and GSEA for Risk Group. (A) Volcano map of differential gene expression between high- and low-risk groups among RS samples. (B) Heat map of DEGs between high- and low-risk groups in RS samples. (C) The mountain map of GSEA4 biological functions of RS samples is displayed. (DG) GSEA indicated an extensive enrichment of RS in Oxidative Phosphorus (D), Electron Transport Chain Oxphos System in Mitochondria (E), the Citric Acid Tca Cycle and Respiratory Electron Transport (F) and Respiratory Electron Transport (G). GSEA, Gene Set Enrichment Analysis. The screening criteria for GSEA are adj. p—value < 0.05 and FDR < 0.25.
Fig. 9
Fig. 9
Regulatory Network of Key Genes. (A) mRNA-miRNA regulatory networks for key genes. (B) mRNA-TF regulatory network of key genes. TF, Transcription Factor. Purple ovals represent mRNA, orange diamonds miRNA, and pink inverted triangles transcription factors.
Fig. 10
Fig. 10
Combined Datasets Immunological Infiltration Analysis utilizing CIBERSORT and ssGSEA. (A) Histogram of CIBERSORT immunological cell infiltrating abundance within the integrated GEO dataset. (B) Correlation heat map of CIBERSORT immunological cellular infiltrating abundance in integrated GEO dataset. (C) Heat map of correlations between CIBERSORT immunological cell infiltrating abundance with key genes in the incorporated GEO dataset. (D) Correlation heat map of ssGSEA immunological cellular infiltration abundance within integrated GEO dataset. (E) Heat map of correlations between key genes and ssGSEA immune cell infiltration abundance in the integrated GEO dataset. The absolute value of the correlation coefficient below 0.3 indicates weak or no correlation, between 0.3 and 0.5 weak correlation, between 0.5 and 0.8 moderate correlation, and above 0.8 strong correlation. Purple indicates a negative correlation and red positive correlation. Light red represents the renal RS group and light purple the normal group.
Fig. 11
Fig. 11
Risk Group Immune Infiltration Analysis via CIBERSORT and ssGSEA. (A) RS samples’ CIBERSORT immune cell infiltration abundance histogram. (B) Correlation of CIBERSORT immune cell infiltration abundance within RS samples. (C) Heat map of correlation between key genes and CIBERSORT immune cell infiltration abundance in RS samples. (D) RS samples’ ssGSEA immune cell infiltration abundance correlation heatmap. (E) Heat map of correlation of key genes with ssGSEA immune cell infiltration abundance in RS samples. The absolute value of the correlation coefficient below 0.3 indicates weak or no correlation, between 0.3 and 0.5 weak correlation, and between 0.5 and 0.8 moderate correlation. Purple indicates a negative correlation and red positive correlation. Light red represents the High Risk group and light purple the Low Risk group.

References

    1. Shastri, S. et al. Kidney Stone Pathophysiology, Evaluation and Management: Core Curriculum 2023. Am. J. Kidney Dis.82(5), 617–634 (2023). - PMC - PubMed
    1. Thongprayoon, C., Krambeck, A. E. & Rule, A. D. Determining the true burden of kidney stone disease. Nat. Rev. Nephrol.16(12), 736–746 (2020). - PubMed
    1. He, M. et al. Recent advances in the treatment of renal stones using flexible ureteroscopys. Int. J. Surg.110(7), 4320–4328 (2024). - PMC - PubMed
    1. Lyall, V. S., Wood, K. D. & Pais, V. J. Hydrochlorothiazide and Prevention of Kidney-Stone Recurrence. N. Engl. J. Med.388(21), 2014 (2023). - PubMed
    1. Khan, S. R. et al. Kidney stones. Nat. Rev. Dis. Primers2, 16008 (2016). - PMC - PubMed