. 2025 Jul 1;15(1):22453.
doi: 10.1038/s41598-025-03378-w.

Brain dynamics of the interplay between auditory selective attention and working memory during melody encoding

Affiliations

Brain dynamics of the interplay between auditory selective attention and working memory during melody encoding

Aurélien de la Chapelle et al. Sci Rep. .

Abstract

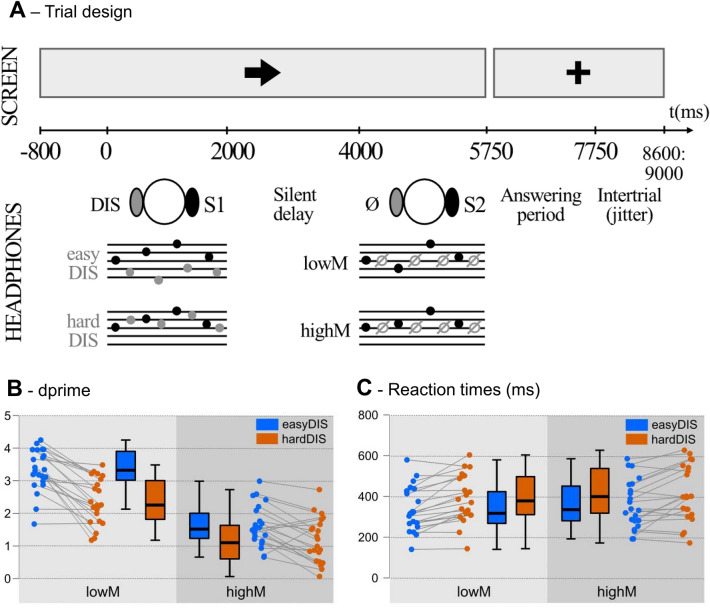
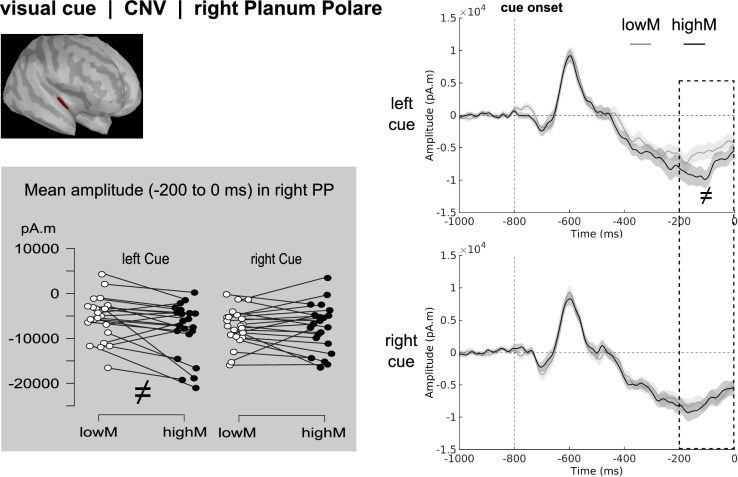
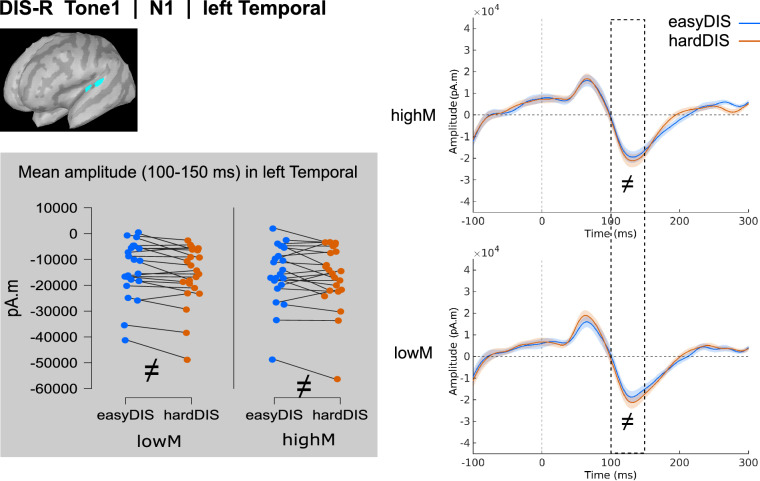
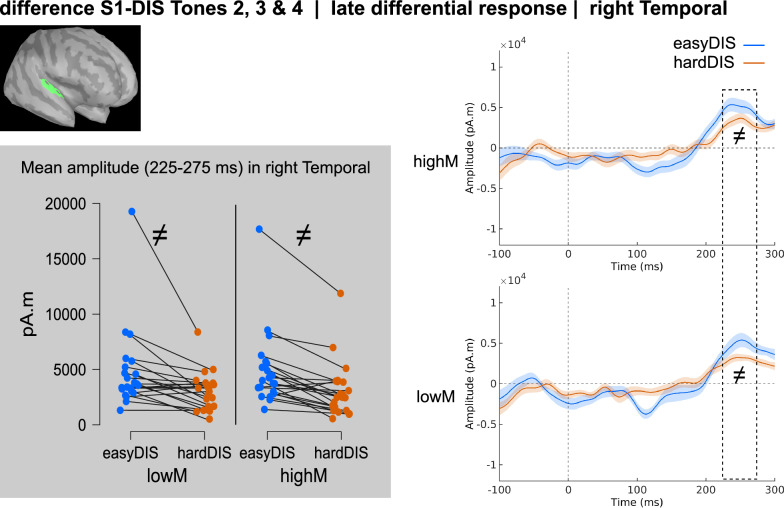
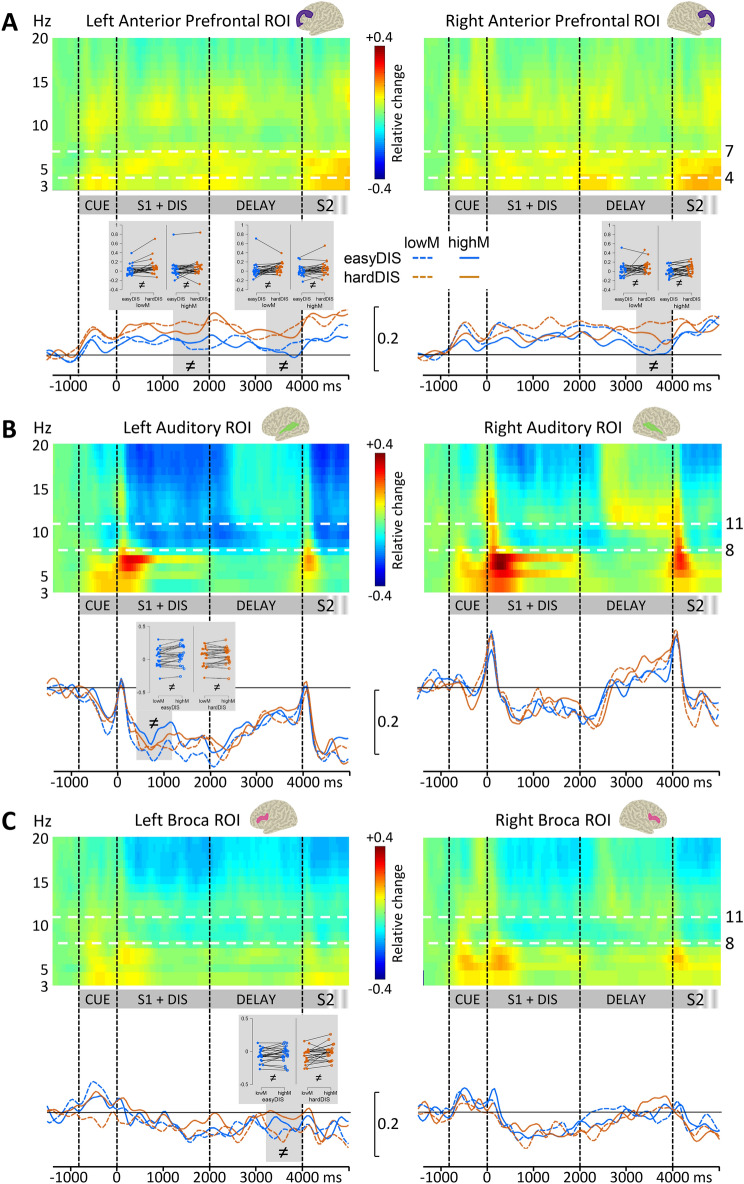
Working memory and attention are jointly needed in most everyday life tasks and activities. They have however mostly been studied separately. Here we investigate how auditory working memory-in a delayed-matching-to-sample task-and selective attention interact using a recently introduced paradigm (MEMAT, for MEMory and ATtention) and MEG (Magneto-encephalographic) recordings in twenty-two participants. We manipulate the difficulty of the memory task and attentional filtering. When memory task difficulty increases, accuracy decreases, CNV (Contingent Negative Variation) amplitude in anticipation of the melody to encode increases, and the decrease in alpha power during encoding and maintenance in a left fronto-temporal network is reduced. When attentional filtering difficulty increases, accuracy decreases, the amplitude of the sustained evoked response during encoding increases, whereas the differential processing of relevant and irrelevant sounds in auditory areas is less pronounced, and frontal theta power during encoding and maintenance is higher. In the left auditory cortex, we directly observe the result of the interaction between auditory memory and attention: the facilitation of relevant sound processing in the easy filtering condition reduces when the memory task difficulty increases. This pattern mirrors the observed behavioural effects: a smaller difference in accuracy between attention conditions when the memory task difficulty increases. Overall brain dynamics highlight reciprocal influences of working memory and selective attention processes, in keeping with shared cognitive resources between them.


Conflict of interest statement

Declarations. Competing interest: The authors declare no competing interests.

Figures

Fig. 1
Fig. 1
Trial design & behavioral results. (A). The same paradigm is described in Blain, de la Chapelle et al. 77. The ear of interest was indicated by an arrow on the screen during the trial. The to-be-attended melody S1 played in this ear must be encoded in memory while a to-be-ignored melody DIS was played in the other ear, interleaved with S1 tones. After a 2s retention delay, a melody S2 was played in the ear of interest and participants indicated whether S1 and S2 were identical or different. The melody DIS could be either easy (easyDIS) or hard (hardDIS) to ignore based on their frequency similarity with S1. When S2 was different from S1, one note was changed of either 5–6 semi-tones, entailing a contour change in the melody (low difficulty memory task; lowM blocks) or 1–2 semi-tones without contour change (high difficulty memory task; highM blocks). Performance: (B). d’ and (C). reaction times. Effect of the difficulty of the task (lowM: low difficulty, highM: high difficulty) and of the difficulty of the distractor (easyDIS: easy to ignore, hardDIS: hard to ignore). Whisker plots show the median ± quartile and the minimum/maximum values. Lines in the strip plots connect data from the same participant.
Fig. 2
Fig. 2
Contingent Negative Variation (CNV) in the source space. Time course of the ERF to the visual cue onset, for each MEMdiff and Cued Side condition, in the right Planum Polare (PP) ROI represented on the MNI template. On the time course plots, shadowed areas represent standard errors of the mean. The strip plot shows individual data averaged by condition in the dotted period (− 200 to 0 ms) showing positive or greater evidence for an effect of the MEMdiff factor (see Table 1 for time-windows and results). Lines connect data from the same participant.
Fig. 3
Fig. 3
Transient evoked responses to the first tone in the source space. Time course of the ERF to the first tone of DIS melodies presented to the right (DIS-R), for each DISdiff (DIS ERF represented only) and each MEMdiff condition, in the left Temporal ROI represented on the MNI template. On the time course plots, shadowed areas represent standard errors of the mean. The strip plot shows individual data averaged by condition in the gray period showing positive or greater evidence for a DISdiff effect (see Table 1 for time-windows and results). Lines connect data from the same participant.
Fig. 4
Fig. 4
Transient evoked responses to S1 tones 2, 3, and 4 in the Temporal ROIs (source space). Time course of the averaged ERF to the tones 2, 3, and 4 of the to-be-attended melody S1 (tone onset at 0ms), for each DISdiff and MEMdiff condition, in the corresponding ROI represented on the MNI template. On the time course plots, shadowed areas represent standard errors of the mean. The strip plots show individual data averaged by condition in the dotted periods showing positive or greater evidence for a DISdiff effect or for the DISdiff-by-MEMdiff interaction (see Table 1 for time-windows and results). Lines connect data from the same participant. Only contralateral tones are analyzed here: S1-R for left sources, and S1-L for right sources. S1-L or S1-R: S1 melodies presented to the left or right ear, respectively.
Fig. 5
Fig. 5
Transient evoked responses to DIS tones 2, 3, and 4 in the Planum Polare ROIs (source space). Time course of the averaged ERF to the tones 2, 3, and 4 of the to-be-ignored melody DIS (tone onset at 0ms), for each DISdiff and MEMdiff condition, in the corresponding ROI represented on the MNI template. On the time course plots, shadowed areas represent standard errors of the mean. The strip plots show individual data averaged by condition in the dotted periods showing positive or greater evidence for a DISdiff effect (see Table 1 for time-windows and results). Lines connect data from the same participant. Only contralateral tones are analyzed here: DIS-R for left sources, and DIS-L for right sources. DIS-L or DIS-R: DIS melodies presented to the left or right ear, respectively. leftPP: left Planum Polare, right PP: right Planum Polare.
Fig. 6
Fig. 6
Transient evoked responses to the tones 2, 3, and 4, late differential response, in the right Temporal ROI (source space). Time course of the difference (S1-DIS) between averaged ERF to the tones 2, 3, and 4 of the to-be-attended melody S1 and of the to-be-ignored melody DIS (tone onset at 0ms), for each DISdiff and MEMdiff condition, in the right Temporal ROI represented on the MNI template. On the time course plots, shadowed areas represent standard errors of the mean. The strip plots show individual data averaged by condition in the dotted periods showing positive or greater evidence for a DISdiff effect (see Table 1 for time-windows and results). Lines connect data from the same participant.
Fig. 7
Fig. 7
Sustained evoked responses in the Planum Polare ROIs (source space). Time course of the ERF for each DISdiff and each MEMdiff condition, in the corresponding ROIs represented on the MNI template. On the time course plots, shadowed areas represent standard errors of the mean. The strip plot shows individual data averaged by condition in the dotted periods showing positive or greater evidence for a DISdiff effect (see Table 1 for time-windows and results). Lines connect data from the same participant. leftPP: left Planum Polare, right PP: right Planum Polare.
Fig. 8
Fig. 8
Time–frequency plots and time profiles in the source space. Time–frequency power (relative change) plots during Cue presentation, S1 & DIS melodies, and the delay (S1 onset at 0ms), for all conditions averaged, in the left and right Anterior Prefrontal regions (A), in the left and right Auditory cortices (B), in the left and right Broca areas (C), in the left and right Dorso-Lateral Prefrontal Cortex (DLPFC, D), and in the left and right Visual cortices (E). Response to S2 is not fully represented here. In comparison to baseline (− 1800 to − 1000 ms relative to S1 onset), a decrease in power appears in blue and an increase in power appears in red. Regions of interest were defined based on the results from the cluster-based permutation tests performed on the DICS-reconstructed sources for the whole brain. Time course of the power (relative change) for each DISdiff and each MEMdiff condition, in the corresponding ROIs represented on the MNI template: alpha band (8 to 11 Hz) in the Auditory (A) and BROCA (B) ROIs, theta band (4 to 7 Hz) in the Anterior Prefrontal (C) ROIs. The strip plot shows individual data averaged by condition in the gray periods showing positive or greater evidence for a DISdiff effect (see Table 2 for time-windows and results, and figure S14 for a larger version of the strip plots). Lines connect data from the same participant.
Fig. 8
Fig. 8
Time–frequency plots and time profiles in the source space. Time–frequency power (relative change) plots during Cue presentation, S1 & DIS melodies, and the delay (S1 onset at 0ms), for all conditions averaged, in the left and right Anterior Prefrontal regions (A), in the left and right Auditory cortices (B), in the left and right Broca areas (C), in the left and right Dorso-Lateral Prefrontal Cortex (DLPFC, D), and in the left and right Visual cortices (E). Response to S2 is not fully represented here. In comparison to baseline (− 1800 to − 1000 ms relative to S1 onset), a decrease in power appears in blue and an increase in power appears in red. Regions of interest were defined based on the results from the cluster-based permutation tests performed on the DICS-reconstructed sources for the whole brain. Time course of the power (relative change) for each DISdiff and each MEMdiff condition, in the corresponding ROIs represented on the MNI template: alpha band (8 to 11 Hz) in the Auditory (A) and BROCA (B) ROIs, theta band (4 to 7 Hz) in the Anterior Prefrontal (C) ROIs. The strip plot shows individual data averaged by condition in the gray periods showing positive or greater evidence for a DISdiff effect (see Table 2 for time-windows and results, and figure S14 for a larger version of the strip plots). Lines connect data from the same participant.

Similar articles

References

    1. O’Leary, D. S. et al. Auditory and visual attention assessed with PET. Hum. Brain Mapp.5, 422–436 (1997). - PubMed
    1. Lipschutz, B., Kolinsky, R., Damhaut, P., Wikler, D. & Goldman, S. Attention-dependent changes of activation and connectivity in dichotic listening. Neuroimage17, 643–656 (2002). - PubMed
    1. Petkov, C. I. et al. Attentional modulation of human auditory cortex. Nat. Neurosci.7, 658–663 (2004). - PubMed
    1. Kawashima, R. et al. Selective visual and auditory attention toward utterances—A PET study. Neuroimage10, 209–215 (1999). - PubMed
    1. Belin, P. et al. The functional anatomy of sound intensity discrimination. J. Neurosci.18, 6388–6394 (1998). - PMC - PubMed

LinkOut - more resources