. 2025 Jul 1;15(1):22408.
doi: 10.1038/s41598-025-03535-1.

Biofilm detachment significantly affects biological stability of drinking water during intermittent water supply in a pilot scale water distribution system

Affiliations

Biofilm detachment significantly affects biological stability of drinking water during intermittent water supply in a pilot scale water distribution system

Mats Leifels et al. Sci Rep. .

Abstract

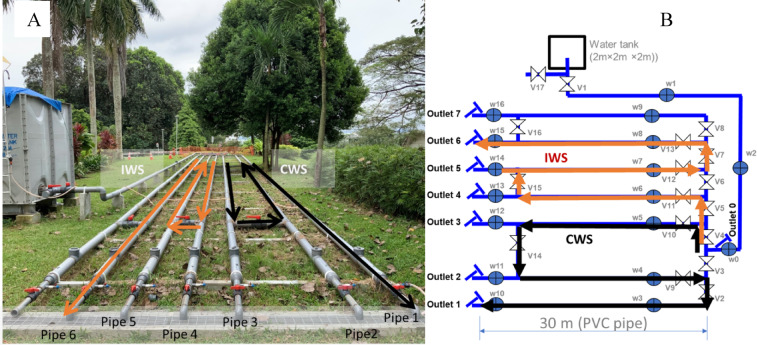
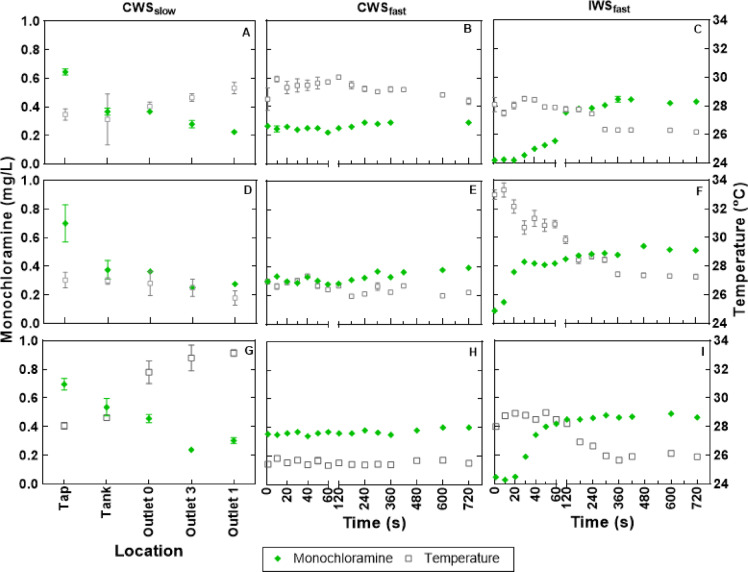
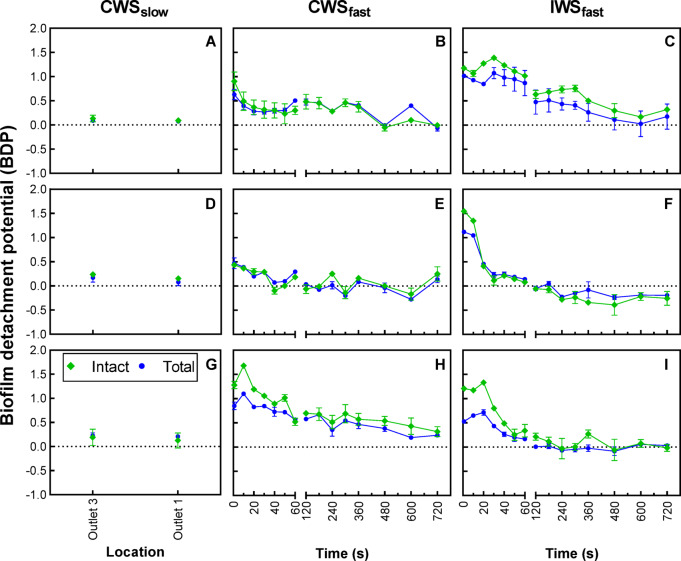
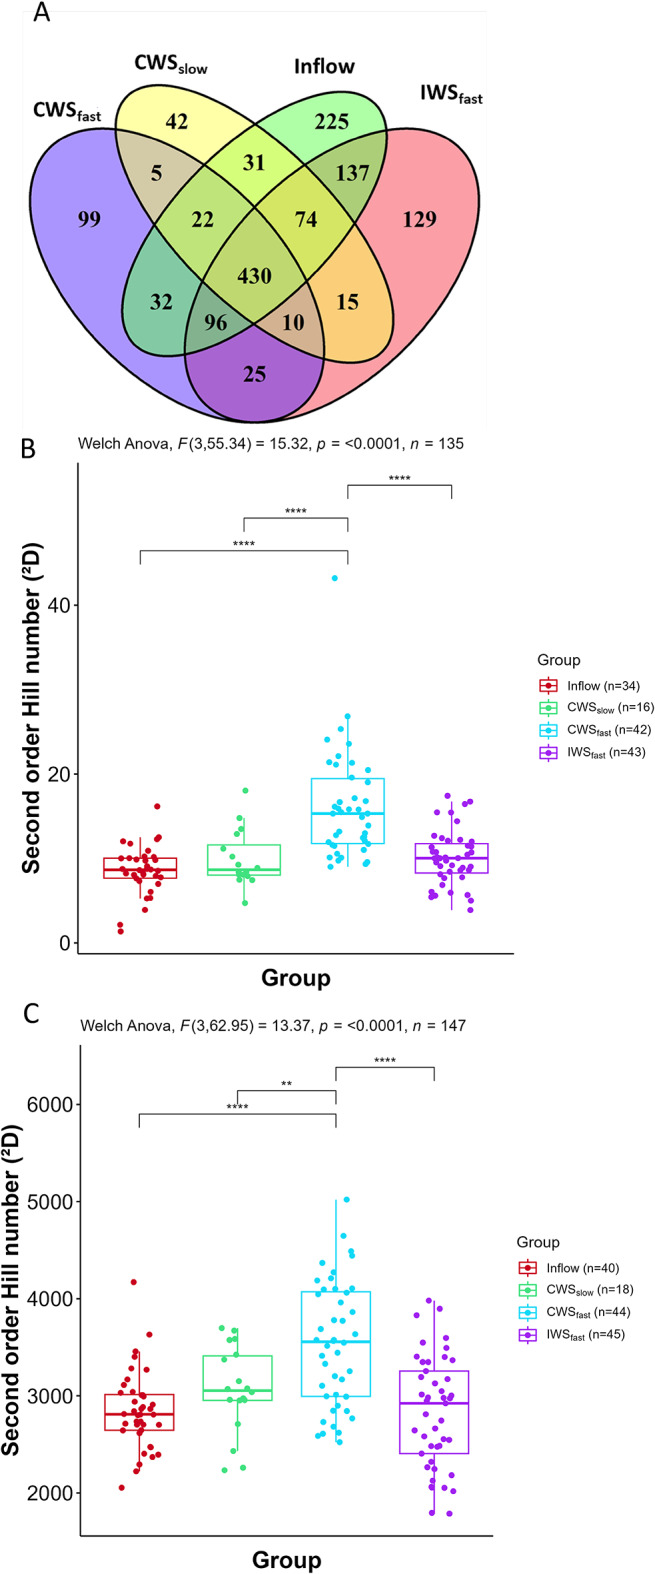
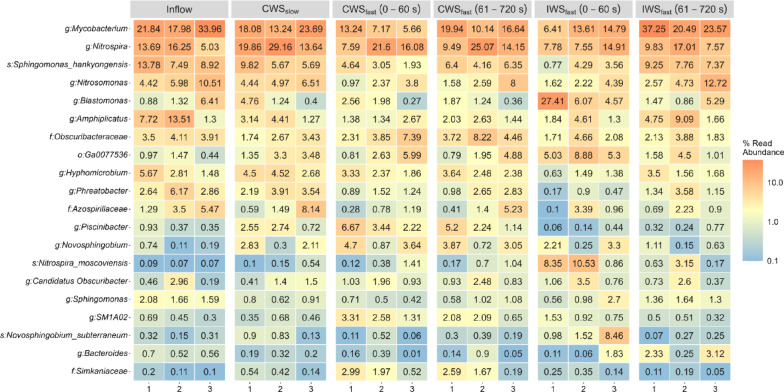
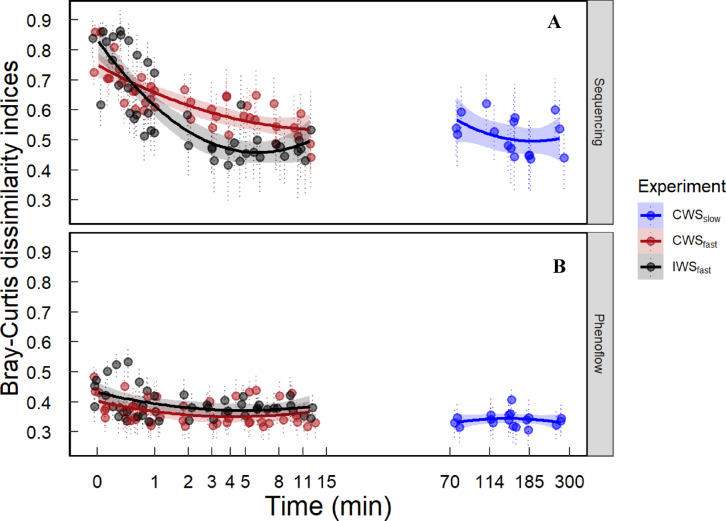
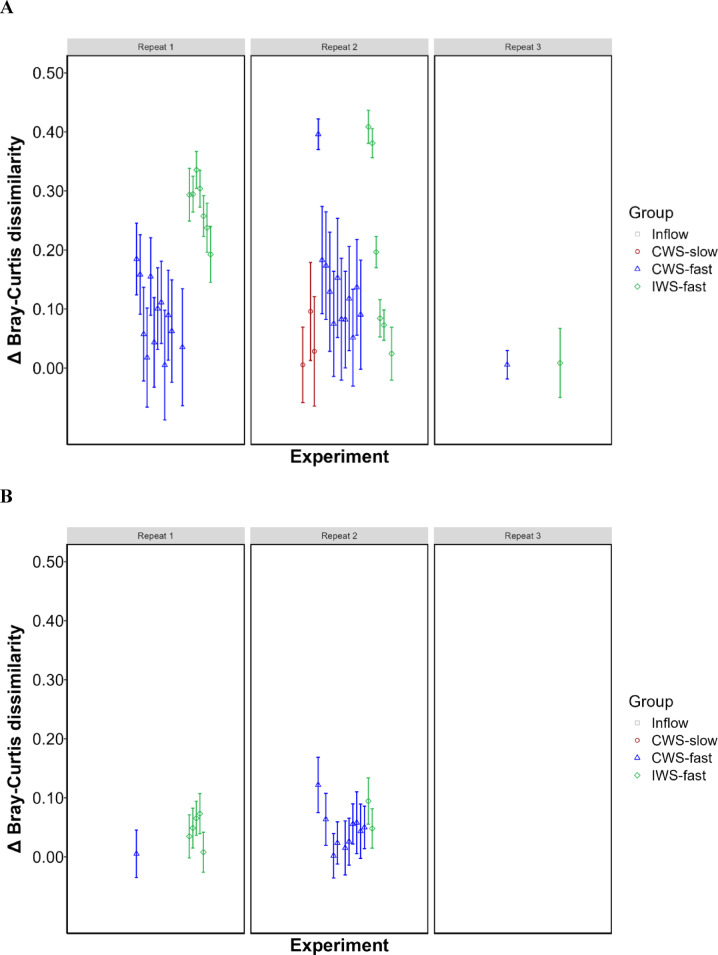
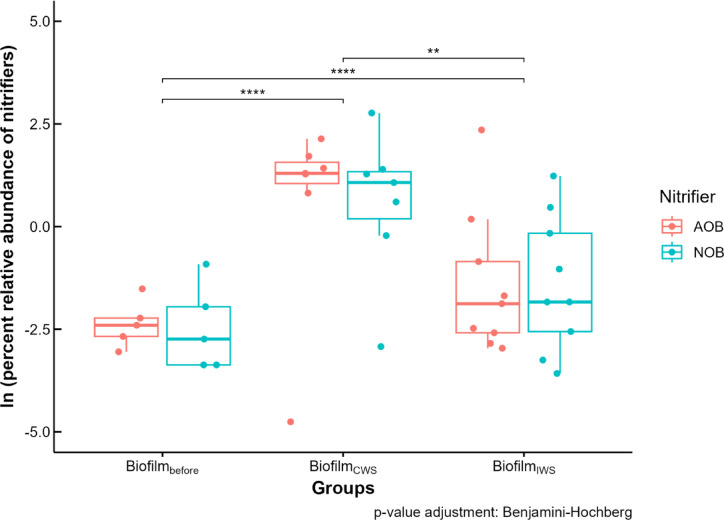
Intermittent service provision (IWS) in piped drinking water distribution systems is practiced in countries with limited water resources; it leads to stagnant periods during which water drains completely from de-pressurized pipes, increasing the likelihood of biofilm detachment upon reconnection when water is supplied to the consumer and thus affecting water quality. Our study examines the impact of uninterrupted or continuous water supply (CWS) and IWS on microbial communities and biofilm detachment, using data from three 30-day experiments conducted in an above-ground drinking water testbed with 90-m long PVC pipes containing residual monochloramine. Flow cytometry (FCM) revealed a significant increase in total and intact cell concentrations when water was supplied intermittently compared to CWS, and the microbial alpha-diversity was significantly higher in CWS sections by both 16S rRNA gene metabarcoding and phenotypic fingerprinting of flow cytometry data. Nitrate levels in the water were significantly higher during initial intermittent flow due to the activity of nitrifying bacteria in biofilms exposed to stagnant water in pipes. Overall, biofilm detachment significantly affects the biological stability of drinking water delivered through IWS compared to CWS. We developed a novel biofilm detachment potential index derived from FCM data to estimate the minimum amount of water needed to be discarded before microbial cell counts and community composition return to baseline levels.

Keywords: Drinking water Microbiome; Drinking water biofilms; Intermittent water supply; Monochloramine; Nitrification; Phenotypic fingerprinting.


Conflict of interest statement

Declarations. Competing interests: The authors declare no competing interests.

Figures

Fig. 1
Fig. 1
Above-ground drinking water testbed used to simulate continuous and intermittent drinking water supply. (A) Photograph of testbed setup including a 270-m-long pipe and storage tank (shown on the left). The direction of flow and division of pipe segments for intermittent (IWS) and continuous (CWS) operation is shown using orange and black arrows, respectively. (B) Schematic overview of the division of flow for IWS and CWS scenarios. Parallel 90-meter pipe segments were run continuously (CWS) or intermittently (IWS) and fed with water from the storage tank. Pipe outlets (IWSfast and CWSfast) and sampling taps (CWSslow) allowed for the release of bulk water with the pre-determined flow rate during the three replicate experiments. The CWS was flushed with flow rates comparable to both IWS and utility recommended speeds after each of the 3 replicate samples simulated conditions found in operational systems after pipe maintenance. The testbed is isolated from the university DWDS but is fed by inflowing water from its mains via the storage tank. Sampling points are located at the outlets of Pipe 6 for IWSfast and Pipe 1 for CWSslow/CWSfast.
Fig. 2
Fig. 2
Monochloramine and temperature measurements for the sampling points (CWSslow), and times (CWSfast and IWSfast). Monochloramine (green diamond) and temperature (grey rectangle) showed similarly reproducible trends within each experimental condition and the repeated samplings (30–33 days apart). Lower monochloramine in the earlier collection indicates a decay of the residual disinfectant within the IWS in-between provision cycles. Error bars indicate standard deviations and measurement was done in biological triplicates (n = 3) for each time point and parameter. Error bars may be contained in the symbol.
Fig. 3
Fig. 3
Ratio of outflow to inflow concentrations of total and intact microbial cells in the three experimental setups, each repeated three times at monthly intervals. The y axis refers to log10 (Cells Outflow/Cells Inflow), defined as the logarithmic ratio of outflow to inflow biomass as calculated from flow cytometry results and flowrate measurements. Flow cytometry measurements involve biological and technical triplicates for each time point. Green diamonds and blue circles represent intact and total cell concentration, respectively. Error bars indicate standard deviations. (A,D,G) Refers to the three monthly repeats of experiment, laminar flow conditions on pipes 3, 2 and 1 connected in series, CWSslow sampled at locations outlet 3 and outlet 1, respectively every 38 min; (B,E,H) refers to the three monthly repeats of experiment under fast flow conditions, CWSfast performed on pipes 3, 2 and 1 connected in series but sampled from outlet 1 only; (C,F,I) refers to the three monthly repeats of experiment under fast flow conditions, IWSfast performed on pipes 4, 5 and 6 connected in series but sampled from outlet 6 only.
Fig. 4
Fig. 4
Microbial alpha diversity in all three water flow scenarios and the inflow. (A) Venn diagram showing the number of ASVs (that is, richness) for inflow (1047), CWSslow (629), CWSfast (719), and IWSfast (916). Second order hill number2D) from (B) 16 S rRNA gene metabarcoding, and (C) flow cytometry fingerprinting data. The box bounds the interquartile range (25th and 75th) divided by the median, and Tukey-style whiskers extend to a maximum of 1.5 times the IQR beyond the box. Asterisks (** and ****) indicate significance (p ≤ 0.0001) in terms of p-values of Games-Howell post hoc grouping.
Fig. 5
Fig. 5
Community structure considering the twenty most abundant bacterial genera (family rank also included) in the three repeats (1–3) of the inflow, CWSslow, as well as the initial 60 s and the remaining 660 s of CWSfast and IWSfast groups. Sample size (n) was 11, 9, 14, 6, 6, 4, 7, 6, 6, 8, 7, 7, 7, 7, 7, 7, 7, 8 on each column from left to right (i.e., there were 34 inflow samples and 100 samples from outflow group, respectively, including 16 samples for CWSslow, 41 samples from CWSfast, and 43 samples from IWSfast).
Fig. 6
Fig. 6
Bray-Curtis dissimilarity indices in bulk water samples collected from CWSslow, CWSfast and IWSfast, compared to the inflowing water from (A) 16S rRNA metabarcoding (i.e., Sequencing) and (B) flow cytometric fingerprinting. Decreasing dissimilarity over time (after an initial peak) indicates reduced microbial communities and detached biofilms during the turbulent supply of both IWS and CWS and that the microbial water quality resembles that of laminar CWSslow after 60–80 s. Dots represent replicate samples taken during IWSfast, CWSfast and CWSslow with whiskers indicating the standard deviation between replicates analysis. Shaded areas (grey, red, and blue) indicate the 95% confidence interval of the model.
Fig. 7
Fig. 7
Deviating events calculated using (A) 16S rRNA metabarcoding data at the ASV level and (B) flow cytometry fingerprinting data collected from the same samples. Note: CWSslow, CWSfast and IWSfast refer to bulk water collected outlets samples and numbers 1, 2, and 3 denote the repetition of the experiment. All the samples were arranged in sequence of the sampling time of each experiment. The y-axis contains values of the difference of the Bray-Curtis dissimilarity of the outlet samples from the threshold, and only positive values indicating deviating events are shown. A threshold is set using the average of inflow Bray-Curtis dissimilarity plus 3 times the standard deviation, following the approach of Favere et al.. The Bray-Curtis dissimilarity that was assigned to a sample was calculated as the average of the Bray-Curtis dissimilarities between that sample and the inflow water samples of the same date.
Fig. 8
Fig. 8
Pairwise comparisons of relative abundance of ammonia oxidizing (AOB, red) and nitrite oxidizing bacteria (NOB, green) in three groups of biofilm samples (equivalent to 10 cm2 of pipe surface) obtained before and after the start of the 100-day study period. The average relative abundance of AOB or NOB for these three groups ranged from 0.1–4%. The analysis relies on data that underwent a natural logarithm transformation prior to conducting beta regression. The significance test is derived using the estimated marginal means after beta regression analysis with a log link function. The p-values were adjusted using the Benjamini–Hochberg method to account for multiple comparisons. The symbols ** and **** indicate statistical significance, representing p ≤ 0.01 and p ≤ 0.0001, respectively.
Fig. 9
Fig. 9
Community structure differences between CWSslow (blue circles), CWSfast (red triangles), and IWSfast (black asterisks) flow conditions from all three repeats, assessed via principal coordinates analysis (PCoA) of (A) 16S rRNA metabarcoding and (B) flow cytometry (FCM) fingerprinting data. Dotted lines indicate the 95% interval of the corresponding microbial communities. Both analyses show a significant difference in bacterial communities among CWSslow and CWSfast (p = 0.001) and CWSslow and IWSfast (p = 0.002) according to PERMANOVA test. The number of replicates are CWSslow (16S rRNA gene metabarcoding, n = 16; FCM, n = 45); CWSfast (16 S rRNA gene metabarcoding, n = 41; FCM, n = 59); and IWSfast (16S rRNA gene metabarcoding, n = 43; FCM, n = 60).

Similar articles

References

    1. Bain, R. et al. Fecal contamination of drinking-water in low- and middle-income countries: a systematic review and meta-analysis. PLoS Med.11, e1001644 (2014). - PMC - PubMed
    1. WHO. Guidelines for Drinking-Water Quality: Fourth Edition Incorporating the First and Second Addenda, 4 edn (World Health Organization, 2022). - PubMed
    1. Bivins, A. W. et al. Estimating Infection Risks and the Global Burden of Diarrheal Disease Articulable to Intermittent Water Supply Using QMRA (2017). - PubMed
    1. Taylor, D. D. J., Slocum, A. H. & Whittle, A. J. Analytical scaling relations to evaluate leakage and intrusion in intermittent water supply systems. PLoS ONE. 13, e0196887 (2018). - PMC - PubMed
    1. Douterelo, I., Jackson, M., Solomon, C. & Boxall, J. Microbial analysis of in situ biofilm formation in drinking water distribution systems: implications for monitoring and control of drinking water quality. Appl. Microbiol. Biotechnol.100, 3301–3011 (2016). - PMC - PubMed

LinkOut - more resources