. 2025 Jul 1;15(1):20996.
doi: 10.1038/s41598-025-05179-7.

Systematic screening of metabolic pathways to identify two breast cancer subtypes with divergent immune characteristics

Affiliations

Systematic screening of metabolic pathways to identify two breast cancer subtypes with divergent immune characteristics

Xiangshu Cheng et al. Sci Rep. .

Abstract

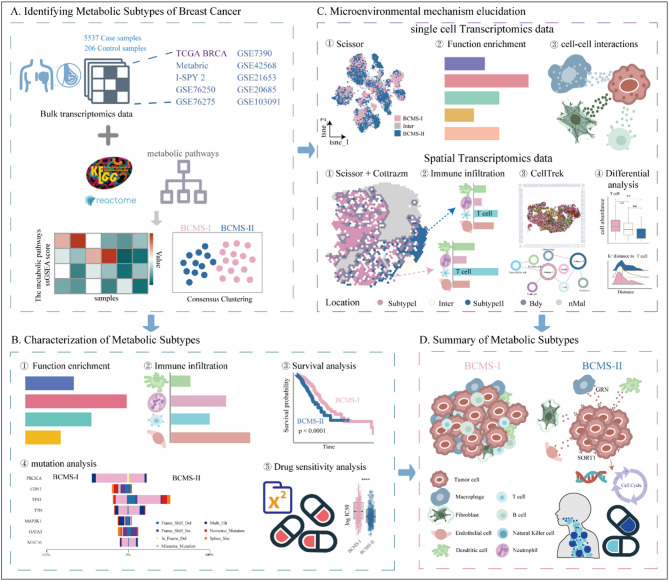
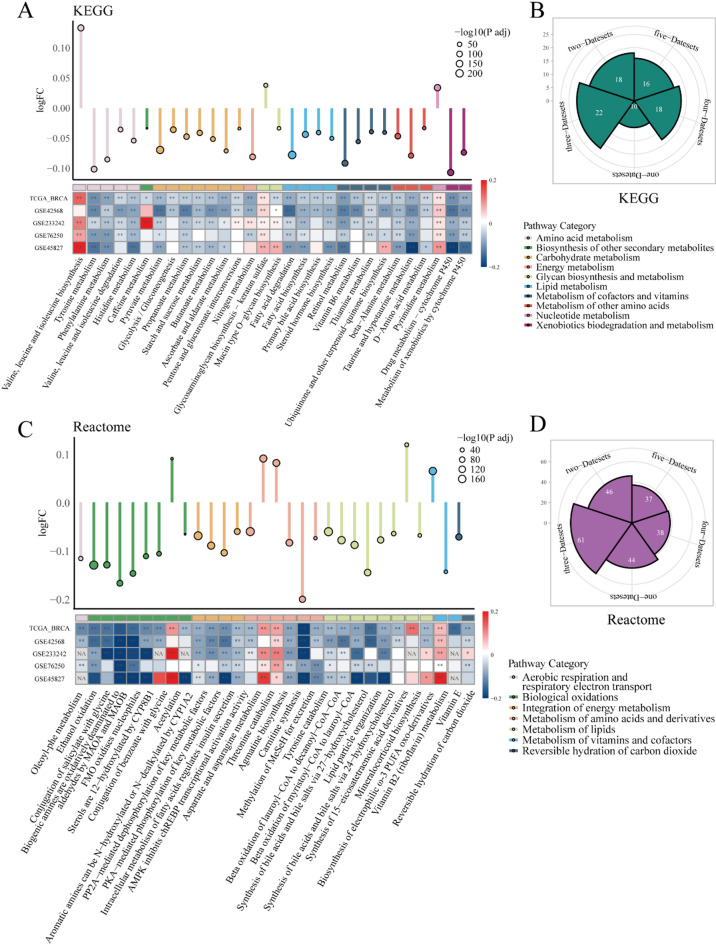
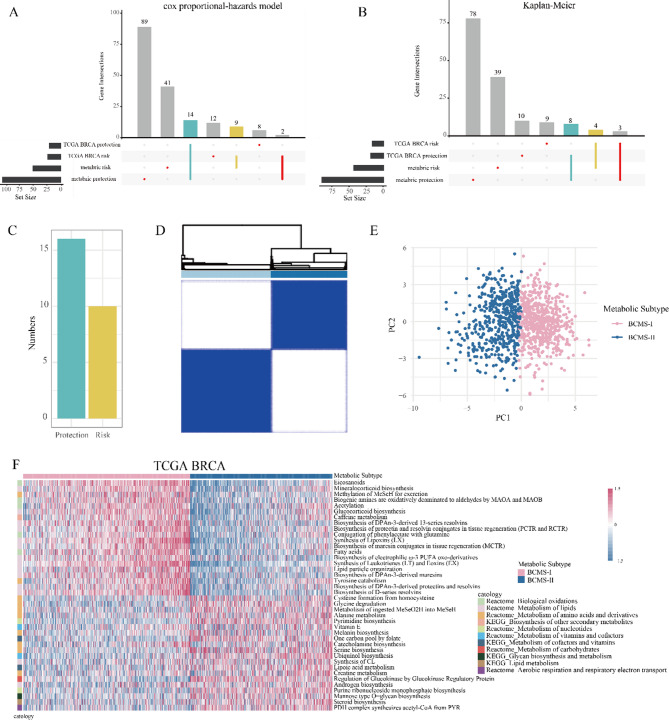
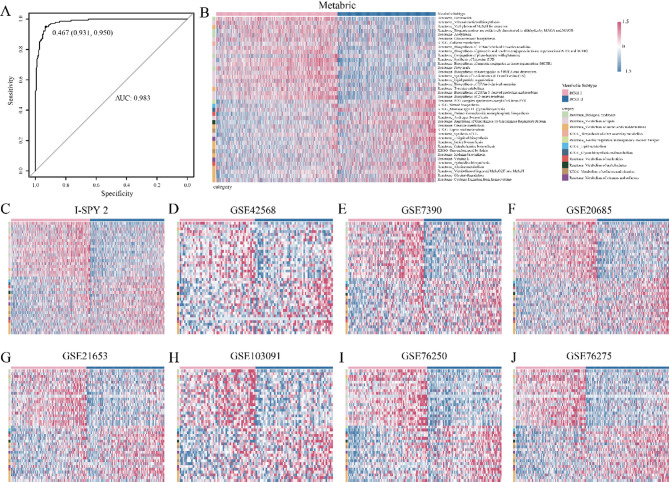
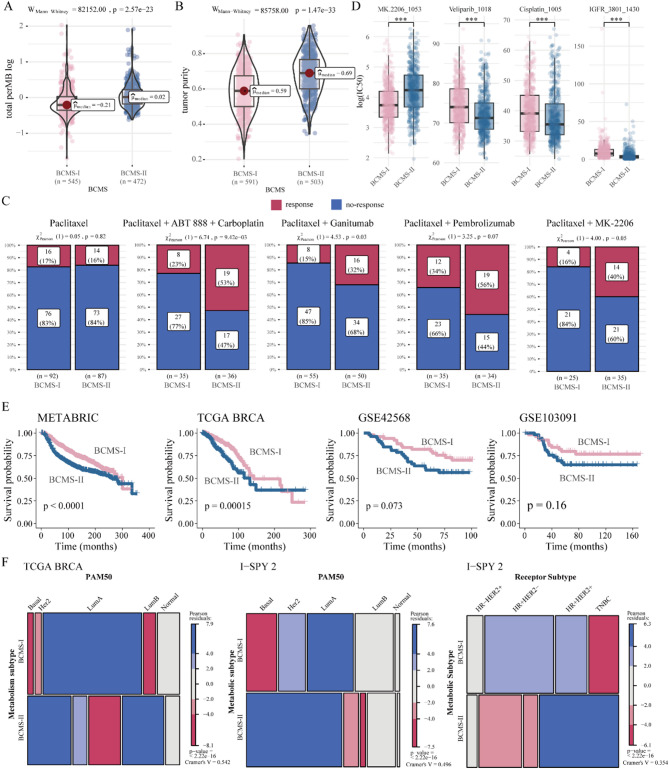
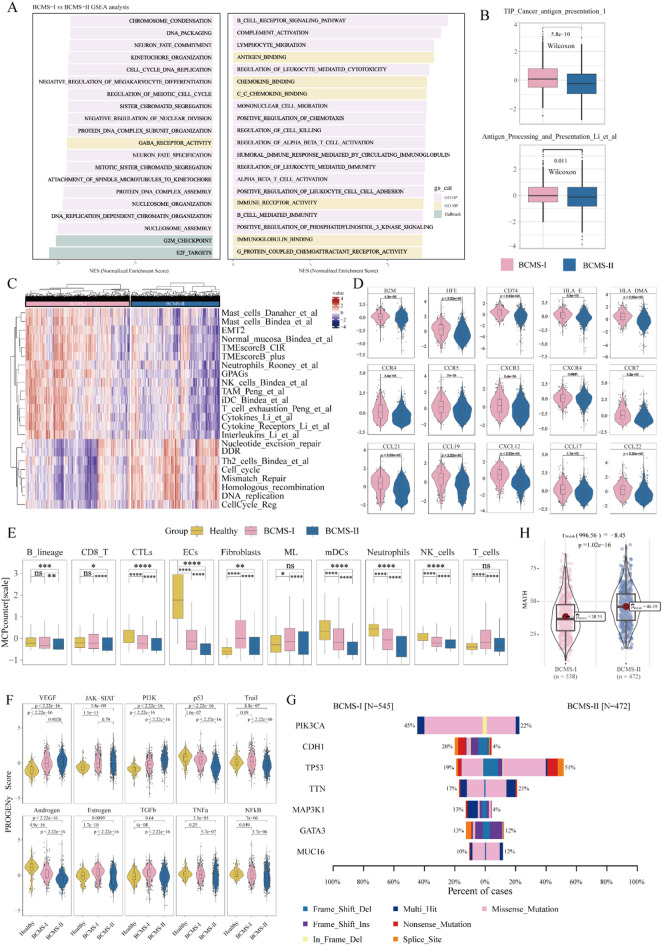
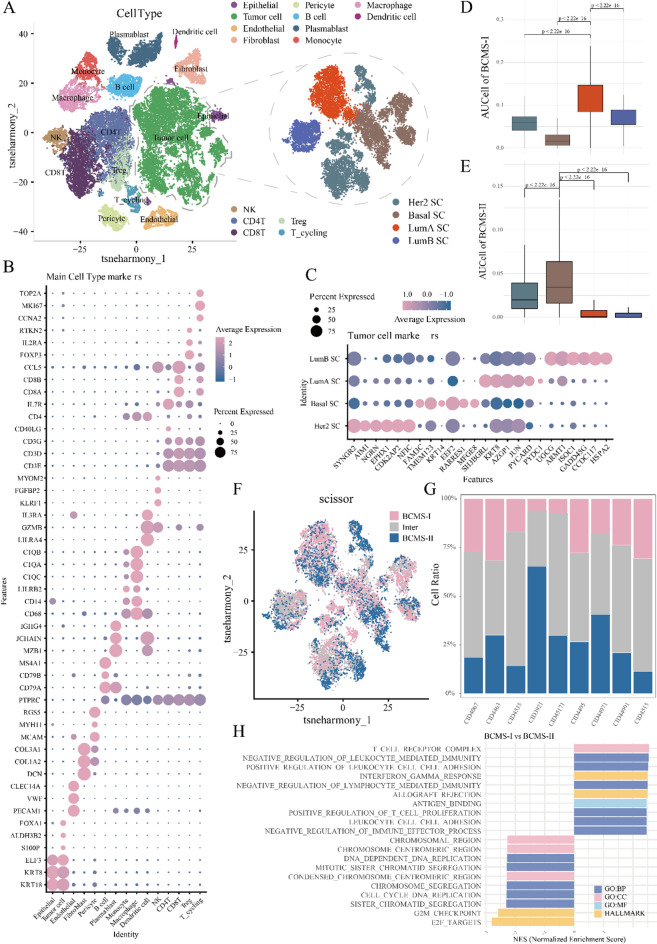
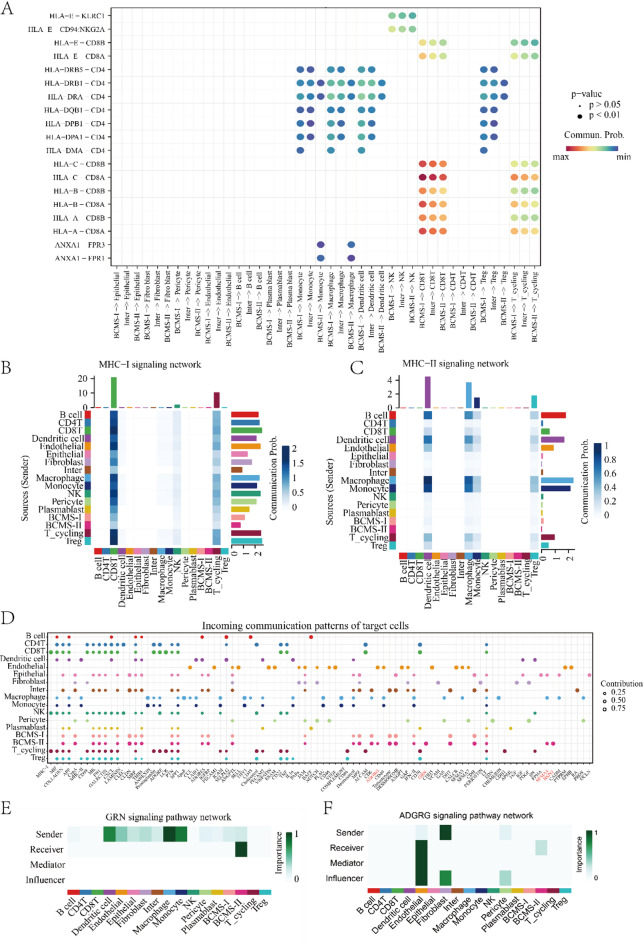
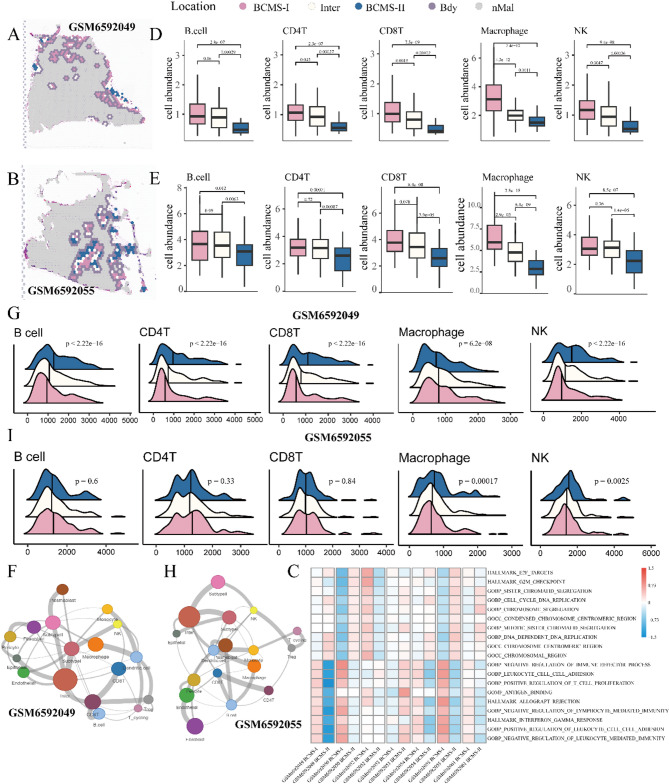
Due to the high heterogeneity among breast cancer (BRCA) patients, most individuals show a limited response rate to one specific treatment. The metabolic plasticity of BRCA cells is one of the main causes of their heterogeneity, affecting not only their own growth and function but also their metabolites have an impact on the tumor immune microenvironment (TIME). However systematic evaluation of metabolic pathways in BRCA is lacking. We identified BRCA metabolic subtypes (BCMS) by consensus clustering 26 KEGG/Reactome pathways in the TCGA BRCA discovery cohort (n = 1094). Nine independent bulk transcriptome cohorts (total n > 4000), including METABRIC and GEO datasets, were used for validation via random forest classification. To characterize BCMS, we applied an analytical framework encompassing functional enrichment (GSEA), immune infiltration (Mcpcounter), clinical correlation, drug sensitivity (oncoPredict) on bulk transcriptome data, cell-cell communication analysis (CellChat) on single-cell RNA sequencing (scRNA-seq) data, and spatial co-localization analysis (CellTrek) on spatial RNA sequencing (spRNA-seq) data. We identified two distinct BCMS. BCMS-I exhibited upregulated lipid metabolism-related pathways, characterized by immune activation, a better prognosis, and higher infiltration of immune cells, including B cells, T cells, NK cells, macrophages, and neutrophils. Spatial co-localization analysis further revealed that BCMS-I demonstrated spatial co-localization with immune cells. In contrast, BCMS-II showed upregulation of amino acid and vitamin metabolism-related pathways, with tumor cell proliferation, a poorer prognosis, and a lack of immune cell infiltration. The immune activation in BCMS-I is marked by the significant activation of the MHC-I signaling pathway in interactions between tumor cells and T/NK cells, and of the MHC-II signaling pathway in interactions between tumor cells and dendritic cells/macrophages. In contrast, the proliferative characteristics of BCMS-II are associated with the co-activation of the GRN signaling pathway by myeloid immune cells and stromal cells within the tumor microenvironment. Drug sensitivity analysis revealed that BCMS-II was highly sensitive to Ganitumab, Carboplatin + ABT-888, and Pembrolizumab. This study established a novel Breast Cancer Metabolic Subtyping System (BCMSS) based on metabolic pathway analysis. Our findings highlight the heterogeneity of BRCA in terms of metabolic features, immune characteristics, clinical prognosis, and drug sensitivity. The novel classification system provides valuable insights for clinical diagnosis and treatment, serving as a foundation for precision diagnosis and personalized therapies in BRCA.

Keywords: Breast cancer; Metabolic plasticity; Metabolic subtypes; Tumor immune microenvironment.


Conflict of interest statement

Declarations. Competing interests: The authors declare no competing interests.

Figures

Fig. 1
Fig. 1
The flowchart of this study.
Fig. 2
Fig. 2
Remodeling of Metabolic Pathways in BRCA. (A, C) The lollipop plots show the remodeling of the top 30 metabolic pathways identified in the TCGA BRCA dataset, while the heatmaps display the remodeling of these pathways across five datasets, with color representing logFC values. Significance markers: “*” indicates a padj value less than 0.05, and “**” indicates a padj value less than 0.01. (B, D) The rose plots visualize the number of metabolic pathways with consistent remodeling directions across multiple datasets.
Fig. 3
Fig. 3
Identification of Metabolic Subtypes in BRCA Patients. (A, B) Intersection statistics of prognostic protective factors and risk factors identified in the TCGA BRCA and METABRIC datasets through univariate Cox regression and Kaplan-Meier (KM) analysis. (C) Bar chart summarizing the combined results of the Cox regression and KM analysis. (D) Heatmap based on the consensus clustering algorithm. (E) 2D PCA plot visualizing the differences between the two metabolic subtypes. (F) Heatmap showing significantly upregulated metabolic pathways in each subtype, with the top 20 metabolic pathways having the largest absolute logFC values in BCMS-I/BCMS-II.
Fig. 4
Fig. 4
Construction and Application of the Breast Cancer Metabolic Subtyping System (BCMSS). (A) ROC curve of the metabolic subtype classifier constructed using random forest. (BJ) Application of the subtype classifier to different validation datasets, with heatmaps displaying the ssGSEA scores of the top 20 metabolic pathways identified in the training set across these validation sets. Note: The I-SPY2 dataset and GSE7390 dataset do not have ssGSEA scores for the Reactome pathway Methylation of MeSeH for excretion, so only 39 pathways are shown.
Fig. 5
Fig. 5
Clinical Heterogeneity of Metabolic Subtypes. (A) Comparison of tumor mutation burden between BCMS-I and BCMS-II. (B) Comparison of tumor purity between BCMS-I and BCMS-II. (C) Response proportions of different drugs between BCMS-I and BCMS-II. (D) Analysis of Drug Sensitivity Differences between BCMS-I and BCMS-II. (E) Kaplan-Meier curves show survival differences between BCMS-I and BCMS-II. (F) The mosaic plot illustrates the Pearson’s Chi-squared between BCMS and PAM50 molecular subtype and receptor subtype in various datasets.
Fig. 6
Fig. 6
Functional characteristics, gene expression, immune infiltration, signaling pathways, and mutation heterogeneity of metabolic subtypes. (A) Functional characteristics of BCMS-I and BCMS-II. (B) Violin plot illustrating the differences in ssGSEA scores for antigen presentation functions between BCMS-I and BCMS-II. (C) Heatmap depicting the ssGSEA scores of BCMS- I and BCMS-II in TME-related pathways. (D) Displays the expression differences of antigen presentation molecules, chemokines, and their receptors between BCMS-I and BCMS-II. (E) Immune cell infiltration differences among the two metabolic subtypes and healthy controls, as assessed by the MCPcounter method. (MDCs: Myeloid dendritic cells; ML: Monocytic lineage; ECs: Endothelial cells; CTLs: Cytotoxic lymphocytes). (F) Violin plot showing the activity differences of 10 pathways in BCMS-I, BCMS-II, and healthy controls, as calculated using the Progeny algorithm. (G) Bar chart summarizing the mutation frequencies in patients with BCMS-I and BCMS-II. (H) The heterogeneity index scores for the two metabolic subtypes.
Fig. 7
Fig. 7
Identification of BCMS in tumor cells. (A) t-SNE plot showing the distribution of all 41,314 cells and the distribution of 14,912 tumor cells. (B) Bubble plot displaying the average expression of classical marker genes for the 15 cell types. The size of each bubble represents the proportion of cells expressing the gene, and the color intensity reflects the normalized expression level of the gene. (C) Bubble plot displaying the average expression of classical marker genes for the four tumor cell subtypes. (D, E) Scoring of BCMS signature gene sets in the four tumor cell subtypes. (F) t-SNE plot showing the distribution of Scissor-selected tumor cells. (G) Bar plot showing the proportion of tumor cells classified into BCMS-I, intermediate state, and BCMS-II using the Scissor method across different samples. (H) Functions specifically upregulated in BCMS-I and BCMS-II.
Fig. 8
Fig. 8
Heterogeneity of BCMS in cell-cell communication. (A) Bubble plot showing the differences in specific ligand-receptor interactions between tumor cell BCMS and other cell types in the TME. (B, C) Heatmaps displaying the communication probabilities of MHC-I/II signaling pathways across all cell types. (D) Dot plot showing the incoming signaling patterns for different signaling pathways across all cell types. (E, F) Heatmap displaying four network centrality metrics calculated based on the GRN, ADGRG signaling network, illustrating the relative importance of each cell population.
Fig. 9
Fig. 9
Tumor regions of BCMS-I exhibit higher immune cell infiltration, with immune cells more likely to be located closer to BCMS-I. (A, B) Spatial distribution maps of malignant regions (BCMS-I, intermediate, BCMS-II), boundary regions, and non-malignant regions in 2 spatial transcriptomics samples. (C) The functional characteristics of spatial spots in BCMS-I and BCMS-II. (D, E) Box plots showing the infiltration differences of 5 immune cell types (B cells, CD4 + T cells, CD8 + T cells, macrophages, NK cells) in BCMS-I, intermediate, and BCMS-II regions. (F, H) Spatial colocalization graphs of cell types in 2 spatial transcriptomics samples. (G, I) CellTrek-based spatial K-distance of immune cells (B cells, CD4 + T cells, CD8 + T cells, macrophages, NK cells) to tumor cells (BCMS-I, intermediate, BCMS-II). The statistical significance in the ridge plots is BCMS-I vs. BCMS-II.

Similar articles

References

    1. Bray, F. et al. Global cancer statistics 2022: GLOBOCAN estimates of incidence and mortality worldwide for 36 cancers in 185 countries. CA Cancer J. Clin.74 (3), 229–263 (2024). - PubMed
    1. Fumagalli, C. & Barberis, M. Breast Cancer Heterogeneity. Diagnostics11 (9). (2021). - PMC - PubMed
    1. Rakha, E. A., Tse, G. M. & Quinn, C. M. An update on the pathological classification of breast cancer. Histopathology82 (1), 5–16 (2023). - PMC - PubMed
    1. Perou, C. M. et al. Molecular portraits of human breast tumours. Nature406 (6797), 747–752 (2000). - PubMed
    1. Sørlie, T. et al. Gene expression patterns of breast carcinomas distinguish tumor subclasses with clinical implications. Proc. Natl. Acad. Sci. U S A. 98 (19), 10869–10874 (2001). - PMC - PubMed