Elevated triglyceride-glucose index, a surrogate marker of insulin resistance, is associated with a high risk of obstructive sleep apnea
- PMID: 40594406
- PMCID: PMC12218047
- DOI: 10.1038/s41598-025-05268-7
Elevated triglyceride-glucose index, a surrogate marker of insulin resistance, is associated with a high risk of obstructive sleep apnea
Abstract
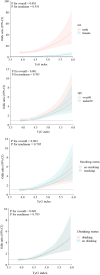
This study aimed to investigate the association between representative Insulin resistance (IR) surrogates and obstructive sleep apnea (OSA). The study consisted of 8606 adults from the Korea National Health and Nutrition Examination Survey (KNHANES, 2019-2021), a nationwide population-based database. The STOP-Bang questionnaire was used for assessing the risk of OSA. Fasting insulin concentrations, triglyceride glucose index (TyG index), and homeostasis model assessment for insulin resistance (HOMA-IR) were used as surrogate IR markers. A multivariable logistic regression and a restricted cubic spline (RCS) model were applied to examine the association between IR and OSA risk. Multivariate logistic regression analysis revealed that only TyG index (odds ratio [OR] 2.02; 95% confidence interval [CI] 1.56-2.62) was significantly associated with an increased risk of OSA. Results of the RCS analysis showed a positive nonlinear relationship between HOMA-IR and OSA risk (p for non-linearity < 0.001). Subgroup RCS analyses indicated that the effect of elevated TyG index on increasing risk of OSA was more pronounced in males, those aged over 60 years, and smokers. These findings suggest that the TyG index may be a more promising surrogate marker for identifying individuals at increased risk of OSA than other IR indicators. It may serve as a practical tool for OSA risk assessment, particularly in populations with elevated metabolic burden.
Keywords: Insulin resistance; KNHANES; Obstructive sleep apnea; STOP-Bang; Triglyceride glucose index.
© 2025. The Author(s).
Conflict of interest statement
Declarations. Competing interests: The authors declare no competing interests.
Figures


Similar articles
-
Association between insulin resistance indices and outcomes in patients with heart failure with preserved ejection fraction.Cardiovasc Diabetol. 2025 Jan 22;24(1):32. doi: 10.1186/s12933-025-02595-x. Cardiovasc Diabetol. 2025. PMID: 39844150 Free PMC article.
-
Association between various insulin resistance surrogates and gallstone disease based on national health and nutrition examination survey.Sci Rep. 2025 Jul 16;15(1):25877. doi: 10.1038/s41598-025-09482-1. Sci Rep. 2025. PMID: 40670519 Free PMC article.
-
Analysis of the nonlinear relationships between insulin resistance indicators such as LAP and TyG and depression, and population characteristics: a cross-sectional study.Eur J Med Res. 2025 Jun 23;30(1):513. doi: 10.1186/s40001-025-02802-1. Eur J Med Res. 2025. PMID: 40551244 Free PMC article.
-
Triglyceride-glucose-body mass index and the incidence of cardiovascular diseases: a meta-analysis of cohort studies.Cardiovasc Diabetol. 2025 Jan 22;24(1):34. doi: 10.1186/s12933-025-02584-0. Cardiovasc Diabetol. 2025. PMID: 39844258 Free PMC article. Review.
-
Drug therapy for obstructive sleep apnoea in adults.Cochrane Database Syst Rev. 2006 Apr 19;(2):CD003002. doi: 10.1002/14651858.CD003002.pub2. Cochrane Database Syst Rev. 2006. Update in: Cochrane Database Syst Rev. 2013 May 31;(5):CD003002. doi: 10.1002/14651858.CD003002.pub3. PMID: 16625567 Updated.
References
-
- Lam, J. C. M., Mak, J. C. W. & Ip, M. S. M. Obesity, obstructive sleep apnoea and metabolic syndrome. Respirology17, 223–236 (2012). - PubMed
-
- McNicholas, W. T., Bonsignore, M. R., & Management Committee of EU Cost Action B26. Sleep apnoea as an independent risk factor for cardiovascular disease: current evidence, basic mechanisms and research priorities. Eur. Respir. J.29, 156–178 (2007). - PubMed
-
- Arneth, B. Mechanisms of insulin resistance in patients with obesity. Endocrines5, 153–165 (2024).
MeSH terms
Substances
Grants and funding
LinkOut - more resources
Full Text Sources
Medical

