. 2025 Jul 1;15(1):20564.
doi: 10.1038/s41598-025-05662-1.

Exploring temperature-dependent transcriptomic adaptations in Yersinia pestis using direct cDNA sequencing by Oxford Nanopore Technologies

Affiliations

Exploring temperature-dependent transcriptomic adaptations in Yersinia pestis using direct cDNA sequencing by Oxford Nanopore Technologies

Brandon Robin et al. Sci Rep. .

Abstract

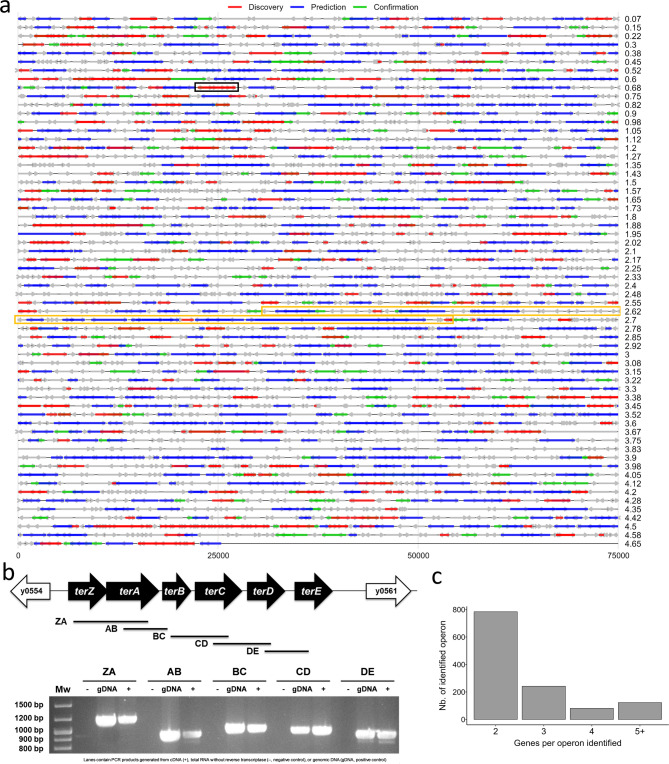
Transcriptomics is key to understanding how bacterial pathogens adapt and cause disease, but remains constrained by cost, technical, and biosafety issues, especially for highly virulent and/or regulated pathogens. Here, we present a streamlined and cost-effective RNA-Seq workflow using Oxford Nanopore Technologies for direct cDNA sequencing, suitable for complete in-house implementation. This method avoids PCR bias, enables multiplexing, and includes built-in quality controls and alignment benchmarking. Applied to Yersinia pestis (the causative agent of plague), the workflow produced an experimentally validated operon map and revealed novel transcriptional units, including within the pathogenicity island. Transcriptomic profiling at 21 °C and 37 °C, modeling the flea and mammalian environments, highlighted temperature-driven metabolic shifts, notably the upregulation of sulfur metabolism and the dmsABCD operon. These findings provide insights into Y. pestis adaptation and illustrate how long-read RNA-Seq can support operon discovery, genome annotation, and gene regulation studies in high-risk or understudied bacterial pathogens.

Keywords: Yersinia pestis; Operons mapping; Oxford Nanopore Technology; RNA-Seq; Temperature adaptation.


Conflict of interest statement

Competing interests: The authors declare no competing interests.

Figures

Fig. 1
Fig. 1
Direct cDNA sequencing workflow. The workflow comprises four main steps that include sample preparation, library preparation, sequencing, and computational data analysis. Sample preparation includes bacterial growth, cell lysis, total RNA extraction, ribosomal RNA depletion (16S and 23S), and in vitro polyadenylation to ensure compatibility with the Oxford Nanopore cDNA protocol. Library preparation involves reverse transcription with strand switching, RNA degradation, second-strand synthesis, end-repair, native barcoding, and adapter ligation. Sequencing is performed on a MinION device after flow cell priming and setup in MinKNOW, enabling real-time data acquisition. Computational analysis comprises basecalling, alignment to a reference genome, quantification of gene expression, principal component analysis (PCA), differential expression analysis (DESeq2), gene set enrichment analysis (GSEA), and operon identification. Figure created with BioRender (https://BioRender.com/k62c145).
Fig. 2
Fig. 2
Visualization of post-sequencing quality metrics using PycoQC and NanoPlot. (a) Read quality score distribution and (b) cumulative data yield were produced with PycoQC. (c) Read length distribution was generated using NanoPlot.
Fig. 3
Fig. 3
Impact of alignment tool (Bowtie vs Minimap2) on transcriptomic data variability and differential gene expression. (a) PCA of transcriptomic data processed with Bowtie and Minimap2. The ellipses represent the 95% confidence intervals around each group. Samples grown at 21 °C are shown in blue (Bowtie) and grey (Minimap2), while samples grown at 37 °C appear in orange (Bowtie) and green (Minimap2). (b) Venn diagram showing the overlap of differentially expressed genes identified by DESeq2, depending on the alignment tool used.
Fig. 4
Fig. 4
Genome-wide operon map of Y. pestis. (a) The circular chromosome of Y. pestis KIM10 + (4.6 Mb) was divided into 62 consecutive 75-kb segments to facilitate visualization of gene positions and operon organization. Grey arrows indicate individual genes not forming operons. Red, blue, and green arrows represent operons identified only in our dataset (“Discovery”), only predicted by MicrobesOnline (“Prediction”), or shared by both sources (“Confirmation”), respectively. The black and yellow boxes highlight the validated terABCDE operon and the pgm locus, respectively. (b) Experimental validation of the terABCDE operon by RT-PCR. The gene organization is illustrated schematically, with arrows showing gene orientation and black bars indicating the amplified regions (labeled ZA, AB, BC, CD, DE). These labels correspond to the bands observed on the adjacent agarose gel. Lanes contain PCR products generated from cDNA ( +), total RNA without reverse transcriptase (–, negative control), or genomic DNA (gDNA, positive control). Original gel is presented in Supplementary Fig. 2 (c) Histogram illustrating how operons are distributed according to their number of constituent genes, from two to five or more.
Fig. 5
Fig. 5
Temperature-dependent transcriptomic response of Y. pestis highlights sulfur metabolism induction at 37 °C. (a) Volcano plot illustrating gene regulation between 21 and 37 °C. Grey or black, red, and blue dots represent genes with no significant change (adjusted p-value ≥ 0.05 or − 1 < log₂ fold-change < 1), significantly upregulated (log₂ FC > 1), and downregulated (log2 FC < –1) genes, respectively. Labeled dots correspond to the 50 most regulated genes based on p-value and fold-change. (b) Functional classification of significantly regulated genes according to COG categories. Bar colors indicate upregulated (red) and downregulated (blue) genes, and numbers above bars indicate gene counts per category. (c) Gene Set Enrichment Analysis (GSEA) of differentially expressed genes using KEGG pathways. The dot plot shows pathways ranked by normalized enrichment score (NES). Dot size represents the number of genes per pathway, and color intensity reflects adjusted p-values. Most pathways were negatively enriched (left side), with the exception of sulfur metabolism, which showed positive enrichment at 37 °C. (d) KEGG sulfur metabolism pathway overlaid with gene expression data (The figure was generated based on data from the KEGG database). Genes significantly upregulated at 37 °C are labeled in red. The corresponding table lists locus tags, fold-changes, adjusted p-values, and functional annotations of the most impacted genes in this pathway.

References

    1. Bland, D. M. et al. Transcriptomic profiling of the digestive tract of the rat flea, Xenopsylla cheopis, following blood feeding and infection with Yersinia pestis. PLoS Negl. Trop. Dis.14, e0008688 (2020). - PMC - PubMed
    1. Han, Y. et al. Comparative transcriptomics in Yersinia pestis: A global view of environmental modulation of gene expression. BMC Microbiol.7, 1–16 (2007). - PMC - PubMed
    1. Vadyvaloo, V., Jarrett, C., Sturdevant, D. E., Sebbane, F. & Hinnebusch, B. J. Transit through the flea vector induces a pretransmission innate immunity resistance phenotype in Yersinia pestis. PLoS Pathog.6, e1000783 (2010). - PMC - PubMed
    1. Hu, T., Chitnis, N., Monos, D. & Dinh, A. Next-generation sequencing technologies: An overview. Hum. Immunol.82, 801–811 (2021). - PubMed
    1. Pastorino, B., de Lamballerie, X. & Charrel, R. Biosafety and biosecurity in European containment level 3 laboratories: Focus on French recent progress and essential requirements. Front. Public Health5, 257554 (2017). - PMC - PubMed

MeSH terms

Substances

LinkOut - more resources