. 2025 Jul 1;15(1):21175.
doi: 10.1038/s41598-025-05377-3.

A 22 month prospective assessment of neutralizing and IgG antibody levels against SARS-CoV-2 variants following homologous and heterologous BNT162b2 boosting

Affiliations

A 22 month prospective assessment of neutralizing and IgG antibody levels against SARS-CoV-2 variants following homologous and heterologous BNT162b2 boosting

Aini Syahida Mat Yassim et al. Sci Rep. .

Abstract

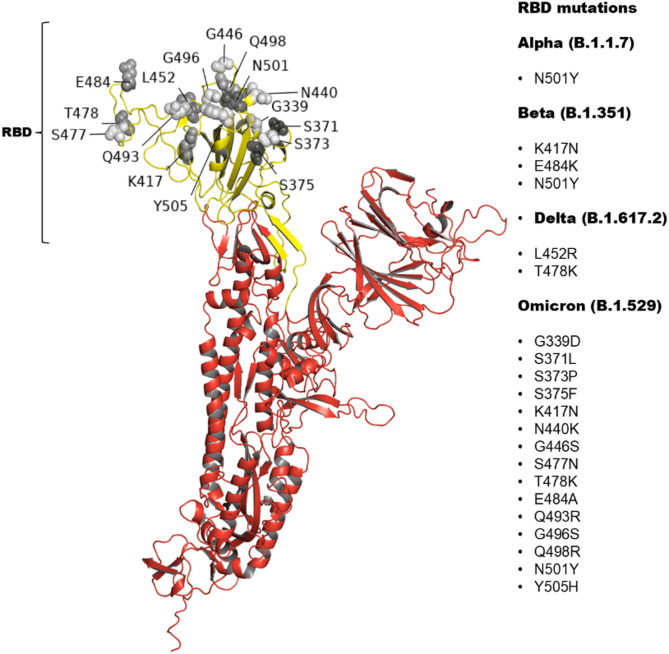
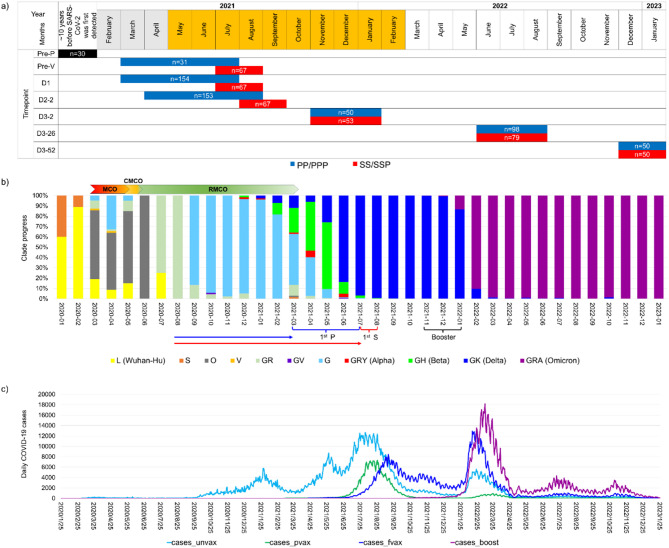
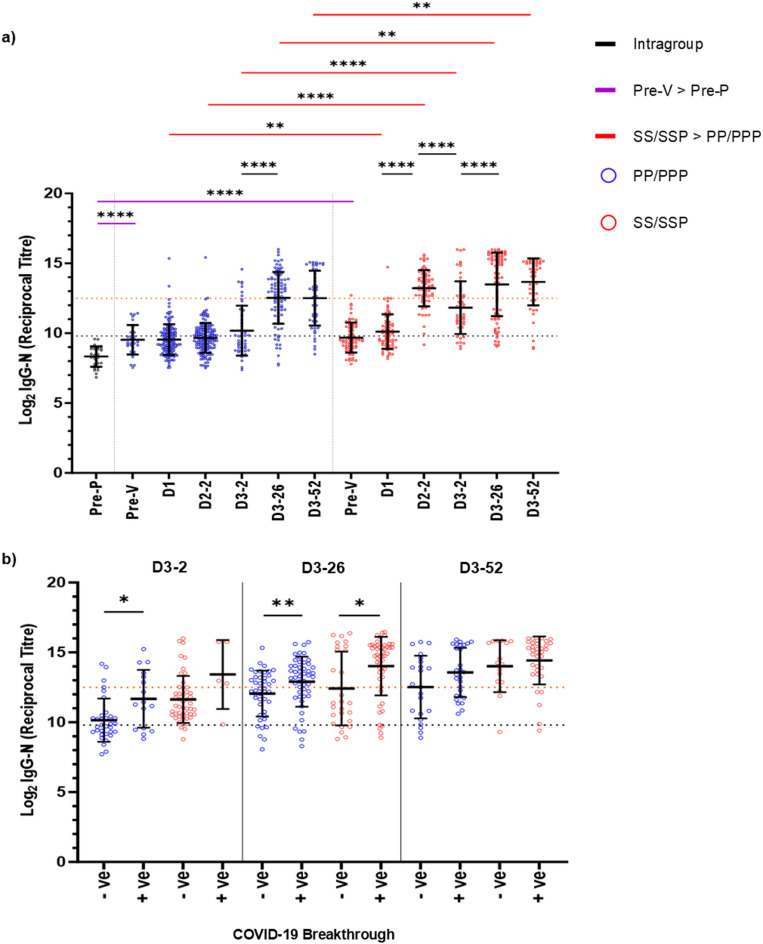
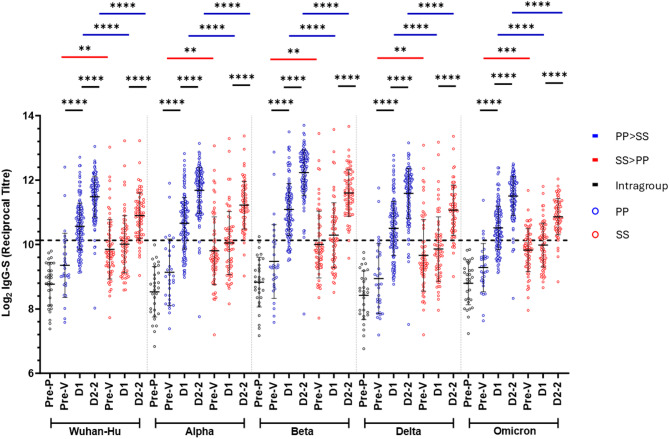
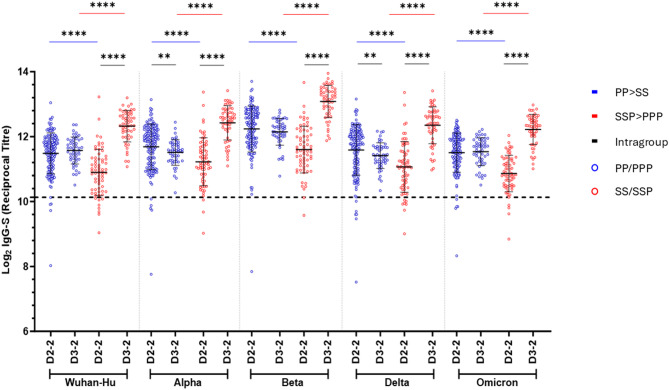
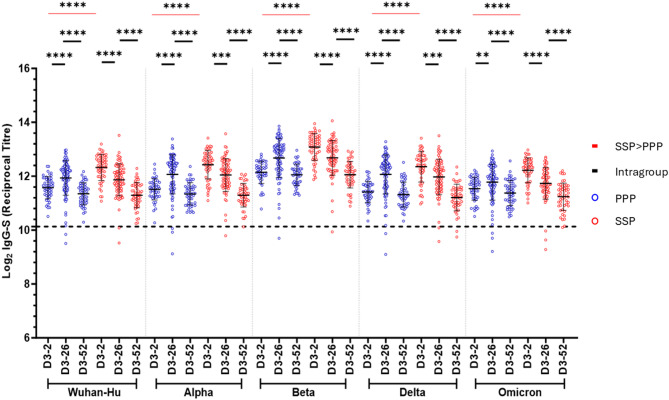
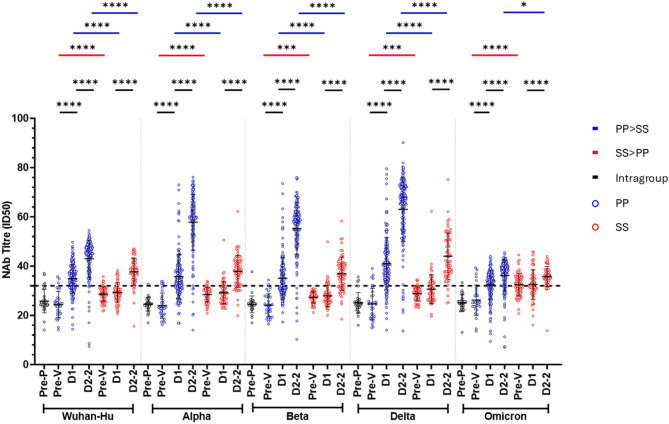
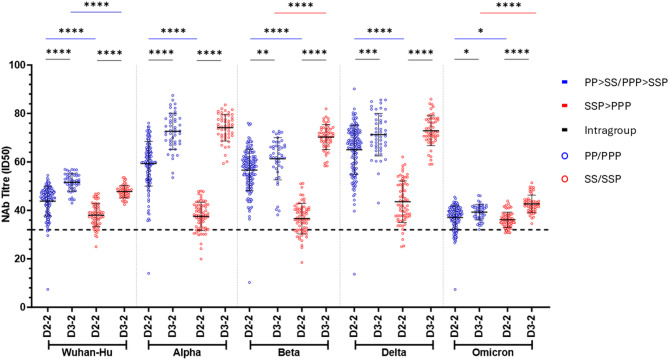
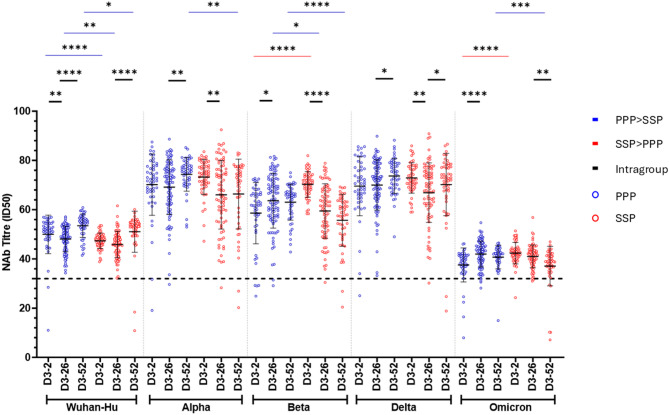
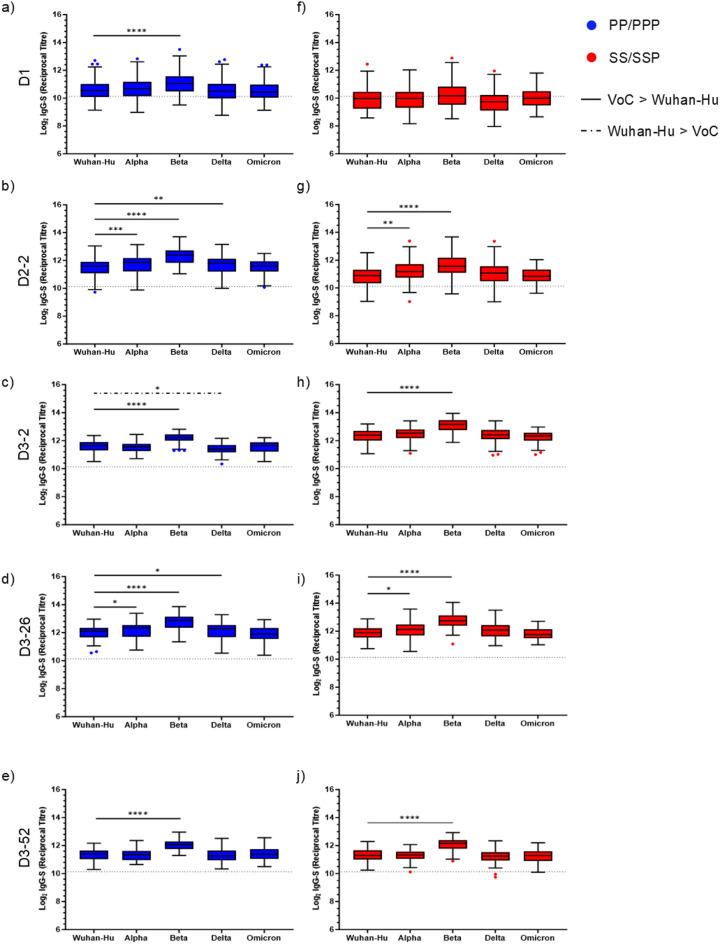
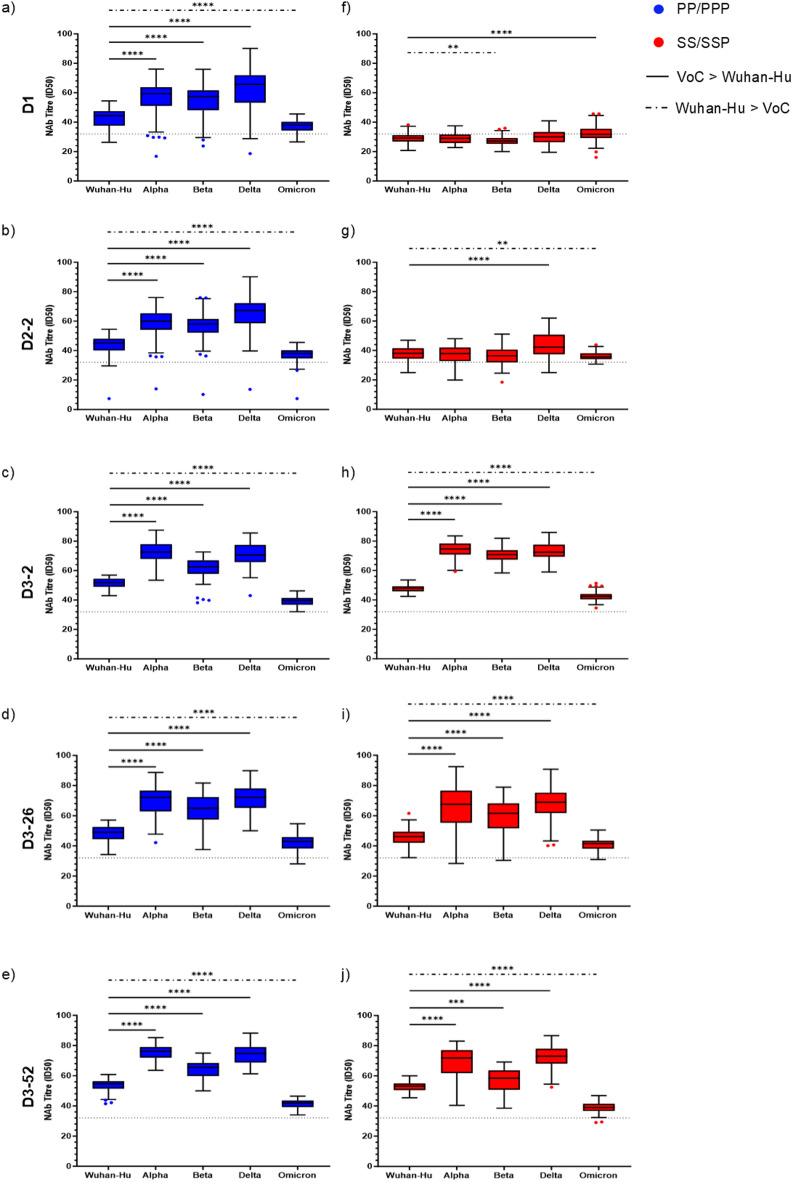
This 22-month cohort study investigated the durability and dynamics of humoral immune responses in 327 Malaysians vaccinated with either CoronaVac or BNT162b2 in early 2021, monitored up to 52 weeks following a BNT162b2 booster. Using the ImmuSAFE™ COVID + microarray, we evaluated IgG-S and NAb against Wuhan-Hu and VoCs (Alpha, Beta, Delta, Omicron), as well as IgG-N responses to Wuhan-Hu. BNT162b2 induced higher IgG-S levels and seropositivity than CoronaVac after primary immunization. While a heterologous CoronaVac-BNT162b2 temporarily increased IgG-S levels, long-term IgG-S levels and seropositivity remained comparable between the two groups across all variants. NAb levels were higher in BNT162b2 recipients than in CoronaVac recipients, with homologous BNT162b2 boosters sustaining higher NAb levels for Wuhan-Hu compared to heterologous BNT162b2-CoronaVac. However, responses to other variants varied. Expectedly, CoronaVac uniquely induced IgG-N responses, resulting in elevated IgG-N levels in heterologous BNT162b2-CoronaVac recipients compared to homologous BNT162b2 recipients. Overall, BNT162b2 boosters conferred robust and durable antibody responses regardless of the primary vaccine used. Higher IgG-N levels prior to immunization, compared to pre-pandemic levels, suggest that prior exposure to circulating SARS-CoV-2 VoCs (other than Wuhan-Hu) in Malaysia shaped immune imprinting, influencing responses before immunization with the Wuhan-Hu-based vaccine. Consequently, this study reports higher IgG-S and NAb levels against VoCs-except Omicron-compared to Wuhan-Hu after COVID-19 vaccination.

Keywords: BNT162b2; CoronaVac; Homologous and heterologous booster; IgG-S and IgG-N antibodies; Neutralizing antibodies; Variants of concern.


Conflict of interest statement

Declarations. Competing interests: NDA, T-MT are employees of Sengenics Corporation. All authors declare no financial or non-financial competing interests.

Figures

Fig. 1
Fig. 1
Mutational landscape of the RBD across SARS-CoV-2 VoCs. The cartoon structure depicts the monomeric S protein of the original Wuhan-Hu strain, with the RBD highlighted in yellow. Spheres represent the positions of amino acids within the Wuhan-Hu RBD where missense mutations have been identified in the Alpha (B.1.1.7), Beta (B.1.351), Delta (B.1.617.2), and Omicron (B.1.529) variants. The mutation sites for each variant are listed in the right panel. Key mutations include N501Y (shared by Alpha, Beta, and Omicron), K417N (Beta and Omicron), T478K (Delta and Omicron), and L452R (Delta). These mutations are distributed throughout the RBD and may affect its interaction with the ACE2 receptor, potentially enhancing viral infectivity and facilitating immune escape. The 3D structure model of the Wuhan-Hu monomeric S protein was generated using the PyMOL Molecular Graphics System, Version 3.0 (Schrödinger, LLC) using PDB: 7ZH5.
Fig. 2
Fig. 2
Blood collection timeline for 327 cohort participants, SARS-CoV-2 clade progression, and daily COVID-19 cases in Malaysia (January 2020–January 2023). (a) A total of 1076 serum samples were collected from 327 cohort participants at multiple time points across two vaccine regimens. The “PP/PPP” group (blue) represents individuals receiving two doses of BNT162b2 followed by a homologous BNT162b2 booster, while the “SS/SSP” group (red) received two doses of CoronaVac followed by a heterologous BNT162b2 booster. Blood collection months are indicated, with “n” values showing the number of participants sampled at each time point. Phase 1 of Malaysia’s COVID-19 immunization campaign (highlighted in grey) ran from February to April 2021, targeting healthcare frontliners, essential workers, and defense/security personnel. Phase 3 (highlighted in gold) ran from May 2021 to February 2022, focusing on the general adult population (≥ 18 years). Phase 2 (April–August 2021), not highlighted, included senior citizens (≥ 60 years), individuals with chronic illnesses, and persons with disabilities. (b) SARS-CoV-2 clade progression in Malaysia was analyzed using 11,325 genomic sequences retrieved from GISAID (as of May 18, 2024) spanning January 1, 2020, to January 31, 2023. Clades were classified using GISAID nomenclature: L (early clade, WIV04 reference), S, O, V, GR, GV, G, GRY (Alpha), GH (Beta), GK (Delta), and GRA (Omicron). Mass immunization using Wuhan-Hu-based vaccines began approximately 8–12 months after the last detection of clade L in July 2020 for the PPP group (blue arrow) and 12–13 months later for the SSP group (red arrow). (c) Daily COVID-19 case counts in Malaysia were categorized by vaccination status, based on data from KKMNOW. Categories include cases without vaccination records (cases_unvax), cases with at least one vaccine dose but not fully vaccinated (cases_pvax), cases fully vaccinated (≥ 14 days post-second dose of a two-dose vaccine or ≥ 28 days post-single-dose vaccine; cases_fvax), and cases boosted (≥ 7 days post-booster dose; cases_boost). The dataset was retrieved from KKMNOW-Daily COVID-19 cases by vaccination status and state on October 1, 2024.
Fig. 3
Fig. 3
(a) IgG-N levels following primary immunization with BNT162b2 (blue) or CoronaVac (red) tracked up to 52 weeks post-BNT162b2 booster. The black dotted line represents the IgG-N cut-off, calculated as the mean + 2 SD of the Pre-P group (black dots). The median IgG-N level from multi-ethnic COVID-19 patients with mild symptoms, based on ImmuSAFE™ COVID + microarray datais shown as an orange dotted line. (b) IgG-N levels in individuals with self-reported breakthrough COVID-19 infection with mild symptoms, category 2a after the booster dose compared to those without reported infection. Statistical analysis was conducted using the Mann–Whitney U test to compare IgG-N levels at different time points within each vaccine regimen (Pre-V vs. D1, D1 vs. D2-2, D2-2 vs. D3-2, D3-2 vs. D3-26, and D3-26 vs. D3-52), as well as between Pre-P and Pre-V, homologous (PP/PPP) and heterologous (SS/SSP) regimens at the same time points (e.g., PP/PPP Pre-V vs. SS/SSP Pre-V), and breakthrough-positive (+ ve) versus breakthrough-negative (− ve) groups (*p < 0.05, **p < 0.01, ****p < 0.0001; non-significant differences not shown). Each dot represents an individual participant, and bars indicate the mean with SD. Statistical significance is denoted by purple lines (higher IgG-N levels in Pre-V vs. Pre-P), red lines (higher IgG-N levels in SS/SSP vs. PP/PPP), and black lines (intragroup comparisons over time in Fig. 3a or between breakthrough-positive and breakthrough-negative groups in Fig. 3b). PP primary doses of BNT162b2, SS primary doses of CoronaVac, PPP homologous BNT162b2 booster, SSP heterologous BNT162b2 booster following CoronaVac.
Fig. 4
Fig. 4
IgG-S levels during the primary immunization series with BNT162b2 (blue) or CoronaVac (red), from pre-vaccination to two weeks after the second dose. The black horizontal dotted line indicates the IgG-S cut-off, calculated as the mean + 2 SD of the Pre-P group (black dots) across all variants. Statistical analysis was conducted using the Mann–Whitney U test to compare IgG-S levels at different time points within each vaccine regimen (Pre-V vs. D1, D1 vs. D2-2), as well as between BNT162b2 (PP) and CoronaVac (SS) regimens at the same time points (e.g., PP Pre-V vs. SS Pre-V) (**p < 0.01, ***p < 0.001, ****p < 0.0001; non-significant differences not shown). Each dot represents an individual participant; bars represent the mean with SD. Statistical significance is marked with blue lines (Higher IgG-S levels in PP compared to SS), red lines (Higher IgG-S levels in SS compared to PP), and black lines (Intragroup comparisons at different time points). PP Primary doses of BNT162b2, SS Primary doses of CoronaVac.
Fig. 5
Fig. 5
IgG-S levels 2 weeks after completing a two-dose series with BNT162b2 or CoronaVac and 2 weeks after the homologous and heterologous BNT162b2 booster, in the PPP group (blue) and SSP group (red) (D2-2 and D3-2), respectively. The black horizontal dotted line represents the IgG-S cut-off, calculated as the mean + 2 SD of the Pre-P group (black dots) across all variants. Statistical analysis was conducted using the Mann–Whitney U test to compare IgG-S levels at different time points within each vaccine regimen (D2-2 vs. D3-2), as well as between homologous (PP/PPP) and heterologous (SS/SSP) regimens at the same time points (e.g., PPP D3-2 vs. SSP D3-2) (**p < 0.01, ****p < 0.0001; non-significant differences not shown). Each dot represents an individual participant; bars represent the mean with SD. Statistical significance is marked with blue lines (Higher IgG-S levels in PPP compared to SSP), red lines (Higher IgG-S levels in SSP compared to PPP), and black lines (Intragroup comparisons at different time points). PP Primary doses of BNT162b2, SS Primary doses of CoronaVac, PPP Homologous BNT162b2 booster, SSP Heterologous BNT162b2 booster after CoronaVac.
Fig. 6
Fig. 6
IgG-S levels at 2, 26, and 52 weeks post-BNT162b2 homologous or heterologous booster, in the PPP group (blue) and SSP group (red), respectively. The black horizontal dotted line represents the IgG-S cut-off, calculated as the mean + 2 SD of the Pre-P group (black dots) across all variants. Statistical analysis was conducted using the Mann-Whitney U test to compare IgG-S levels at different time points within each vaccine regimen (D3-2 vs. D3-26, D3-26 vs. D3-52), as well as between homologous (PPP) and heterologous (SSP) regimens at the same time points (e.g., PPP D3-26 vs. SSP D3-26) (**p < 0.01, ***p < 0.001, ****p < 0.0001; non-significant differences not shown). Each dot represents an individual participant; bars represent the mean with SD. Statistical significance is marked with red lines (Higher IgG-S levels in SSP compared to PPP) and black lines (Intragroup comparisons across time points). PPP Homologous BNT162b2 booster, SSP Heterologous BNT162b2 booster after CoronaVac.
Fig. 7
Fig. 7
NAb titers following primary immunization with BNT162b2 (blue) or CoronaVac (red), monitored from pre-vaccination to two weeks after the second dose. The black horizontal dotted line represents the NAb titer cut-off, calculated as the mean + 2 SD of the Pre-P group (black dots) across all variants. Statistical analysis was conducted using the Mann-Whitney U test to compare NAb titre at different time points within each vaccine regimen (Pre-V vs. D1, D1 vs. D2-2), as well as between BNT162b2 (PP) and CoronaVac (SS) regimens at the same time points (e.g., PP Pre-V vs. SS Pre-V) (*p < 0.05, ***p < 0.001, ****p < 0.0001; non-significant differences not shown). Each dot represents an individual participant, with bars showing the mean with SD. Statistical significance is indicated by blue lines (Higher NAb titers in PP compared to SS), red lines (Higher NAb titers in SS compared to PP), and black lines (Intragroup comparisons across time points). PP Primary doses of BNT162b2, SS Primary doses of CoronaVac.
Fig. 8
Fig. 8
NAb titers two weeks after completing a two-dose series with BNT162b2 or CoronaVac, and two weeks after homologous (PPP; blue) or heterologous (SSP; red) BNT162b2 booster (D2-2 and D3-2). The black horizontal dotted line indicates the NAb titer cut-off, calculated as the mean + 2 SD of the Pre-P group (black dots) across all variants. Statistical analysis was conducted using the Mann–Whitney U test to compare NAb titre at different time points within each vaccine regimen (D2-2 vs. D3-2), as well as between homologous (PP/PPP) and heterologous (SS/SSP) regimens at the same time points (e.g., PPP D3-2 vs. SSP D3-2) test (*p < 0.05, **p < 0.01, ***p < 0.001, ****p < 0.0001; non-significant differences not shown). Each dot represents an individual participant; bars represent the mean with SD. Statistical significance is marked with blue lines (Higher NAb titers in PPP compared to SSP), red lines (Higher NAb titers in SSP compared to PPP), and black lines (Intragroup comparisons across time points). PP Primary doses of BNT162b2, SS Primary doses of CoronaVac, PPP Homologous BNT162b2 boost, SSP Heterologous BNT162b2 boost after CoronaVac.
Fig. 9
Fig. 9
NAb titers at 2-, 26-, and 52-weeks post-homologous or -heterologous booster with BNT162b2, in the PPP group (blue) and SSP group (red), respectively. The black horizontal dotted line indicates the NAb titer cut-off, calculated as the mean + 2 SD of the Pre-P group (black dots) across all variants. Statistical analysis was conducted using the Mann–Whitney U test to compare NAb titre at different time points within each vaccine regimen (D3-2 vs. D3-26, D3-26 vs. D3-52), as well as between homologous (PPP) and heterologous (SSP) regimens at the same time points (e.g., PPP D3-26 vs. SSP D3-26) (*p < 0.05, **p < 0.01, ***p < 0.001, ****p < 0.0001; non-significant differences are not shown). Each dot represents an individual participant; bars represent the mean with SD. Statistical significance is indicated by blue lines (Higher NAb titers in PPP compared to SSP), red lines (Higher NAb titers in SSP compared to PPP), and black lines (Intragroup comparisons across time points). PP Primary doses of BNT162b2, SS Primary doses of CoronaVac, PPP Homologous BNT162b2 boost, SSP Heterologous BNT162b2 boost after CoronaVac.
Fig. 10
Fig. 10
IgG-S level against Wuhan-Hu and VoCs following COVID-19 vaccination in PP/PPP (blue, BNT162b2 primary and homologous boost) and SS/SSP (red, CoronaVac primary and heterologous BNT162b2 boost) groups. (a,f) IgG-S level 21 days after the first dose of BNT162b2 (a) or CoronaVac (f). (b,g) Two weeks after the second dose of BNT162b2 (b) or CoronaVac (b). (c,h) Two weeks post-boost (BNT162b2 homologous or heterologous). (d,i) IgG-S level at 26 weeks post-boost. (e,j) IgG-S level at 52 weeks post-boost. Data were displayed as Tukey box plots (median, Q1 and Q3 quartiles), with outliers identified and excluded using the ROUT method (Q = 10%). Each dot represents an individual participant. Statistical analysis was performed using the Mann–Whitney U test. *p < 0.05, **p < 0.01, ***p < 0.001, ****p < 0.0001; non-significant differences are not shown. Solid black lines indicate significantly higher IgG-S levels against VoCs compared to Wuhan-Hu, while dotted lines show the reverse.
Fig. 11
Fig. 11
NAb titers against Wuhan-Hu and VoCs following COVID-19 vaccination in PP/PPP (blue, BNT162b2 primary and homologous boost) and SS/SSP (red, CoronaVac primary and heterologous BNT162b2 boost) groups. (a,f) NAb responses 21 days after the first dose of BNT162b2 (a) or CoronaVac (f). (b,g) Two weeks after the second dose of BNT162b2 (b) or CoronaVac (g). (c,h) Two weeks post-boost (BNT162b2 homologous or heterologous). (d,i) NAb responses at 26 weeks post-boost. (e,j) NAb responses at 52 weeks post-boost. Data were displayed as Tukey box plots (median, Q1 and Q3 quartiles), with outliers identified and excluded using the ROUT method (Q = 10%). Each dot represents an individual participant. Statistical analysis was performed using the Mann–Whitney U test. *p < 0.05, **p < 0.01, ***p < 0.001, ****p < 0.0001; non-significant differences are not shown. Solid black lines indicate significantly higher NAb titers against VoCs compared to Wuhan-Hu, while dotted lines show the reverse.

Similar articles

References

    1. Li, M. et al. COVID-19 vaccine development: milestones, lessons and prospects. Signal. Transduct. Target. Ther.7, 146 (2022). - PMC - PubMed
    1. Elengoe, A. COVID-19 outbreak in Malaysia. Osong Public. Health Res. Perspect.11, 93–100 (2020). - PMC - PubMed
    1. Tin, T. P. COVID-19 cases and deaths by age (Jan 2020–Feb 3, - CodeBlue. (2023). https://codeblue.galencentre.org/2023/02/covid-19-cases-and-deaths-by-ag... (2023).
    1. Tan, C. S., Lokman, S., Rao, Y., Kok, S. H. & Ming, L. C. Public and private sectors collective response to combat COVID-19 in Malaysia. J. Pharm. Policy Pract.14, 40 (2021). - PMC - PubMed
    1. Bernama DCA approves conditional registration for Vero Cell vaccine. New Straits Times Online (2021). https://www.nst.com.my/news/nation/2021/04/684816/dca-approves-condition....

MeSH terms

Supplementary concepts