. 2025 Jul 2;15(1):22965.
doi: 10.1038/s41598-025-07215-y.

Molecular docking and biological evaluation of a novel IWS1 inhibitor for the treatment of human retroperitoneal liposarcoma

Affiliations

Molecular docking and biological evaluation of a novel IWS1 inhibitor for the treatment of human retroperitoneal liposarcoma

Marina Goryunova et al. Sci Rep. .

Abstract

IWS1 is a key assembly factor of the RNA polymerase II (RNAPII) elongation complex, and its overexpression is associated with worse outcomes in patients with liposarcoma (LPS). This study aimed to identify compounds that can disrupt the IWS1/Spt6 interaction and assess their biological effects in dedifferentiated LPS (DDLPS). Using the AlphaFold-predicted structure of IWS1, we identified a core binding region (AA 545-694) for its interaction with Spt6. Through molecular modeling and virtual screening, Ketotifen and Desloratadine were predicted as candidate inhibitors. Both were predicted to mimic Spt6 phenylalanine (F217) and disrupt the complex, which was confirmed by co-immunoprecipitation. Functional assays showed that treatment with either compound reduced migration, invasion, and spheroid formation in DDLPS cell lines. Additionally, increased nuclear localization of IWS1 was observed. These findings suggest Ketotifen and Desloratadine as promising inhibitors of the IWS1/Spt6 interaction, with potential applications in reducing the invasive properties of human LPS.


Conflict of interest statement

Declarations. Competing interests: The authors declare no competing interests.

Figures

Fig. 1
Fig. 1
Representative compounds of specified drug classes (ae) that were ranked by the predicted binding affinity as the top 5% (approximately the 80 ligands with the best 80 Vina docking scores) in the preliminary virtual screening. (fi) The predicted binding modes and the protein-ligand interaction diagrams of Ketotifen and Desloratadine. In the 3D structures, the protein receptor IWS1 is colored green. The assumed position of Spt6 in the IWS1/Spt6 is generated by aligning the receptor structure and IWS1 in a known experimental structure of the IWS1/Spt6 complex (PDB ID: 2XPO). Spt6 is colored in blue and the conserved, to-be-replaced phenylalanine residue of Spt6 is shown in the licorice drawing style as it overlaps with docked ligands. (f) The 3D structure of the top-scored pose of Ketotifen which is colored cyan. (g) The protein-ligand interaction diagram for the top-scored pose of Ketotifen. (h) The 3D structure of the top-scored pose of Desloratadine which is colored red. (i) The protein-ligand interaction diagram for the top-scored pose of Desloratadine.
Fig. 2
Fig. 2
Co-Immunoprecipitation assays showing disruption of IWS1/Spt6 complex after 48-hour treatment with 20 µM Ketotifen (a) or 5 µM Desloratadine (b) and respective quantified data (c,d). IgG isotype control, M marker, Ab antibody. Western blot images are representatives of two (n = 2) independent experiments. Bar diagrams presented in (c,d) represent the densitometry-based quantification of bands obtained in the western blot representative experiment presented in (a,b). Protein extracts (Input) were immunoprecipitated with IWS1 (column IWS1) or Spt6 (column Spt6) antibody and resolved by SDS-PAGE. Protein-protein interactions were immunodetected using IWS1, Spt6, and LEDGF antibodies. Since samples immunoprecipitated with IWS1 or Spt6 antibodies were subsequently immunodetected with Spt6 and IWS1 antibodies, overexposure naturally occurred for samples immunoprecipitated and immunodetected with the antibody against the same protein representing both the protein in the complex as well as free protein. Samples immunoprecipitated with IWS1 antibody and immunodetected with Spt6 antibody (or immunoprecipitated with Spt6 antibody and immunodetected with IWS1 antibody) demonstrate the protein in the complex only. The blots were cropped for the presentation of target bands, and the original blots with multiple exposures are presented in Supplementary data (Figure S7).
Fig. 3
Fig. 3
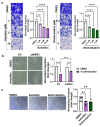
Drug effect on cell migration and invasion. (a) Dose-dependent decrease in migratory ability of Lipo863 cells after 48-hour treatment with Ketotifen and Desloratadine. Scale bar: 100 μm. (b) Decrease in migratory ability of shIWS1 cells and EV (non-target shRNA control) of Lipo863 cell line after 24-hour treatment with 10 µM Ketotifen. Scale bar: 530 μm. (c) Drug effect on cell invasion. Decrease in invasion of Lipo246 cell line after 48-hour treatment with 20 µM Ketotifen or 4 µM Desloratadine. Scale bar: 200 μm. Cells were treated with drugs for 48 h prior to 24-hour transwell migration or invasion assays. One-way ANOVA with multiple comparisons (a, c) or two-way ANOVA with multiple comparisons (b) was applied. The normalized migration of cells is displayed as mean, each error bar represents the standard deviation (SD) from the mean value from two (n = 2) (a, b) or three (n = 3) (c) biological replicates, each biological replicate is presented as three black dots representing technical replicates. **p < 0.01, ***p < 0.001, ****p < 0.0001.
Fig. 4
Fig. 4
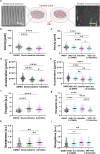
Lipo863 cells exhibit reduced invasiveness in response to drug treatment on aligned structural cues. (a) SEM micrograph of the PDMS-patterned surface designed to influence cell behavior upon drug treatment, showing cell alignment along the patterned surface after 24 h. Single cells were tracked, and their motility parameters were quantified from their migration patterns. Quantification of (b-c) velocity, (d-e) acceleration, (f-g) elongation, and (h-i) straightness, demonstrates a reduction in velocity and acceleration, along with increased elongation and directional persistence (straightness), suggesting a lower motility rate of the drug-treated cells on aligned surfaces. (n = ~ 200). All error bars are shown as SEM *p < 0.05, **p < 0.01, ****p < 0.0001, One-way ANOVA was applied followed by Tukey’s multiple comparisons test for post hoc analysis.
Fig. 5
Fig. 5
Representative microscopic images of spheroids of Lipo863 cells after 14-day treatment with 20 µM Ketotifen and 5 µM Desloratadine. Spheroids in treatment groups are characterized by smaller diameter. Microscopic images are representatives of two (n = 2) independent experiments with Lipo863 cell line. Additionally, two (n = 2) independent experiments were conducted with Lipo224 cell line, and the results are presented in Supplementary data (Figure S6). One-way ANOVA with multiple comparisons was applied. Bar diagram represents the mean of spheroid diameter from one experiment, each black dot represents one spheroid. Each error bar represents the standard deviation (SD) from the mean value. Scale bar: 200 μm in images with x5 magnification and 50 μm in images with x20 magnification. ***p < 0.001, ****p < 0.0001.
Fig. 6
Fig. 6
Separation of nuclear and cytoplasmic proteins of Lipo863 cells after 48-hour treatment with 20 µM Ketotifen and 5 µM Desloratadine. Subcellular fractions are abbreviated as W for whole cell lysate, C for cytoplasmic fraction and N for nuclear fraction. The upper panel shows immunoblotting results for IWS1, the middle panel for nuclear marker Lamin A/C, and the lower panel for cytoplasmic marker GAPDH. The ratio of nuclear fraction to whole cell lysate of IWS1 expression was increased by 0.38 for 20 µM Ketotifen and by 0.56 for 5 µM Desloratadine compared to DMSO with a ratio of 0.27. Western blot image is a representative of two (n = 2) independent experiments. Western blot bands presented in the figure were quantified by densitometry, and the ratio of nuclear fraction (N) to whole cell lysate (W) was calculated and presented in the bar. The Nuclear/Whole ratio is displayed as mean with black dots representing individual ratios from two independent experiments; each error bar represents the standard deviation (SD). The blots were cropped for presentation of target bands, and the original blots of two independent experiments with their corresponding densitometry analysis are presented in Supplementary data (Figure S8).

Similar articles

References

    1. Conyers, R., Young, S. & Thomas, D. M. Liposarcoma: molecular genetics and therapeutics. Sarcoma2011 (483154). 10.1155/2011/483154 (2011). - PMC - PubMed
    1. Sbaraglia, M., Bellan, E. & Dei Tos, A. P. The 2020 WHO classification of soft tissue tumours: news and perspectives. Pathologica113, 70–84. 10.32074/1591-951x-213 (2021). - PMC - PubMed
    1. Traweek, R. S. et al. Targeting the MDM2-p53 pathway in dedifferentiated liposarcoma. Front. Oncol.12, 1006959. 10.3389/fonc.2022.1006959 (2022). - PMC - PubMed
    1. Gootee, J. M. et al. Treatment facility: an important prognostic factor for dedifferentiated liposarcoma survival. Fed. Pract.36, S34–s41 (2019). - PMC - PubMed
    1. Hu, X. et al. Recurrence of locally invasive retroperitoneal dedifferentiated liposarcoma shortly after surgery: A case report and literature review. Med. (Baltim).103, e37604. 10.1097/md.0000000000037604 (2024). - PMC - PubMed

MeSH terms

LinkOut - more resources