

The construction of HMME-PDT efficacy prediction model for port-wine stain based on machine learning algorithms
- PMID: 40594548
- PMCID: PMC12214480
- DOI: 10.1038/s41598-025-06589-3
The construction of HMME-PDT efficacy prediction model for port-wine stain based on machine learning algorithms
Abstract
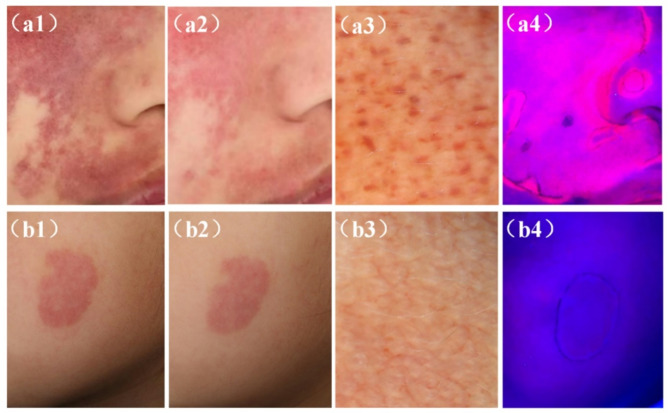
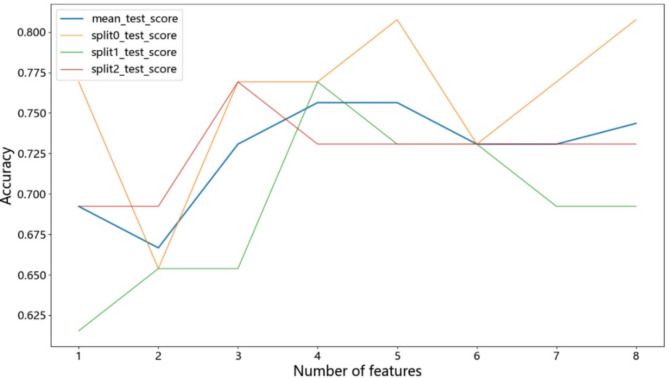
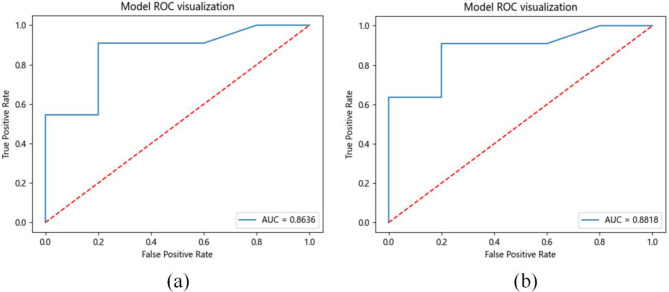
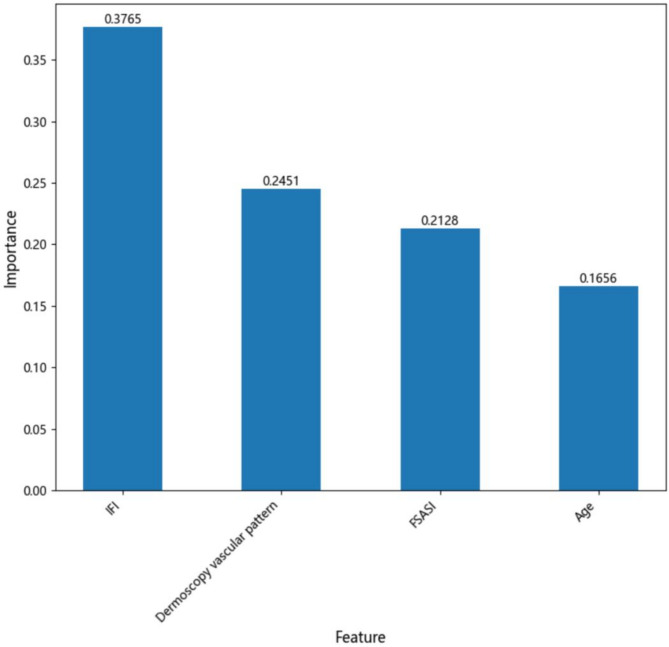
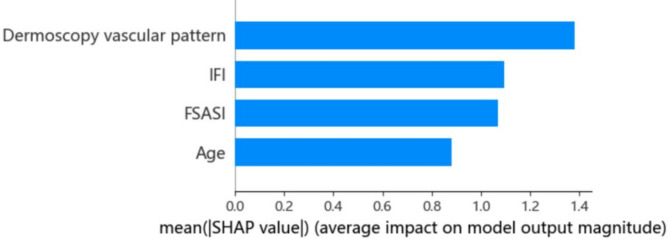
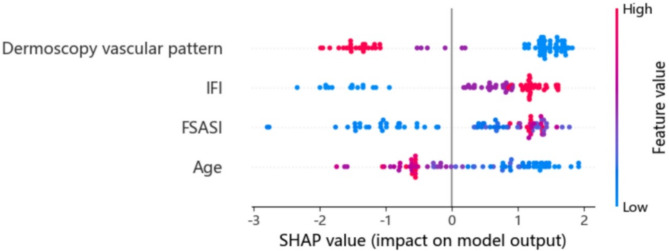
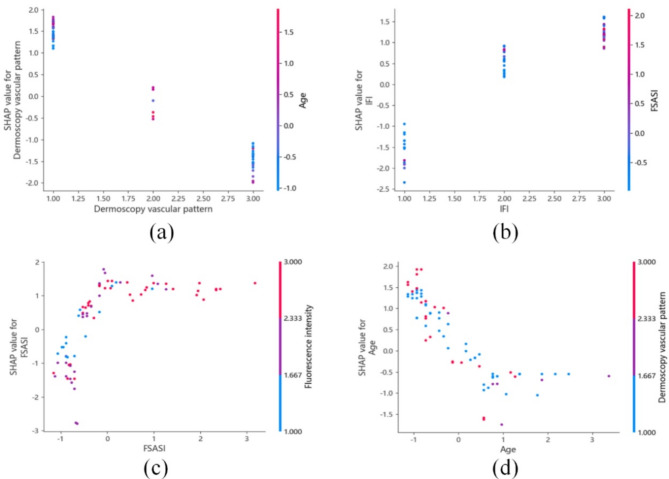
Hematoporphyrin monomethyl ether-photodynamic therapy (HMME-PDT) is a safe and effective treatment for port-wine stain (PWS). Comprehensive methods for predicting HMME-PDT efficacy based on clinical factors are lacking. This study aims to develop and validate two machine learning models to predict the therapeutic effect of HMME-PDT for PWS. We conducted a retrospective study of 131 facial PWS patients treated with single HMME-PDT at the Second Xiangya Hospital from May 2022 to January 2025. The patients were divided into the training cohort and the validation cohort based on the order of their enrollment. Key clinical features were selected using recursive feature elimination (RFE). We developed and validated prediction models with Extreme Gradient Boosting (XGBoost) and Random Forest (RF) algorithms. Model performance was assessed using confusion matrix and evaluation metrics. RFE identified the top predictive factors: dermoscopy vascular pattern, immediate fluorescence intensity (IFI) after HMME-PDT, the facial port-wine stain area and severity index score, and age. In the training cohort, both models demonstrated strong predictive performance, with accuracies, F1 scores, and AUC values exceeding 0.8. The XGBoost model outperformed with an accuracy of 0.8750, F1 score of 0.8750, and AUC of 0.8636. In the validation cohort, XGBoost model achieved an accuracy and F1 score both greater than 0.73, with an AUC value of 0.7672. It had the better comprehensive performance. Our findings suggest these models are promising for predicting HMME-PDT efficacy in PWS. This is the first study to explore IFI after HMME-PDT in efficacy assessment.
Keywords: Efficacy prediction model; HMME-PDT; Immediate fluorescence intensity at the lesion site after HMME-PDT; Machine learning algorithms; Port-wine stain.
© 2025. The Author(s).
Conflict of interest statement
Declarations. Competing interests: The authors declare no competing interests. Ethical approval: This study was approved by the clinical research ethics committee of Second Xiangya Hospital of Central South University (LYEC2024-K0152). The research was performed in accordance with the principles of the Declaration of Helsinki. Written informed consent was obtained from all patients before treatment. The patients mentioned in this manuscript have given written informed consent to the release of images that may lead to identification. Specially, minor patients was obtained consent from their parents and legal guardians.
Figures
Similar articles
-
Comparison of the effects of hemoporfin-mediated photodynamic and Vbeam pulsed dye laser in the treatment of port-wine stains: a retrospective analysis.Eur J Med Res. 2025 Jul 1;30(1):533. doi: 10.1186/s40001-025-02820-z. Eur J Med Res. 2025. PMID: 40597426 Free PMC article.
-
Possible Number of Recommended Sessions and Influential Factors of Hematoporphyrin Monomethyl Ether Photodynamic Therapy for Pulsed Dye Laser-Resistant Facial Port-Wine Stain.Lasers Surg Med. 2025 Apr;57(4):312-320. doi: 10.1002/lsm.70003. Epub 2025 Mar 17. Lasers Surg Med. 2025. PMID: 40098285
-
Retrospective analysis of the correlation between dermoscopic vascular features and the response to hemoporfin-mediated photodynamic therapy in previously untreated children with port wine stains.Photodiagnosis Photodyn Ther. 2025 Aug;54:104691. doi: 10.1016/j.pdpdt.2025.104691. Epub 2025 Jun 25. Photodiagnosis Photodyn Ther. 2025. PMID: 40578726
-
Clinical study on clinical operation and post-treatment reactions of HMME-PDT in treatment of PWS.Photodiagnosis Photodyn Ther. 2017 Dec;20:253-256. doi: 10.1016/j.pdpdt.2017.09.013. Epub 2017 Oct 24. Photodiagnosis Photodyn Ther. 2017. PMID: 29079350 Review.
-
Recent progress in hematoporphyrin monomethyl ether-photodynamic therapy for port-wine stains: updates and insights.Arch Dermatol Res. 2024 Nov 16;317(1):28. doi: 10.1007/s00403-024-03531-x. Arch Dermatol Res. 2024. PMID: 39549139 Review.
References
-
- Cordoro, K. M. et al. Physiologic changes in vascular birthmarks during early infancy: mechanisms and clinical implications. J. Am. Acad. Dermatol.60(4), 669–675 (2009). - PubMed
-
- Huikeshoven, M. et al. Redarkening of port-wine stains 10 years after pulsed-dye-laser treatment. N Engl. J. Med.356(12), 1235–1240 (2007). - PubMed
-
- Zhang, X. et al. Hemoporfin-mediated photodynamic therapy for the treatment of port-wine stain: A multicenter, retrospective study. Photodiagnosis Photodyn Ther.42, 103545 (2023). - PubMed
MeSH terms
Substances
Grants and funding
- No. 82373486/National Natural Science Foundation of China
- No. 82373486/National Natural Science Foundation of China
- No. 82373486/National Natural Science Foundation of China
- No. 82373486/National Natural Science Foundation of China
- No. 82373486/National Natural Science Foundation of China
- No. 82373486/National Natural Science Foundation of China
- No. 82373486/National Natural Science Foundation of China
- No. 82373486/National Natural Science Foundation of China
- No. 82373486/National Natural Science Foundation of China
- No. 82373486/National Natural Science Foundation of China
- No. 82373486/National Natural Science Foundation of China
- No. 82373486/National Natural Science Foundation of China
- No. 82373486/National Natural Science Foundation of China
- R2023024/Hunan Provincial Health High-Level Talent Scientific Research Project
- R2023024/Hunan Provincial Health High-Level Talent Scientific Research Project
- R2023024/Hunan Provincial Health High-Level Talent Scientific Research Project
- R2023024/Hunan Provincial Health High-Level Talent Scientific Research Project
- R2023024/Hunan Provincial Health High-Level Talent Scientific Research Project
- R2023024/Hunan Provincial Health High-Level Talent Scientific Research Project
- R2023024/Hunan Provincial Health High-Level Talent Scientific Research Project
- R2023024/Hunan Provincial Health High-Level Talent Scientific Research Project
- R2023024/Hunan Provincial Health High-Level Talent Scientific Research Project
- R2023024/Hunan Provincial Health High-Level Talent Scientific Research Project
- R2023024/Hunan Provincial Health High-Level Talent Scientific Research Project
- R2023024/Hunan Provincial Health High-Level Talent Scientific Research Project
- R2023024/Hunan Provincial Health High-Level Talent Scientific Research Project
LinkOut - more resources
Full Text Sources
