. 2025 Jul 2;15(1):22946.
doi: 10.1038/s41598-025-06953-3.

Ecosystem metabolism and nitrogen budget of a glacial Fjord in the Arctic

Affiliations

Ecosystem metabolism and nitrogen budget of a glacial Fjord in the Arctic

Pedro Duarte et al. Sci Rep. .

Abstract

Fjords in the Arctic are changing rapidly due to multiple factors including increasing air temperatures, the influx of Atlantic Water (Atlantification), sea-ice loss, retreat of tidewater glaciers, increased freshwater discharges, pollution and tourism. Understanding how these changes affect ecosystem processes and functions and, thus, services to society is critical. Net Ecosystem Metabolism (NEM) offers a holistic measure of ecosystem functioning and services, reflecting the balance between autotrophic and heterotrophic processes and the sink/source role of an ecosystem for nutrients and carbon. Using a 10-year dataset we quantify the main nutrient sources and sinks in Kongsfjorden (Svalbard) and estimate NEM using a method based on mixing diagrams combined with an ocean circulation model. We show that Kongsfjorden is a nutrient and carbon sink primarily supported by nutrient inputs from the adjacent shelf sea with terrestrial run-off playing a secondary role. Given the ongoing changes in the Arctic, driven by global warming and its associated effects, we recommend monitoring NEM as an integrated measure of the state of coastal ecosystems, considering the disproportionately large role of coastal regions in the global carbon budget.

Keywords: Freshwater endmembers; Glacial fjord; Kongsfjorden; Marine endmembers; Net ecosystem metabolism; Nutrient sink/source.


Conflict of interest statement

Declarations. Competing interests: The authors declare no competing interests.

Figures
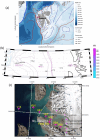
Fig. 1
Fig. 1
(a) Geographical context of Kongsfjorden (red square), located on West Spitsbergen in Svalbard. The West Spitsbergen Current is shown in red and the Spitsbergen Polar Current in blue. This panel was produced with the PlotSvalbard R package (https://github.com/MikkoVihtakari/PlotSvalbard?tab=GPL-2.0-1-ov-file). (b) Location of sampling sites from the inner Kongsfjorden, across the shelf and into the Fram Strait. All stations with black crosses (except the Ferry Box of the AWIPEV underwater observatory, located in front of Ny-Ålesund) are part of the MOSJ and AMUST datasets. Stations with magenta crosses are part of the Torres-Valdes et al. dataset (refer to Table S1). The bathymetry represented by the contour lines combines the K160_bgc model bathymetry and the International Bathymetric Chart of the Arctic Ocean downloaded from https://www.gebco.net/data_and_products/gridded_bathymetry_data/arctic_ocean/at 200 m resolution; (c) General view of Kongsfjorden and the terrestrial and glacial surroundings. Also included are the locations of MOSJ sampling sites, Ny-Ålesund and the Ferry Box in Kongsfjorden (magenta crosses, with the same cross used to show the location of Ny-Ålesund and the Ferry Box), and the location of the tidewater glacier fronts (magenta dots), using data from the Norwegian Polar Institute over an aerial image from Copernicus Sentinel Data. The white line at the mouth of Kongsfjorden delimits the fjord area, which is the focus of this study to calculate nutrient budgets. Panels (b, c) were produced/modified using Matlab R2024b.
Fig. 2
Fig. 2
Daily average nitrogen fluxes (tonnes N d−1) and ranges (when available) calculated for the period 2011–2023 (depending on data availability), except water-sediment exchanges that are based on (see text). Fluxes are calculated for (a) summer and (b) the whole year and for the fjord area limited by the white line in Fig. 1c. Values correspond to dissolved inorganic nitrogen (DIN = nitrate + nitrite + ammonia), N2, dissolved organic nitrogen (DON), and particulate organic nitrogen (PON) from phytoplankton (Phy) and zooplankton (Zoo) or seabird prey as specified in the panels.
Fig. 3
Fig. 3
Nitrate + nitrite concentration contours (µmol kg−1) for 2011–2020 based on the MOSJ dataset for the Kongsfjorden summer transect (Table S1) and water masses delimited by the black lines, according to Cottier et al. (AW – Atlantic Water, TAW – Transformed Atlantic Water, SW – Surface Water, and IW – Intermediate Water). A subset of the sampling stations is plotted over panels a, f. Refer to Table S2 for water mass characteristics and Figs. 1b, c for the locations of all sampling stations. The white areas in the contour plots correspond to places where data were not available. In the case of station Kb5 there were no data below 100 m due to depth constraints.
Fig. 4
Fig. 4
DIC concentration contours (µmol kg−1) for the years 2012–2020 based on the MOSJ dataset for the Kongsfjorden summer transect (Table S1) and water masses delimited by the black lines, according to Cottier et al. (AW – Atlantic Water, TAW – Transformed Atlantic Water, SW – Surface Water, and IW – Intermediate Water). A subset of the sampling stations is plotted over panels a, e. Refer to Table S2 for water mass characteristics and Figs. 1b, c for the locations of all sampling stations. The white areas in the contour plots correspond to places where data were not available. In the case of station Kb5 there were no data below 100 m due to depth constraints.
Fig. 5
Fig. 5
(a) and (b) Nitrate + nitrite and dissolved inorganic carbon (DIC) molar uptake rates, respectively (see text). We used a flushing time of 13 days which is the mean of the range obtained from our simulations (see Figs. S17a, S18a and S19a). Positive values indicate net drawdown inside the fjord (autotrophic fjord).

References

    1. Gattuso, J. P., Frankignoulle, M. & Wollast, R. Carbon and carbonate metabolism in coastal aquatic ecosystems. Annu. Rev. Ecol. Syst.29, 405–434. 10.1146/annurev.ecolsys.29.1.405 (1998).
    1. Nidzieko, N. J. Allometric scaling of estuarine ecosystem metabolism. P Natl. Acad. Sci. USA. 115, 6733–6738. 10.1073/pnas.1719963115 (2018). - PMC - PubMed
    1. Schlegel, R. W. et al. Drivers of change in Arctic fjord socio-ecological systems: Examples from the European Arctic. Cambridge Prisms: Coastal Futures1, e13, 1–18. 10.1017/cft.2023.1 (2023).
    1. Siddons, B. L., Glegg, G. & McQuatters-Gollop, A. Inter-regional coherence: can Northeast Atlantic pelagic habitat indicators be applied to the Arctic?? Mar. Policy. 96, 53–64. 10.1016/j.marpol.2018.07.013 (2018).
    1. Wadham, J. L. et al. Ice sheets matter for the global carbon cycle. Nat. Commun. 10 3567. 10.1038/S41467-019-11394-4 (2019). - PMC - PubMed

LinkOut - more resources