. 2025 Jul 2;15(1):22938.
doi: 10.1038/s41598-025-06101-x.

Unraveling the effects of FLASH and conventional irradiation on retinal pigment epithelial cells: in vitro and in vivo studies

Affiliations

Unraveling the effects of FLASH and conventional irradiation on retinal pigment epithelial cells: in vitro and in vivo studies

Beatrice Di Marco et al. Sci Rep. .

Abstract

The retinal pigment epithelium (RPE) is a fundamental monolayer of pigmented cells that supports visual function, situated between the neural retina and choroidal blood vessels. Radiotherapy is a common treatment for ocular tumors such as uveal melanoma; however, the RPE is inevitably exposed to radiation during treatment. FLASH radiotherapy, characterized by ultra-high dose-rates, has emerged as a promising approach to minimize normal tissue toxicity while maintaining tumor control. Despite its potential, few preclinical studies have explored the effects of FLASH irradiation on the RPE, and no studies have directly compared FLASH with conventional (CONV) radiotherapy in this context. Using a LINAC capable of switching between FLASH and CONV irradiation, we here address the radiobiological effects on ARPE-19 cells, an in vitro RPE model, and the RPE of living mice. FLASH treatment demonstrated protective effects on ARPE-19 cells, enhancing cell viability and modulating cytokine expression (e.g., IL-6, IL-8). Furthermore, RPE tissue exhibited dose-dependent radiation sensitivity, with FLASH-irradiated mice performing better than CONV-treated ones. These findings indicate that FLASH radiotherapy may protect the RPE during ocular tumor treatment and provide insights into tissue-specific radiation sensitivity in the eye, supporting further research into its clinical applications.

Keywords: FLASH radiotherapy; Linear accelerator (LINAC); Ocular tumors; Radiation-induced toxicity; Retinal pigment epithelium (RPE); Uveal melanoma.


Conflict of interest statement

Declarations. Competing interests: The authors declare no competing interests.

Figures

Fig. 1
Fig. 1
Configurations used for both in vitro and in vivo experiments. In vitro set-up: (A) EF vertical configuration; (B) flashDiamond (fD) reference position for beam output characterization; (C) cell plate positioning at the buildup region with fD on the side to monitor EF output. In vivo set-up: (D) 3D printed animal holder; red star indicates the mouth-fixing clamp at the end of the U-shaped compartment; arrow indicates the final place of U-shaped compartment in the animal holder; (E) scheme of EF oblique configuration with holder and mouse in position; (F) microCT, dose deposition simulation for a mouse positioned in the U-shaped compartment and resulting Dose-Volume Histogram (DVH) curve (G).
Fig. 2
Fig. 2
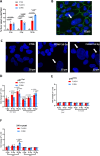
FLASH irradiation preserves cell viability and metabolic activity in ARPE-19 cells. (A) MTT assay of ARPE-19 culture plates after exposures to 4, 8 and 16 Gy irradiation, in FLASH (red columns) and CONV (blue columns) modalities. Controls (gray columns) are age-matched culture plates, non-exposed to irradiation. Readings are done 72 h after exposure. Results of MTT assay were pooled from 12 replicate samples derived from 2 independent experiments and expressed as mean ± S.D. Data were analyzed using one-way ANOVA followed by Tukey’s multiple comparison test. p values are indicated in the graphs. (B) Bar graphs illustrating the survival rate of ARPE-19 cells 72 h post irradiation of increasing intensities, in FLASH (red columns) or CONV (blue columns) modalities. Controls (gray columns) are age-matched culture plates, non-exposed to irradiation. The experiment was conducted on 3 biological replicates for each condition. Data are expressed as mean ± SD. Data were analyzed using one-way ANOVA followed by Tukey’s multiple comparison test. p values are indicated in the graphs. (C) ARPE-19 cells stained with Ab against ZO-1 (red signal) and α-Tubulin (green signal). Blue signal is referred to Hoechst nuclear staining. (D) Representative image of ARPE-19 cells stained with antibodies against ZO-1 (red signal) and α-Tubulin (green signal) at higher magnification. Blue signal is referred to Hoechst nuclear staining. (E) Representative ARPE-19 cell images for each condition of irradiation at 4 Gy labeled with Hoechst nuclear staining, with arrows pointing to pyknotic nuclei.
Fig. 3
Fig. 3
FLASH irradiation minimizes morphological alterations, senescence and cytokines production in ARPE-19 cells. (A) Bar graphs of the percentage of oversized nuclei/field in ARPE-19 cells 72 h post irradiations of increasing intensities, in FLASH (red columns) or CONV (blue columns) modalities. Controls (gray columns) are age-matched culture plates, non-exposed to irradiation. The experiment was conducted on 3 biological replicates for each condition. Data are expressed as mean ± SD. Data were analyzed using one-way ANOVA followed by Tukey’s multiple comparison test. p values are indicated in the graphs. (B) Representative images of irradiated ARPE-19 cells immunostained with antibody against ZO-1 (green signal). Blue signal is referred to nuclear dye Hoechst. The arrow indicates an oversized nucleus. As shown in the image, the enlarged nuclear size is reflected in an overall increase in the cell’s size. (C) This panel shows representative ARPE-19 cells images for each conditions of irradiation at 4 Gy labeled with Hoechst nuclear staining with arrows pointing to oversized nuclei. (D, E, F) qRT-PCR TaqMan assay of ARPE-19 cells. Controls (black dotted line, set to 1) are age-matched culture plates, non-exposed to irradiation. In each graph, statistically significant results show comparisons between non exposed control cells and irradiated cells. The graphs also show results of comparisons between ARPE-19 irradiated in CONV and ARPE-19 irradiated in FLASH modalities. The experiment was conducted on 3 biological replicates for each condition. Data are expressed as mean ± SD. Data were analyzed using one-way ANOVA followed by Tukey’s multiple comparison test. p values are indicated in the graphs. (D) Bar graphs illustrated expression level of p21 gene in ARPE-19 cells 24 h and 72 h post irradiation of increasing intensities, either in FLASH (red columns) or CONV (blue columns) modalities. (E) Bar graphs illustrated expression level of p16 gene in ARPE-19 cells 24 hand 72 h post irradiation of increasing intensities, either in FLASH (red columns) or CONV (blue columns) modalities. (F) Bar graphs illustrated expression levels of IL-6 and IL-8 in ARPE-19 cells 24 h post irradiation of increasing intensities, either in FLASH (red columns) or CONV (blue columns) modalities.
Fig. 4
Fig. 4
FLASH irradiation reduces intracellular ROS production in ARPE-19 cells compared to CONV radiation. (A) The curves show the formation of intracellular ROS over time in ARPE-19 cells after exposure to increasing doses of irradiation in both FLASH (red line) and CONV (blue line) modes. Controls (black line) are age-matched culture plates, non-exposed to irradiation. Results were pooled from 12 replicate samples and expressed as mean ± S.D. Data were analyzed using two-way ANOVA followed by Bonferroni’s multiple comparison test. p values are indicated in the graphs. (B) Bar graph shows the quantification of the initial peak of ROS fluorescence following irradiation (black arrow, IR) in both FLASH (red columns) and CONV (blue columns) modes. H2O2 (yellow columns) was used as positive control. Data are expressed as mean ± S.D. Data were analyzed using one-way ANOVA followed by Tukey’s multiple comparison test. p values are indicated in the graphs.
Fig. 5
Fig. 5
FLASH irradiation preserves barrier integrity and enhances tight junction repair in ARPE-19 cells compared to CONV. (A) Bar graph shows Transepithelial Electrical Resistance (TEER) measurements of ARPE-19 cells 7 days post irradiation of increasing intensities, in FLASH (red columns) or CONV (blue columns) modalities. Controls (gray columns) are age-matched culture plates, non-exposed to irradiation. A minimum of 5 independent wells was used for measurements of TEER in each experimental condition. Data were analyzed using one-way ANOVA followed by Tukey’s multiple comparison test. Data are expressed as mean ± S.D. p values are indicated in the graphs. (B) Bar graph of qRT-PCR results of ZO-1 gene expression in ARPE-19 cells 24 h and 72 h post irradiation of increasing intensities, either in FLASH (red columns) or CONV (blue columns) modalities. Controls (black dotted line, set to 1) are age-matched culture plates, non-exposed to irradiation. The experiment was conducted on 3 biological replicates for each condition. Data were analyzed using one-way ANOVA followed by Tukey’s multiple comparison test and expressed as mean ± SD. Statistically significant results show comparisons between non exposed control cells and irradiated cells. The graphs also show results of comparisons between ARPE-19 irradiated in CONV and ARPE-19 irradiated in FLASH modalities. p values are indicated in the graphs. (C) Representative images of ARPE-19 cells immunostained with ZO-1 antibodies where the intact profile of the tight junctions can be observed in a control culture plate (left, CTRL), while their disruption is evident following oxidative stress (right).
Fig. 6
Fig. 6
FLASH and CONV irradiation effects on oBRB integrity in C57BL/6 mice. (A) Representative images of mouse whole-mount RPE preparation immunostained with Ab against ZO-1. Preparations from irradiated animals clearly revealing disruptions in the ZO-1 pattern (arrow) compared to the regular and intact ZO-1 profile of control, non-irradiated mouse. (B, C) Bar graphs show comparison among ZO-1 density profiles in the RPE of C57BL6 mice irradiated at different doses, in FLASH (red columns) or CONV (blue columns) modalities. Controls (gray columns) are age-matched mice, non-exposed to irradiation. For 20 Gy long term experiments a total number of 9 mice were used (n = 3/treatment; n = 3 controls). For 15 Gy treatment a total number of 9 animals were used (n = 3/ treatment; n = 3 controls). For 10 Gy treatment a total number of 9 animals were employed (n = 3/ treatment; n = 3 controls). Data were analyzed using one-way ANOVA followed by Tukey’s multiple comparison test and expressed as mean ± S.D. p values are indicated in the graphs. (B) Comparison of ZO-1 density profiles in the RPE of C57BL6 mice, quantified using a custom-designed grid. (C) Quantification of the ZO-1-positive pattern and RPE cell count per field was carried out using the custom-developed software hAPPythelium. This analysis validated the findings at both the highest and lowest irradiation doses explored in the study.
Fig. 7
Fig. 7
Behavioral and visual effects of FLASH and CONV irradiation in C57BL/6 mice. (A) The bar graphs illustrate the mean velocity and the total distance moved by mice 14 days before and 7 days after exposure to increasing irradiation doses in both FLASH (red bars) and CONV (blue bars) modes. Controls (gray bars) are age-matched mice non exposed to irradiation. For 20 Gy experiment, a total number of 9 mice were used (n = 3/treatment; n = 3 controls). For 15 Gy treatment a total number of 9 animals were used (n = 3/ treatment; n = 3 controls). For 10 Gy treatment a total number of 9 animals were employed (n = 3/ treatment; n = 3 controls). Data were analyzed using one-way ANOVA followed by Tukey’s multiple comparison test and expressed as mean ± S.D. p values are indicated in the graphs. (B) Schematic illustration of the apparatus used for the visual cliff test; in the image, the two areas of the arena are visible: on the right, the “safe” or shallow side, and the “cliff” or deep side on the left. (C) The bar graph illustrates the time spent on the “cliff” side by mice 14 days before and 7 days after exposure to 10 Gy in both FLASH (red bars) and CONV (blue bars) modes. Controls (gray bars) are age-matched mice non exposed to irradiation. Data were analyzed using one-way ANOVA followed by Tukey’s multiple comparison test and expressed as mean ± S.D. p values are indicated in the graphs.

Similar articles

References

    1. Kim, M. M. & Zou, W. Ultra-high dose rate FLASH radiation therapy for cancer. Med. Phys.50, 58–61 (2023). - PMC - PubMed
    1. Chaikh, A. et al. Towards clinical application of ultra-high dose rate radiotherapy and the FLASH effect: challenges and current status. Cancer/Radiothérapie28, 463–473 (2024). - PubMed
    1. Horst, F. et al. Dose and dose rate dependence of the tissue sparing effect at ultra-high dose rate studied for proton and electron beams using the zebrafish embryo model. Radiother. Oncol.194, 110197 (2024). - PubMed
    1. Montay-Gruel, P. et al. Hypofractionated FLASH-RT as an effective treatment against glioblastoma that reduces neurocognitive side effects in mice. Clin. Cancer Res.27, 775–784 (2021). - PMC - PubMed
    1. COLLABORATIVEOCULARMELANOMASTU. The collaborative ocular melanoma study (COMS) randomized trial of pre-enucleation radiation of large choroidal melanoma: IV. Ten-year mortality findings and prognostic factors. COMS report number 24. Am. J. Ophthalmol.138, 936–951 (2004). - PubMed

LinkOut - more resources