. 2025 Jul 1;15(1):22178.
doi: 10.1038/s41598-025-06023-8.

The use of pancreatic ductal adenocarcinoma 2D and 3D models to evaluate NDV infection, replication and induced cell death

Affiliations

The use of pancreatic ductal adenocarcinoma 2D and 3D models to evaluate NDV infection, replication and induced cell death

Marco Huberts et al. Sci Rep. .

Abstract

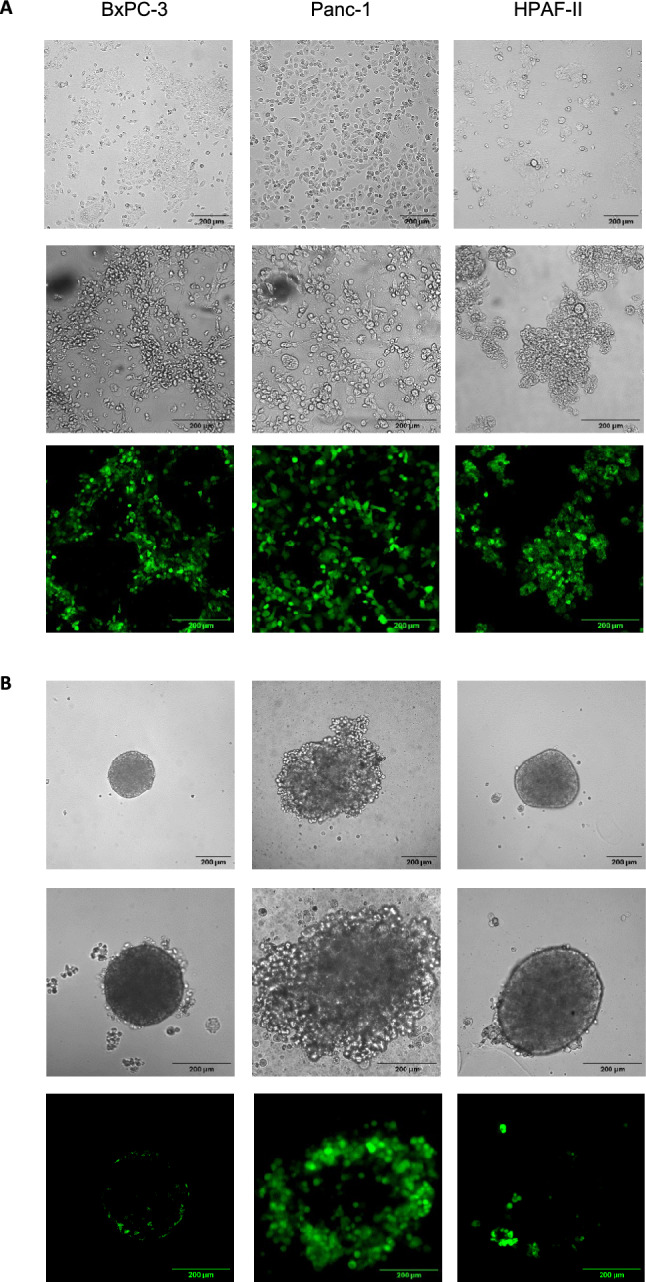
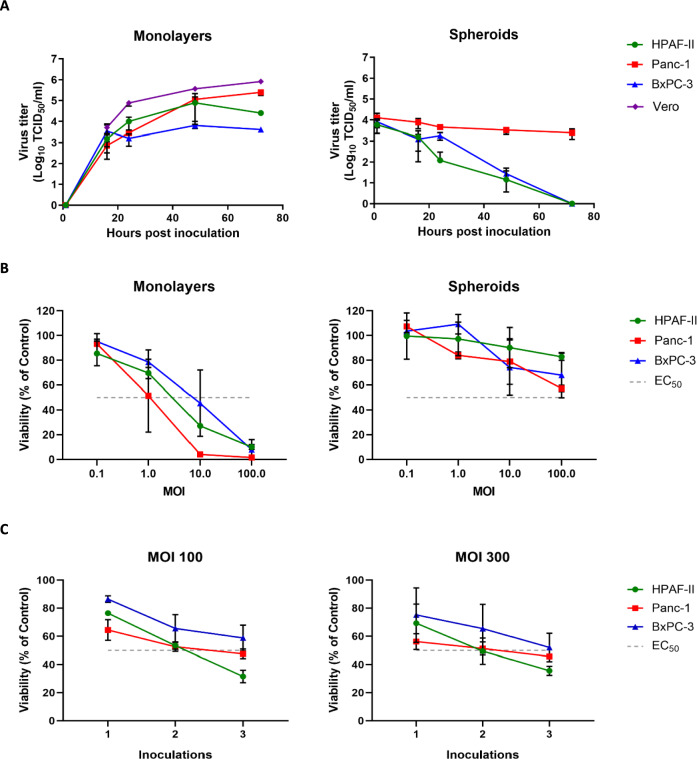
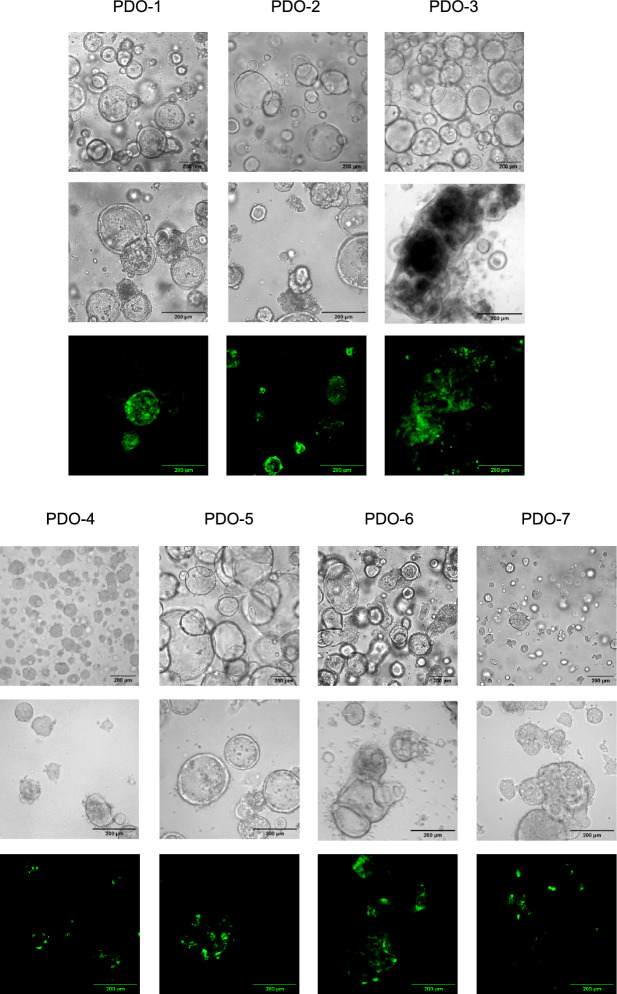
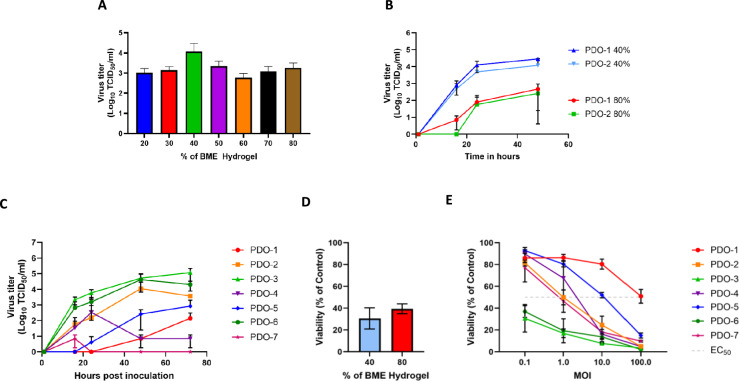
The development and testing of cancer therapies, such as oncolytic viro-immunotherapy, starts with 2-dimensional cell culture models, such as monolayers from lab-adapted cell lines. Although 2D models have been valuable, 3-dimensional models such as spheroids and patient-derived organoids (PDOs) better recapitulate tumor characteristics and may have higher predictive value for oncolytic viro-immunotherapy. Evaluating monolayers, spheroids, and PDOs for their response to oncolytic viro-immunotherapy using Newcastle Disease Virus (NDV) as an example may improve understanding of how model choice impacts outcomes. Monolayers, spheroids, and PDOs of Pancreatic Ductal Adenocarcinoma (PDAC) origin were evaluated for their response to NDV by assessing infection, replication, and virus-induced cell death. In spheroids and dense PDOs, NDV mainly infected the outer cell layer and did not spread to the inner layers. Cystic PDOs vary in susceptibility to NDV infection, replication, and virus-induced cell death, likely due to differences in genetic makeup. Evaluation of PDAC monolayers, spheroids, and PDOs revealed differences in NDV-induced cell death. Spheroids and dense PDOs may be more suitable than monolayers for evaluating virus infection. PDOs, regardless of morphology, reflect patient tumor genetics and might be a better model to identify markers to OV-induced cell death, advancing personalized oncolytic viro-immunotherapy approaches.


Conflict of interest statement

Declarations. Competing interests: The authors declare no competing interests. Ethical approval: Fresh tumor samples were collected from patients with PDAC that were part of a previously described clinical study18. This study was conducted in accordance with the principles of the Declaration of Helsinki and was approved by the local medical ethics committee (MEC-2015–085.

Figures

Fig. 1
Fig. 1
Infection of HPAC monolayers and spheroids upon inoculation with rNDV F0-GFP. HPAC cell lines HPAF-II, Panc-1 and BxPC-3 were used to generate A) monolayers or B) spheroids. For both monolayers and spheroids, representative brightfield pictures were taken at 10 × magnification (top row; scale bar = 200 μm). Afterwards, monolayers and spheroids were inoculated with NDV-F0-GFP at an MOI of 100. One day post inoculation representative brightfield pictures (middle row) and their corresponding Z-stacks of GFP signal displayed as z-axis projections (bottom row) were taken. All brightfield pictures and Z-stacks were taken at 20 × magnification (scale bar = 200 μm). Z-axis projections were created of the average GFP signal intensity of each slice in Z-stacks.
Fig. 2
Fig. 2
Sensitivity of HPAC monolayers and spheroids to rNDV F0-GFP replication and induced cell death. A) Replication kinetics of rNDV F0-GFP in Panc-1, BxPC-3 and HPAF-II monolayers and spheroids. Monolayers were inoculated at an MOI of 0.1, while spheroids were inoculated at an MOI of 1. Virus titers in supernatants collected at the indicated time points were determined in Vero cells. B) Cell viability upon inoculation with rNDV F0-GFP. Monolayers and spheroids were either mock-inoculated (control) or inoculated with rNDV F0-GFP at various MOIs. Cell viability was assessed five days post inoculation using the CellTiter-Glo 3D Cell Viability assay and is presented as a fraction of the mock control. The dotted line displays 50% cell viability, representing the EC50 value threshold. C) Cell viability upon repeated inoculation with rNDV F0-GFP. Spheroids were inoculated with rNDV F0-GFP at an MOI of 100 or 300, or mock-inoculated (control), for three consecutive rounds. Cell viability was measured 72 h after each inoculation using the CellTiter-Glo 3D Cell Viability assay and is displayed as a fraction of the mock control. Experiments were conducted in triplicate, with mean values and standard deviations depicted.
Fig. 3
Fig. 3
Infection of PDOs with rNDV F0-GFP. Top rows: Representative bright-field images of patient-derived organoids (PDOs). PDO-1, 2, 3, 5 and 6 displayed a cystic morphology, while PDO-4 and 7 had a dense morphology. Brightfield images were taken at 10 × magnification when the organoids were confluent enough for passaging (top row; scale bar = 200 µm). Middle and bottom rows: PDOs were inoculated with rNDV F0-GFP at an MOI of 0.1. Two-days post inoculation, both representative brightfield pictures (middle row) and Z-stacks of GFP signal, displayed as z-axis projections (bottom row), were taken at 20 × magnification (scale bar = 200 μm). Z-axis projections were created of the average GFP signal intensity of each slice in Z-stacks.
Fig. 4
Fig. 4
rNDV F0-GFP-induced cell death of PDOs. A) Virus release in the supernatant upon inoculation of PDO-2 at an MOI of 3 and cultured in different concentrations of BME hydrogel. Supernatants were collected at 48 h post inoculation an virus titers were determined in Vero cells. B) Replication kinetics of rNDV F0-GFP in PDO-1 and −2 using 40% or 80% BME hydrogel. PDOs were inoculated at an MOI of 3 and virus titers in supernatant collected at the indicated time points were determined in Vero cells. C) Replication kinetics of rNDV F0-GFP in PDOs upon inoculation at an MOI of 0.1. Samples were collected at indicated time points and titrated in Vero cells. D) PDO-2 was mock-inoculated (control) or inoculated with rNDV F0-GFP at MOI 1 and cultured in 40% and 80% BME hydrogel. Cell viability was measured 120 h post inoculation, using the CellTiter-Glo 3D Cell Viability assay. E) All PDOs were mock-inoculated (control) or inoculated with rNDV F0-GFP at indicated MOIs. Cell viability was measured 120 h post inoculation. A dotted line was added at 50% viability, representing the EC50 value threshold. Data are presented as the percentage of surviving cells compared to mock-treated cells that were considered 100% viable. Experiments were conducted in triplicate and mean and standard deviation are depicted.

Similar articles

References

    1. Chiu, M. et al. Combination therapy with oncolytic viruses and immune checkpoint inhibitors. Expert Opin. Biol. Ther.20(6), 635–652 (2020). - PubMed
    1. Brancato, V., Oliveira, J. M., Correlo, V. M., Reis, R. L. & Kundu, S. C. Could 3D models of cancer enhance drug screening?. Biomaterials232(1), 1–14 (2020). - PubMed
    1. Ware, M. J. et al. Generation of an in vitro 3D PDAC stroma rich spheroid model. Biomaterials108, 129–142 (2016). - PMC - PubMed
    1. Edmondson, R., Broglie, J. J., Adcock, A. F. & Yang, L. Three-dimensional cell culture systems and their applications in drug discovery and cell-based biosensors. Assay Drug Dev. Technol.12(4), 207–218 (2014). - PMC - PubMed
    1. Nath, S. & Devi, G. R. Three-dimensional culture systems in cancer research: Focus on tumor spheroid model. Pharmacol. Ther.163, 94–108 (2016). - PMC - PubMed

MeSH terms