. 2025 Jul 1;15(1):22081.
doi: 10.1038/s41598-025-05878-1.

Toll like receptor 2 mediated exacerbation of sepsis associated acute kidney injury by renal congestion in mice

Affiliations

Toll like receptor 2 mediated exacerbation of sepsis associated acute kidney injury by renal congestion in mice

Itaru Nakamura et al. Sci Rep. .

Abstract

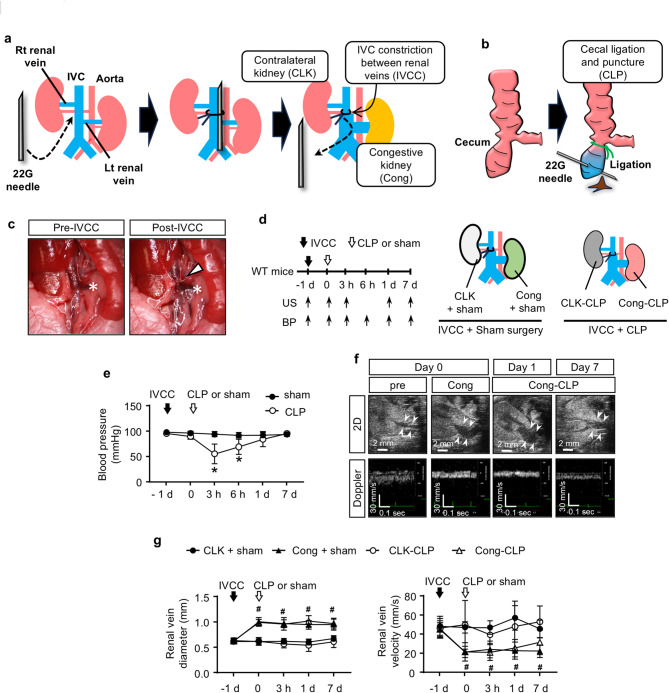
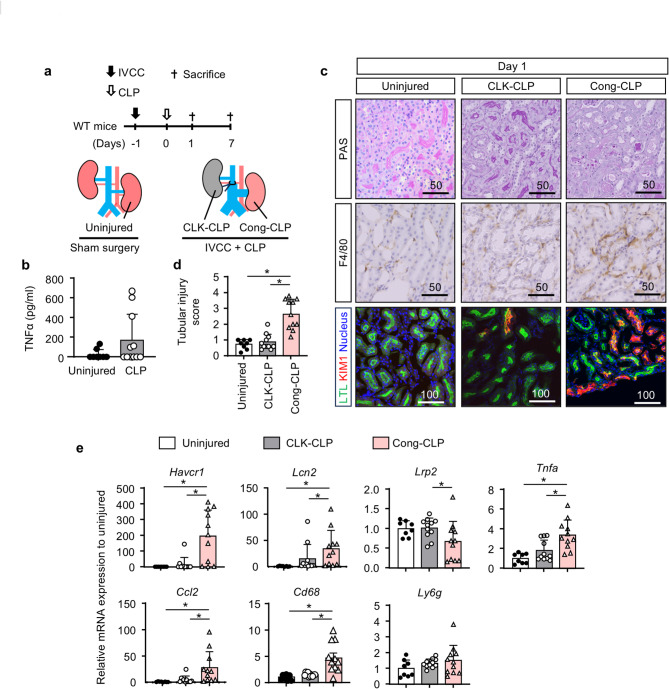
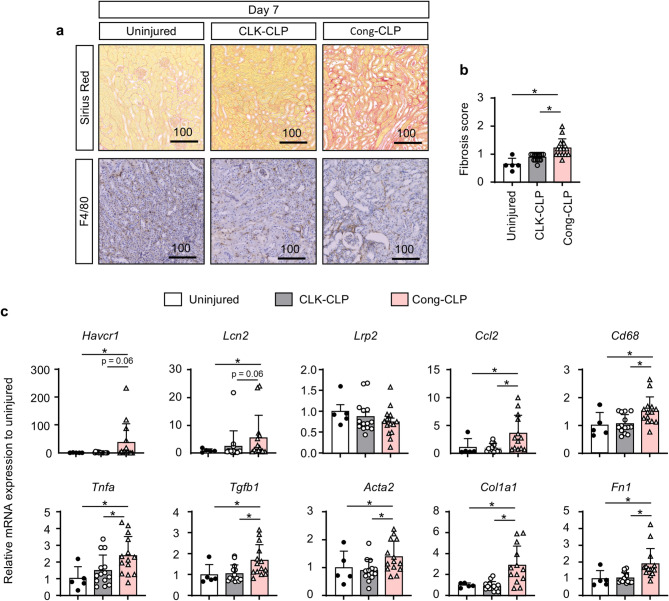
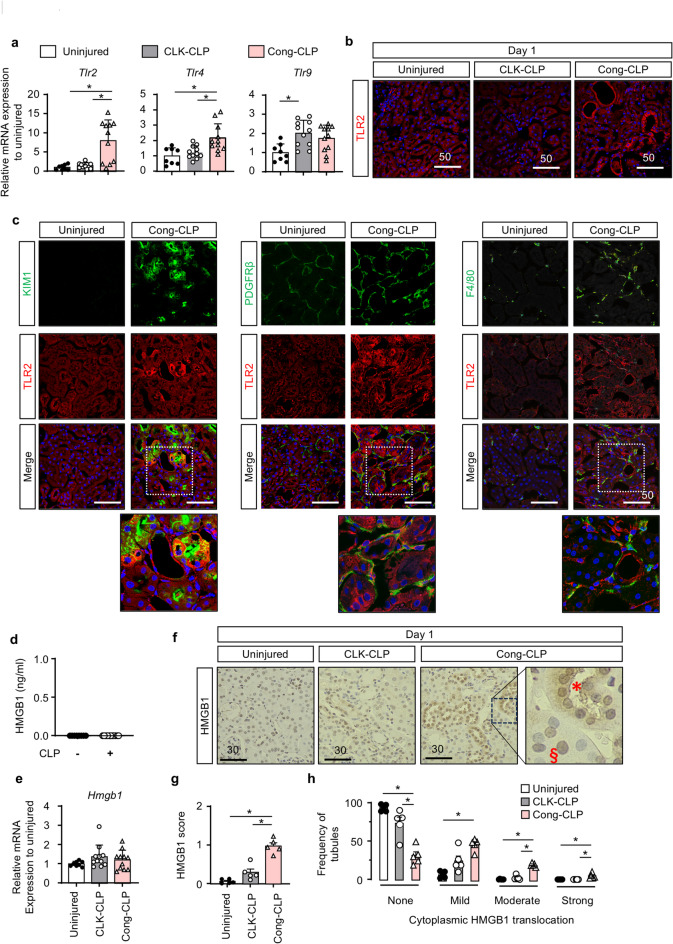
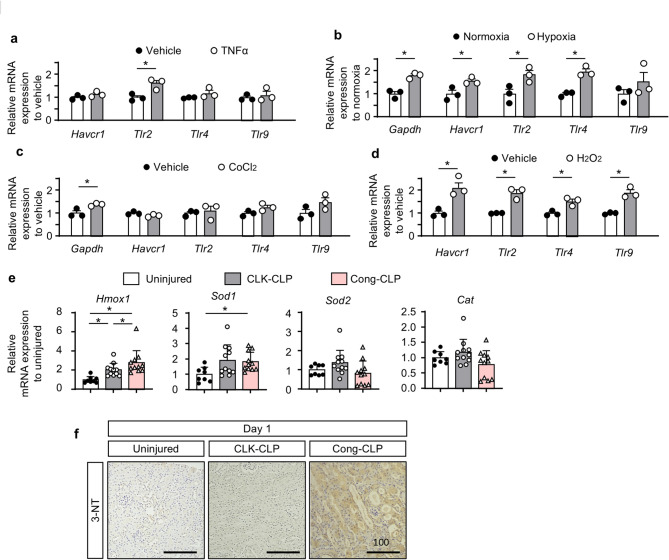
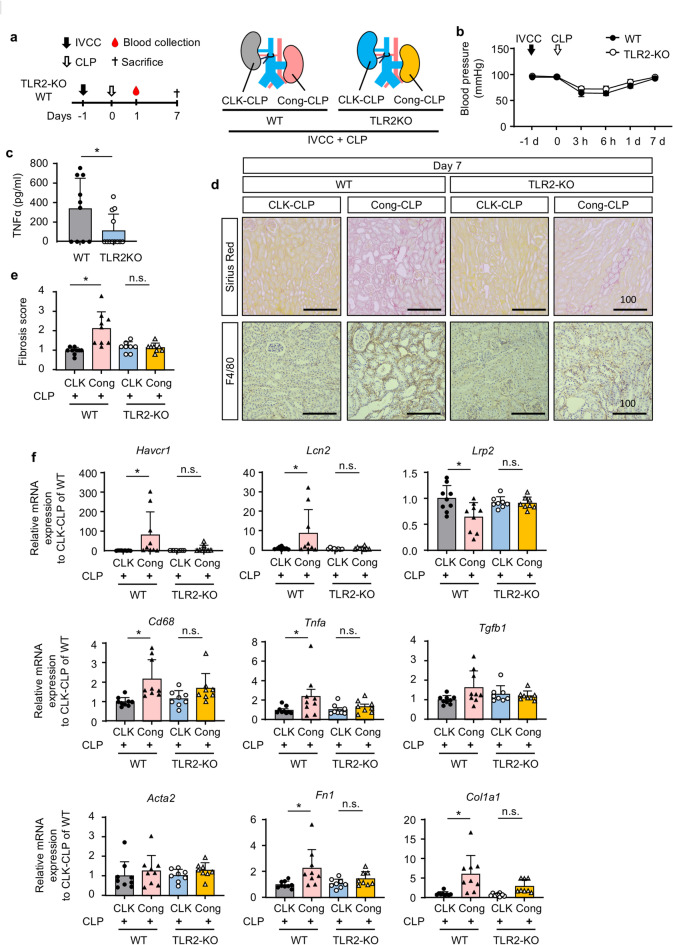
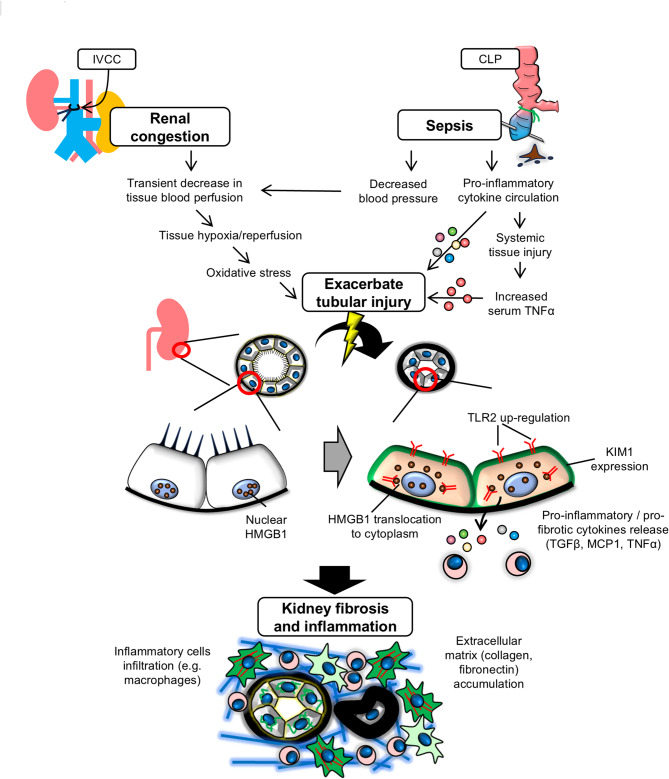
Renal congestion is a key factor in renal dysfunction associated with heart failure. We previously reported that renal congestion worsened renal ischemia-reperfusion in a murine model. However, its impact on sepsis-associated acute kidney injury (SA-AKI), the leading cause of AKI, remains unclear. Therefore, we herein investigated the mechanisms by which renal congestion exacerbates SA-AKI, with a focus on Toll-like receptor (TLR) 2. After inducing sepsis with cecal ligation and puncture (CLP) in a unilateral renal congestion model, transient blood pressure reductions and persistent renal vein dilation were observed. A histological analysis showed increased fibrosis and its markers in congested kidneys post-CLP. Acute phase results revealed extensive tubular damage, macrophage infiltration, TLR2 up-regulation, and elevated high mobility group box 1 (HMGB1) levels. In TLR2-knockout mice, exacerbation of tissue fibrosis by renal congestion was attenuated after CLP. In vitro, oxidative stress and hypoxia up-regulated TLR2 expression. Collectively, these results suggest that renal congestion and sepsis synergistically worsened renal damage, likely through hypoxia and the oxidative stress-induced activation of the TLR2 pathway.

Keywords: Acute kidney injury; Renal congestion; Sepsis; Toll-like receptor 2.


Conflict of interest statement

Declarations. Competing interests: The authors declare no competing interests.

Figures

Fig. 1
Fig. 1
Physiological analyses of sepsis-associated acute kidney injury (SA-AKI) in the congestive kidney (Cong). (a) Scheme of unilateral inferior vena cava (IVC) constriction. (b) Scheme of cecal ligation and puncture (CLP). (c) Macroscopic pictures of the IVC and left renal vein before and after surgery. The arrowhead indicates the site of constriction. Asterisks indicate the left renal vein. (d) Experimental scheme and groups for analyses. Surgical coarctation of the inferior vena cava (IVCC) followed by the induction of sepsis by CLP were performed on 10-week-old male mice, which were then sacrificed 1 or 7 days later. Echography of the kidney and blood pressure (BP) measurements were performed at the indicated time points. (e) Serial BP measurements in CLP and sham-operated mice. (f) Ultrasonography (upper panels) and Doppler echography (lower panels) of the left renal vein before, just after IVCC, and 7 days after CLP. (g) Serial measurements of the diameters of (left panel) and flow velocity (right panel) in the right and left renal veins (n = 6 each). In all groups, data are shown as means ± standard deviation (SD). * p < 0.05 vs. contralateral kidneys (CLK) at the same time points. # p < 0.05 vs. the baseline of Cong.
Fig. 2
Fig. 2
Renal congestion exacerbated SA-AKI. (a) Experimental scheme and groups for analyses. (b) Serum TNFα measurements by ELISA in mice 1 day after CLP. (c) Representative pictures of Periodic Acid-Schiff (PAS), immunohistochemistry for F4/80, and dual immunofluorescence for KIM1 and LTL. (d) Semi-quantitative analysis of tubular injury by PAS staining. (e) qPCR of RNA from the whole kidney for representative markers of tubular injury (Havcr1 and Lcn2), tubular integrity (Lrp2), proinflammatory cytokines (Tnfα and Ccl2), macrophages (Cd68), and leukocytes (Ly6g). Bars indicate 50 μm in PAS and F4/80 staining and 100 μm in immunofluorescence staining in (c). In all groups, data are shown as means ± SD. N = 8 for uninjured mice and n = 12 for CLP mice. *P < 0.05. The paired t-test was used for comparisons of variables between CLK-CLP and Cong-CLP. ANOVA and Tukey’s post hoc test were used for comparisons of multiple variables.
Fig. 3
Fig. 3
Renal congestion exacerbated SA-AKI-mediated kidney fibrosis. (a) Representative images of Sirius red staining and immunohistochemistry for F4/80 7 days after CLP (b) Semi-quantitative analysis of tissue fibrosis by Sirius red staining. (c) qPCR of RNA from the whole kidney for representative markers of tubular injury (Havcr1 and Lcn2), tubular integrity (Lrp2), proinflammatory and profibrotic cytokines (Ccl2, Tnfα, and Tgfb1), macrophages (Cd68), and fibrosis (Acta2, Col1a1, and Fn1). Bars indicate 100 μm in (b). In all groups, data are shown as means ± SD. N = 5 for uninjured mice and n = 14 for CLP mice. The paired t-test was used for comparisons of variables between CLK-CLP and Cong-CLP. ANOVA and Tukey’s post hoc test were used for comparisons of multiple variables.
Fig. 4
Fig. 4
Renal congestion up-regulated the expression of toll-like receptors (TLR) and High Mobility Group Box 1 (HMGB1) in congestive kidneys with SA-AKI. (a) qPCR of RNA from the whole kidney for toll-like receptors (TLR)-2, -4, and -9 1 day after CLP (b) Representative immunofluorescence images of the kidney for TLR2 1 day after CLP. (c) Representative co-immunofluorescence images of the kidney for TLR2 and KIM1, PDGFRβ, and F4/80 1 day after CLP (d) Serum HMGB1 measurements by ELISA in mice 1 day after CLP (e) qPCR of RNA from the whole kidney for Hmgb1 1 day after CLP (f) Representative immunostaining images for HMGB1 1 day after CLP. The dotted square indicates high (*) and no (§) cytoplasmic HMGB1 expression in tubules. (g) Average HMGB1 scores in tubules. (h) Frequency of tubules in each score. Bar = 50 μm in (b) and (c) and = 30 μm in (f). In all groups, data are shown as means ± SD. The paired t-test was used for comparisons of variables between CLK-CLP and Cong-CLP. ANOVA and Tukey’s post hoc test were used for comparisons of multiple variables. * p < 0.05.
Fig. 5
Fig. 5
Oxidative stress increased TLRs in tubular epithelia. (ad) qPCR of RNA from NRK-52E exposed to TNFα (a), hypoxia (b), CoCl2 (c), and H2O2 (d). (e) qPCR of RNA from the whole kidney for oxidative stress markers. (f) Representative immunohistochemical images of 3-nitrotyrosine 1 day after CLP. Bar = 100 μm in (f). In all groups, data are shown as means ± SD. The unpaired t-test was used for comparisons of variables between the 2 groups in vitro. The paired t-test was used for comparisons of variables between CLK-CLP and Cong-CLP. ANOVA and Tukey’s post hoc test were used for comparisons of multiple variables. * p < 0.05.
Fig. 6
Fig. 6
SA-AKI-mediated kidney fibrosis was ameliorated in TLR2-KO mice. (a) Experimental scheme and groups for analyses. (b) Serial BP measurements in WT and TLR2-KO mice that underwent IVCC and CLP. (c) Serum TNFα measurements by ELISA in mice 1 day after CLP. (d) Representative images of Sirius red staining and immunohistochemistry for F4/80 7 days after CLP (e) Semi-quantitative analysis of tissue fibrosis by Sirius red staining. (f) qPCR of RNA from the whole kidney for representative markers of tubular injury (Havcr1 and Lcn2), tubular integrity (Lrp2), a profibrotic cytokine (Tgfb1), proinflammatory cytokine (Tnfa), macrophages (Cd68), and fibrosis (Acta2, Col1a1, and Fn1). Bar = 100 μm in (d). In all groups, data are shown as means ± SD. N = 9 for WT mice and n = 8 for TLR2-KO mice. The paired t-test was used for comparisons of variables between CLK-CLP and Cong-CLP. * p < 0.05.
Fig. 7
Fig. 7
Proposed mechanisms underlying the exacerbation of SA-AKI by renal congestion.

Similar articles

References

    1. Savira, F. et al. Cardiorenal syndrome: Multi-organ dysfunction involving the heart, kidney and vasculature. Br. J. Pharmacol.177, 2906–2922. 10.1111/bph.15065 (2020). - PMC - PubMed
    1. Junho, C. V. C. et al. Cardiorenal syndrome: Long road between kidney and heart. Heart Fail. Rev.27, 2137–2153. 10.1007/s10741-022-10218-w (2022). - PubMed
    1. Mullens, W. et al. Importance of venous congestion for worsening of renal function in advanced decompensated heart failure. J. Am. Coll. Cardiol.53, 589–596. 10.1016/j.jacc.2008.05.068 (2009). - PMC - PubMed
    1. Damman, K. et al. Increased central venous pressure is associated with impaired renal function and mortality in a broad spectrum of patients with cardiovascular disease. J. Am. Coll. Cardiol.53, 582–588. 10.1016/j.jacc.2008.08.080 (2009). - PubMed
    1. Guglin, M., Rivero, A., Matar, F. & Garcia, M. Renal dysfunction in heart failure is due to congestion but not low output. Clin. Cardiol.34, 113–116. 10.1002/clc.20831 (2011). - PMC - PubMed