. 2025 Jul 1;15(1):20408.
doi: 10.1038/s41598-025-05572-2.

Cell-type specific sensory and motor activity in the cuneiform nucleus and pedunculopontine nucleus in mice

Affiliations

Cell-type specific sensory and motor activity in the cuneiform nucleus and pedunculopontine nucleus in mice

Cornelis Immanuel van der Zouwen et al. Sci Rep. .

Abstract

The activity of neurotransmitter-based cell types in the cuneiform and pedunculopontine nuclei during locomotion, non-locomotor behaviors, and following sensory stimulation is not fully understood. Using fiber photometry in mice, we found cell-type specific responses to sensory stimuli. Glutamatergic and GABAergic cells responded to sound, visual looming, and air puffs, except for pedunculopontine GABAergic cells, which did not respond to visual looming. Cholinergic cells responded to air puffs. Air puffs triggered high-speed locomotion, whereas visual looming and sound stimuli evoked low-speed locomotion. During air puff-evoked locomotion, cuneiform glutamatergic neuron activity was higher than in trials without locomotion. In contrast, during locomotion evoked by visual looming or sound, activity in pedunculopontine glutamatergic neurons was higher than when no locomotion occurred. In the open-field arena, mice exhibited spontaneous low-speed locomotion during which activity increased in pedunculopontine glutamatergic cells. Activity also increased in a cell type-specific manner during grooming or rearing. Our study shows cell type-specific activity in the cuneiform or pedunculopontine nuclei during locomotion, non-locomotor behaviors, and following sensory stimulation. Sensory responsiveness likely has relevance in Parkinson's disease, where sensory circuits are increasingly targeted to improve walking.


Conflict of interest statement

Declarations. Competing interests: The authors declare no competing interests.

Figures

Fig. 1
Fig. 1
Sound-evoked responses in CnF and PPN neurons. (A) Vglut2-cre, VGAT-cre or ChAT-cre mice were injected in the cuneiform nucleus (CnF) or pedunculopontine nucleus (PPN) with an adeno-associated virus encoding for the genetically encoded calcium (Ca2+) indicator jGCaMP7f in a cre-dependent manner (see Methods) and implanted with an optic fiber ∼150 μm above the injection site (Figure S1). Fiber photometry recordings were done using two LEDs for isosbestic and jGCaMP7f signals (405 and 465 nm), a filter cube (FC) and a photodetector (PD). A clinking metallic sound (86.9 ± 0.5 dB, spectrogram in Figures S2A–C) was applied every 60.1 s ± 0.3 s, ∼1 m away from an open-field arena (see Methods). (BF) Top, Ca2+ responses in the CnF or PPN evoked by sound stimulation. Each line illustrates a trial. Sound stimulus onset is indicated by a black vertical dotted line. Ca2+ responses are expressed in Z-score (see Methods), with warmer colors indicating stronger responses. Bottom, mean Z-scores ± SEM are illustrated. (GL) Sound-evoked mean Ca2+ response ± SEM (top) and locomotor speed ± SEM (bottom) obtained in each mouse (M) (1–4 series of 4–10 trials per animal). The number of mice (N) used is indicated. The colored rings illustrate the mean proportion of trials in which mice displayed a locomotor response (speed > 3 cm/s for at least 0.5 s,) during the 5 s after sound stimulation. (MR) mean Ca2+ signal before (− 5 to 0 s), during (0 to 5 s) and after sound stimulation (5 to 10 s) (9–36 trials per animal; *P < 0.05, **P < 0.01, ***P < 0.001, Student-Newman-Keuls test after a significant one-way repeated measures ANOVA; +P < 0.05, Student-Newman-Keuls test after a significant Friedman ANOVA on ranks). (SX) Comparison of mean Ca2+ signals in trials with (blue) or without (grey) a locomotor response during the 5 s following sound stimulation (ns, not significant, ***P < 0.001 paired t-test; NS, not significant, Wilcoxon test; mice without locomotor trials or without non-locomotor trials were excluded from the analysis).
Fig. 2
Fig. 2
Visual-looming-evoked responses in CnF or PPN neurons. (A) Fiber photometry recordings were done as in Fig. 1. Visual looming stimulus (a black disk increasing in diameter on a grey background during 1.676 s, see disk expansion rates provided in Figure S3) (see Methods) were applied every 61.1 s ± 0.5 s on a screen placed laterally relative to an open-field arena. (BF) Calcium (Ca2+) responses evoked by visual looming stimuli in the CnF or PPN cells for example animals color-coded as in Fig. 1. Each line illustrates a trial. The black vertical dotted line corresponds to t = 0.803 s after the beginning of the looming stimulus, when disk expansion starts to increase exponentially (see Figure S3). Bottom, mean Z-scores ± SEM are illustrated. (GL) Visual looming-evoked mean Ca2+ response ± SEM (top) and locomotor speed (bottom) obtained in each mouse (M) (1–3 series of 8–10 trials per animal). The number of mice (N) used is indicated. The colored rings illustrate the mean proportion of trials in which mice displayed a locomotor response defined as in Fig. 1 (see Methods). As for B–F, the black vertical dotted lines correspond to the start of the looming stimulus, which occurs 0.803 s after the start of the video with the stimulus. Note that the small increase in photometry signal before the black vertical dotted line was caused by our synchronization procedure, which relied on a button press that generated a small noise (see Figure S2C–F) (see Methods). (MR) Mean Ca2+ signal before (− 5 to 0 s), during (0 to 5 s) and after visual looming stimulation (5 to 10 s) (8–28 trials per animal; ns, not significant, *P < 0.05, ***P < 0.001, Student Newman-Keuls test after a significant one-way repeated measures ANOVA). (SX) Comparison of Ca2+ signals in trials with or without a locomotor response during the 5 s following visual looming stimulation (ns, not significant, *P < 0.05 paired t-test; NS, not significant, Wilcoxon test; mice without locomotor trials or without non-locomotor trials were excluded from the analysis).
Fig. 3
Fig. 3
Air-puff-evoked responses in CnF and PPN neurons. (A) Fiber photometry recordings were done as in Fig. 1. Air puff was applied with a small air bulb on the back of the animal every 61.4 s ± 0.7 s (see Methods). (BF) Calcium (Ca2+) responses evoked by air puffs in the CnF or PPN cells for example animals color-coded as in Fig. 1. Each line illustrates a trial. Air puff onset is indicated by a black vertical dotted line. Bottom, mean Z-scores ± SEM are illustrated. (GL) Air puff-evoked mean Ca2+ response ± SEM (top) and locomotor speed ± SEM (bottom) obtained in each mouse (M) (2–4 series of 6–10 trials per animal). The number of mice (N) used is indicated. The colored rings illustrate the mean proportion of trials in which mice displayed a locomotor response defined as in Fig. 1 (See Methods). (MR) Mean Ca2+ signal before (− 5 to 0 s), during (0 to 5 s) and after the air puff (5 to 10 s) (16–36 trials per animal; *P < 0.05, **P < 0.01, ***P < 0.001, Student-Newman-Keuls test after a significant one-way repeated measures ANOVA; +P < 0.05, Student-Newman-Keuls test after a significant Friedman ANOVA on ranks). (SX) Comparison of mean Ca2+ signals in trials with or without a locomotor response during the 5 s following air puff (ns, not significant, *P < 0.05, paired t-test; mice without locomotor trials or without non-locomotor trials were excluded from the analysis).
Fig. 4
Fig. 4
CnF or PPN cell activity during spontaneous, self-paced locomotion. (A) Fiber photometry recordings were done as in Fig. 1. In an open-field arena, spontaneous locomotor bouts (speed > 3 cm/s for at least 0.5 s), were detected and aligned with calcium (Ca2+) signals recorded in the CnF or PPN. (BF) Ca2+ activity in the CnF or PPN cells color-coded as in Fig. 1 during spontaneous locomotion for example animals. Each line illustrates a locomotor bout. Locomotor bout onsets (0) and offsets (1) are indicated by black vertical dotted lines. Time is normalized as a fraction of locomotor bout duration. (GL) Mean Ca2+ activity ± SEM (top) and locomotor speed ± SEM (bottom) recorded during spontaneous, self-paced locomotion in each mouse (M). The number of mice (N) used is indicated. (MR) Mean Ca2+ signal before locomotion (− 0.5 to 0), during the first half of the bout (0 to 0.5), second half of the bout (0.5 to 1) and after (1 to 1.5) locomotion (95–294 bouts for CnF Vglut2-cre, 34–343 bouts for CnF VGAT-cre mice, 113–328 bouts for PPN Vglut2-cre, 79–301 bouts for PPN VGAT-cre, 10–102 bouts for PPN ChAT-cre mice) (ns, not significant, *P < 0.05 Student-Newman-Keuls test after significant one-way repeated measures ANOVA; +P < 0.05 Student Newman-Keuls test after a significant one-way repeated measures ANOVA on ranks).
Fig. 5
Fig. 5
CnF or PPN cell activity during grooming. (A) Fiber photometry recordings were done as in Fig. 1. Mice were filmed from the side on a treadmill that was switched off. Grooming bouts were detected and aligned with calcium (Ca2+) signals recorded in the CnF or PPN. (B–F) Ca2+ activity in the CnF or PPN cells color-coded as in Fig. 1 during grooming for example animals. Each line illustrates a grooming event. Event onsets (0) and offsets (1) are indicated by black vertical dotted lines. Time is normalized as a fraction of the grooming event duration. (GL) Mean Ca2+ activity ± SEM (top) recorded during grooming in each mouse (M). The number of mice (N) used is indicated. (MR) Mean Ca2+ signal before grooming (− 0.5 to 0), during the first half of the grooming bout (0 to 0.5), second half of the bout (0.5 to 1) and after grooming (1 to 1.5) (6–10 events for CnF Vglut2-cre, 3–15 events for CnF VGAT-cre mice, 7–39 events for PPN Vglut2-cre, 3–22 events for PPN VGAT-cre, 5–12 events for PPN ChAT-cre mice) (ns, not significant, *P < 0.05, ***P < 0.001, Student-Newman-Keuls test after a significant one-way repeated measures ANOVA).
Fig. 6
Fig. 6
CnF or PPN cell activity during rearing. (A) Fiber photometry recordings were done as in Fig. 1. Mice were filmed from the side on a treadmill that was switched off. Rearing bouts were detected and aligned with calcium (Ca2+) signals recorded in the CnF or PPN. (BF) Ca2+ activity in the CnF or PPN cells color-coded as in Fig. 1 during rearing for example animals. Each line illustrates a rearing event. Event onsets (0) and offsets (1) are indicated by black vertical dotted lines. Time is normalized as a fraction of the rearing event duration. (GL) Mean Ca2+ activity ± SEM (top) recorded during rearing in each mouse (M). The number of mice (N) used is indicated. (MR) Mean Ca2+ signal before rearing (− 0.5 to 0), during the first half of the rearing bout (0 to 0.5), second half of the bout (0.5 to 1) and after rearing (1 to 1.5) (7–94 events for CnF Vglut2-cre, 17–86 events for CnF VGAT-cre, 13–79 events for PPN Vglut2-cre, 13–105 events for PPN VGAT-cre, 7–52 events for PPN ChAT-cre mice) (ns, not significant, *P < 0.05, **P < 0.01, ***P < 0.001, Student-Newman-Keuls test after a significant one-way repeated measures ANOVA).
Fig. 7
Fig. 7
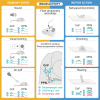
Sensory and motor-related activities in genetically-defined cell types in the CnF and PPN. On the left, for each stimulus, the statistically significant increases in activity per cell population are illustrated. The vertical dotted lines indicate the timing of sensory stimulation. On the right, for each motor behavior, the statistically significant increases in activity per cell population are shown. The vertical dotted lines represent the beginning and the end of the motor bout. Created with BioRender.com.

Similar articles

References

    1. Arber, S. & Costa, R. M. Networking brainstem and basal ganglia circuits for movement. Nat. Rev. Neurosci.23, 342–360. 10.1038/s41583-022-00581-w (2022). - PubMed
    1. Leiras, R., Cregg, J. M. & Kiehn, O. Brainstem circuits for locomotion. Annu. Rev. Neurosci.10.1146/annurev-neuro-082321-025137 (2022). - PubMed
    1. Dubuc, R., Cabelguen, J. M. & Ryczko, D. Locomotor pattern generation and descending control: A historical perspective. J. Neurophysiol.130, 401–416. 10.1152/jn.00204.2023 (2023). - PubMed
    1. Ryczko, D. The mesencephalic locomotor region: Multiple cell types, multiple behavioral roles, and multiple implications for disease. Neuroscientist30, 347–366. 10.1177/10738584221139136 (2024). - PMC - PubMed
    1. Caggiano, V. et al. Midbrain circuits that set locomotor speed and gait selection. Nature553, 455–460. 10.1038/nature25448 (2018). - PMC - PubMed

LinkOut - more resources