

Automated classification of chondroid tumor using 3D U-Net and radiomics with deep features
- PMID: 40594673
- PMCID: PMC12217438
- DOI: 10.1038/s41598-025-07128-w
Automated classification of chondroid tumor using 3D U-Net and radiomics with deep features
Abstract
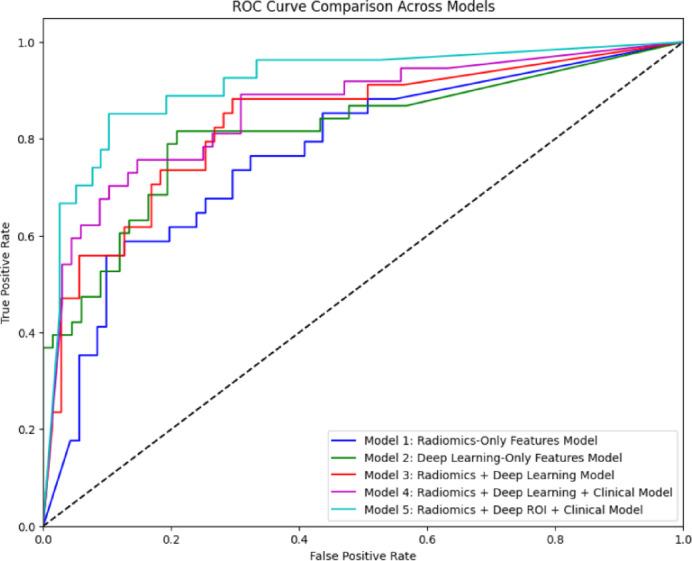
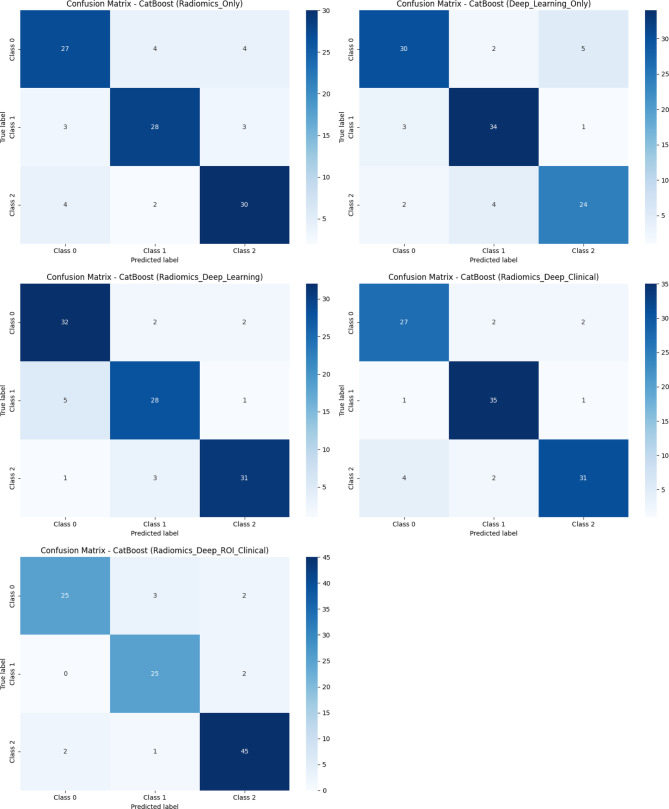
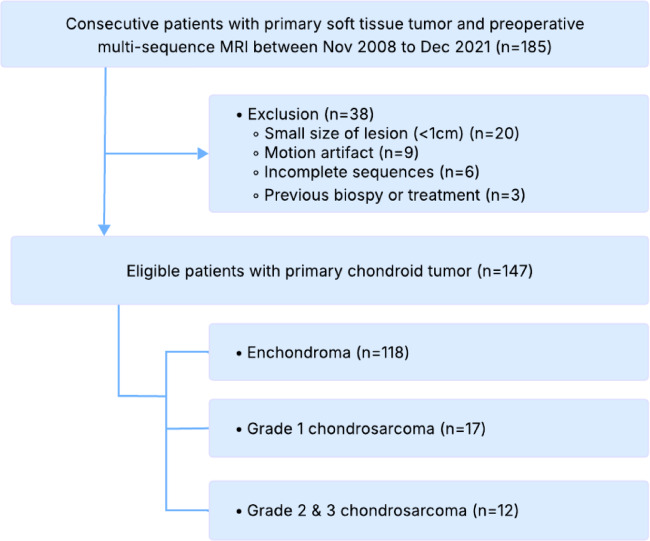
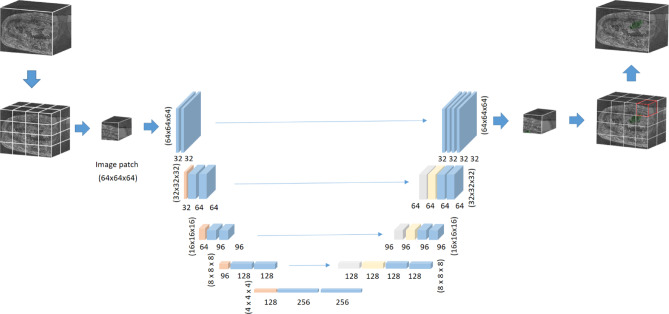
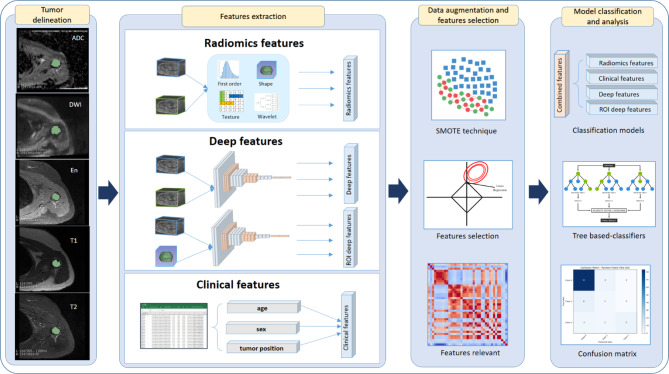
Classifying chondroid tumors is an essential step for effective treatment planning. Recently, with the advances in computer-aided diagnosis and the increasing availability of medical imaging data, automated tumor classification using deep learning shows promise in assisting clinical decision-making. In this study, we propose a hybrid approach that integrates deep learning and radiomics for chondroid tumor classification. First, we performed tumor segmentation using the nnUNetv2 framework, which provided three-dimensional (3D) delineation of tumor regions of interest (ROIs). From these ROIs, we extracted a set of radiomics features and deep learning-derived features. After feature selection, we identified 15 radiomics and 15 deep features to build classification models. We developed 5 machine learning classifiers including Random Forest, XGBoost, Gradient Boosting, LightGBM, and CatBoost for the classification models. The approach integrating features from radiomics, ROI-originated deep learning features, and clinical variables yielded the best overall classification results. Among the classifiers, CatBoost classifier achieved the highest accuracy of 0.90 (95% CI 0.90-0.93), a weighted kappa of 0.85, and an AUC of 0.91. These findings highlight the potential of integrating 3D U-Net-assisted segmentation with radiomics and deep learning features to improve classification of chondroid tumors.
Keywords: 3D U-Net; Chondroid tumors; Computer-aided diagnosis; Deep learning; MRI images; Machine learning algorithms; Radiomics; Tumor segmentation.
© 2025. The Author(s).
Conflict of interest statement
Declarations. Competing interests: The authors declare no competing interests.
Figures
Similar articles
-
Constructing a Classification Model for Cervical Cancer Tumor Tissue and Normal Tissue Based on CT Radiomics.Technol Cancer Res Treat. 2024 Jan-Dec;23:15330338241298554. doi: 10.1177/15330338241298554. Technol Cancer Res Treat. 2024. PMID: 39539120 Free PMC article.
-
Integrating Clinical Data and Radiomics and Deep Learning Features for End-to-End Delayed Cerebral Ischemia Prediction on Noncontrast CT.AJNR Am J Neuroradiol. 2024 Sep 9;45(9):1260-1268. doi: 10.3174/ajnr.A8301. AJNR Am J Neuroradiol. 2024. PMID: 39025637
-
A three-classification machine learning model for non-invasive prediction of molecular subtypes in diffuse glioma: a two-center study.Quant Imaging Med Surg. 2025 Jun 6;15(6):5752-5768. doi: 10.21037/qims-24-2461. Epub 2025 May 29. Quant Imaging Med Surg. 2025. PMID: 40606348 Free PMC article.
-
Radiomics and deep learning characterisation of liver malignancies in CT images - A systematic review.Comput Biol Med. 2025 Aug;194:110491. doi: 10.1016/j.compbiomed.2025.110491. Epub 2025 Jun 3. Comput Biol Med. 2025. PMID: 40466239
-
MRI-Based Radiomics Methods for Predicting Ki-67 Expression in Breast Cancer: A Systematic Review and Meta-analysis.Acad Radiol. 2024 Mar;31(3):763-787. doi: 10.1016/j.acra.2023.10.010. Epub 2023 Nov 2. Acad Radiol. 2024. PMID: 37925343
References
-
- Gómez-León, N. et al. Chondroid tumors: Review of salient imaging features and update on the WHO Classification. Curr. Probl. Diagn. Radiol.52(3), 197–211 (2023). - PubMed
-
- Afonso, P. D., Isaac, A. & Villagrán, J. M. Chondroid tumors as incidental findings and differential diagnosis between enchondromas and low-grade chondrosarcomas. in Seminars in Musculoskeletal Radiology Vol. 23, No. 01 (Thieme Medical Publishers, 2019). - PubMed
-
- Flemming, D. J. & Murphey, M. D. Enchondroma and chondrosarcoma. Semin. Musculoskelet. Radiol.4(1), 0059–0072 (2000). - PubMed
MeSH terms
Grants and funding
LinkOut - more resources
Full Text Sources
Medical
