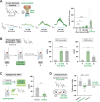
. 2025 Jul 1;15(1):20785.
doi: 10.1038/s41598-025-08467-4.

Artificial sweeteners differentially activate sweet and bitter gustatory neurons in Drosophila

Affiliations

Artificial sweeteners differentially activate sweet and bitter gustatory neurons in Drosophila

Christian Arntsen et al. Sci Rep. .

Abstract

Artificial sweeteners are highly sweet, non-nutritive compounds that have become increasingly popular over recent decades despite research suggesting that their consumption has unintended consequences. Specifically, there is evidence suggesting that some of these chemicals interact with bitter taste receptors, implying that sweeteners likely generate complex chemosensory signals. Here, we report the basic sensory characteristics of sweeteners in Drosophila, a common model system used to study the impacts of diet, and find that all noncaloric sweeteners inhibited appetitive feeding responses at higher concentrations. At a cellular level, we found that sucralose and rebaudioside A co-activated sweet and bitter gustatory receptor neurons (GRNs), two populations that reciprocally impact feeding behavior, while aspartame only activated bitter cells. We assessed the behavioral impacts of sweet and bitter co-activation and found that low concentrations of sucralose signal appetitive feeding while high concentrations signal feeding aversion. Finally, silencing bitter GRNs reduced the aversive signal elicited by high concentrations of sucralose and significantly increased sucralose feeding behaviors. Together, we conclude that artificial sweeteners generate a gustatory signal that is more complex than "sweetness" alone, and this bitter co-activation has behaviorally relevant effects on feeding that may help flies flexibly respond to these unique compounds.


Conflict of interest statement

Declarations. Competing interests: The authors declare no competing interests.

Figures
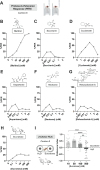
Fig. 1
Fig. 1
Flies exhibit diverse and concentration-dependent taste responses to a panel of artificial sweeteners. (A) Labellar proboscis extension response (PER) assay schematic showing stimulation with a test solution and a resulting extension. (B-H) Labellar PER with a panel of seven sweeteners presented to flies in a concentration series. %PER refers to the fraction of flies that extended to each respective concentration. n = 46–99. (I) Two-Choice FLIC feeding assay with a sucralose concentration series. Flies were allowed to choose between two food sources: H2O and one of the four sucralose concentrations. Preference index over three hours is depicted. n = 15–18 flies per genotype. All data from mated female Canton-S flies. Data plotted as mean ± SEM. ns = no significance, **p < 0.01, ***p < 0.001, ****p < 0.0001 by ordinary one-way ANOVA with Dunnett’s multiple comparisons test. Graphics were generated with BioRender.com.
Fig. 2
Fig. 2
Sucralose activates sweet GRNs to signal feeding attraction at low concentrations. (A) In vivo calcium imaging of sweet GRNs (Gr64f > GCaMP6f) during labellar sucralose stimulation. Calcium responses measured as ΔF/F (Z-score) over time at each concentration (left) and peak ΔF/F (right). Blue lines under each curve indicate when the stimulus was on the labellum. n = 12 flies. (B) Prolonged taste modulation PER paradigm consisting of three consecutive stimulations: an initial water stimulation A, a 50 mM sucralose stimulation, and a delayed water stimulation B. Modulation assessed after 20 s (right) or 5 min (left). n = 39–40 flies. Data from Canton-S flies. (C) Optogenetic silencing of sweet GRNs (Gr64f > GtACR1) during labellar sucralose PER. Flies were stimulated with 50 mM sucralose while exposed to green light. %PER to this stimulation was compared between flies pre-fed retinal (+ Retinal) and control flies (-Retinal). n = 35–38 flies per condition. (D) Constitutive silencing of sweet GRNs (Gr64f > Kir2.1) during the 2-choice FLIC feeding assay. Flies were allowed to choose between two food options, H2O and 100 mM sucralose, for three hours. Preference index calculated based off number of interactions with each food option. n = 20–22 flies per genotype. All experiments used mated females. Data plotted as mean ± SEM. ns = no significance, *p < 0.05, ***p < 0.001, ****p < 0.0001 by repeated-measures ANOVA with Dunnett’s multiple comparisons test (A), Wilcoxon matched-pairs signed rank test (B), Fisher’s exact test (C), or ordinary one-way ANOVA with Dunnett’s multiple comparisons test (D). Graphics were generated with BioRender.com.
Fig. 3
Fig. 3
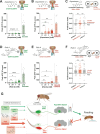
Sucralose activates bitter GRNs to signal feeding aversion at high concentrations. (A) In vivo calcium imaging of bitter GRNs (Gr66a > GCaMP6f) during labellar sucralose stimulation. Calcium responses measured as ΔF/F (Z-score) over time at each concentration (left) and peak ΔF/F (right). Blue lines under each curve indicate when the stimulus was on the labellum. n = 11 flies. (B) Prolonged taste modulation PER paradigm consisting of two repeated 500 mM sucralose stimulations separated by a 20-second or 5-minute delay. n = 66–67 flies. Data from Canton-S flies. (C) Optogenetic silencing of bitter GRNs (Gr66a > GtACR1) during prolonged taste modulation PER assay. Flies received two consecutive 500 mM sucralose stimulations separated by 20 s while exposed to green light. %PER to the initial and delayed stimulations were compared between flies pre-fed retinal (+ Retinal) and control flies (-Retinal). n = 32 flies per condition. (D) Constitutive silencing of bitter GRNs (Gr66a > Kir2.1) during the 2-choice FLIC feeding assay. Flies were allowed to choose between two food options, H2O and 100 mM sucralose, for three hours. Preference index calculated based off number of interactions with each food option. n = 18–26 flies per genotype. All experiments used mated females. Data plotted as mean ± SEM. ns = no significance, *p < 0.05, ***p < 0.001, ****p < 0.0001 by repeated-measures ANOVA with Dunnett’s multiple comparisons test (A), Wilcoxon matched-pairs signed rank test (B), Fisher’s exact test (C), or ordinary one-way ANOVA with Dunnett’s multiple comparisons test (D). Graphics were generated with BioRender.com.
Fig. 4
Fig. 4
Aspartame and Reb A exhibit limited GRN responses that minimally impact feeding. (A, B) In vivo calcium imaging of sweet (A) and bitter (B) GRNs during labellar aspartame stimulation. Calcium responses measured as peak ΔF/F (Z-score). n = 12 flies per experiment. (C) Constitutive silencing of bitter GRNs (Gr66a > Kir2.1) during the 2-choice FLIC feeding assay. Flies were allowed to choose between two food sources, H2O and 10 mM aspartame, for three hours. Preference index calculated based off number of interactions with each food option. n = 26–27 flies per genotype. (D, E) In vivo calcium imaging of sweet (D) and bitter (E) GRNs during labellar Reb A stimulation. Calcium responses measured as peak ΔF/F (Z-score). n = 13 (D) and 11 (E). (F) Constitutive silencing of bitter GRNs (Gr66a > Kir2.1) during the 2-choice FLIC feeding assay. Flies were allowed to choose between two food options, H2O and 10 mM Reb A, for three hours. Preference index calculated based off number of interactions with each food option. n = 21–28 flies per genotype. (G) Proposed model of how sweet and bitter GRNs encode several artificial sweeteners and how these signals impact feeding. Red-green gradients depict how low concentrations of sucralose and Reb A predominantly activate sweet GRNs while higher concentrations co-activate bitter GRNs. Aspartame only activates bitter GRNs. Solid lines represent signals that affect feeding while dotted lines represent signals that do not significantly impact feeding. All experiments used mated females. Data plotted as mean ± SEM. ns  no significance, *p < 0.05, **p < 0.01, ****p < 0.0001 by repeated-measures ANOVA with Dunnett’s multiple comparisons test (A, B, D, E) or ordinary one-way ANOVA with Dunnett’s multiple comparisons test (C, F). Graphics were generated with BioRender.com.

Similar articles

References

    1. Pearlman, M., Obert, J. & Casey, L. The association between artificial sweeteners and obesity. Curr. Gastroenterol. Rep.19, 64. 10.1007/s11894-017-0602-9 (2017). - PubMed
    1. Sylvetsky, A. C. et al. Consumption of Low-Calorie sweeteners among children and adults in the united States. J. Acad. Nutr. Dietetics. 117, 441–448e442. 10.1016/j.jand.2016.11.004 (2017). - PMC - PubMed
    1. Sylvetsky, A. C. & Rother, K. I. Trends in the consumption of low-calorie sweeteners. Physiol. Behav.164, 446–450. 10.1016/j.physbeh.2016.03.030 (2016). - PMC - PubMed
    1. Ghusn, W., Naik, R. & Yibirin, M. The impact of artificial sweeteners on human health and Cancer association: A comprehensive clinical review. Cureus15, e51299. 10.7759/cureus.51299 (2023). - PMC - PubMed
    1. Schiano, C. et al. Soft drinks and sweeteners intake: possible contribution to the development of metabolic syndrome and cardiovascular diseases. Beneficial or detrimental action of alternative sweeteners? Food Res. Int.142, 110220. 10.1016/j.foodres.2021.110220 (2021). - PubMed

MeSH terms

LinkOut - more resources