. 2025 Jul 1;15(1):20658.
doi: 10.1038/s41598-025-06272-7.

Multiomics approach provides insight into altered choline metabolism and liver injury in patients with glycogen storage disease type Ia

Affiliations

Multiomics approach provides insight into altered choline metabolism and liver injury in patients with glycogen storage disease type Ia

Francesca Pirozzi et al. Sci Rep. .

Abstract

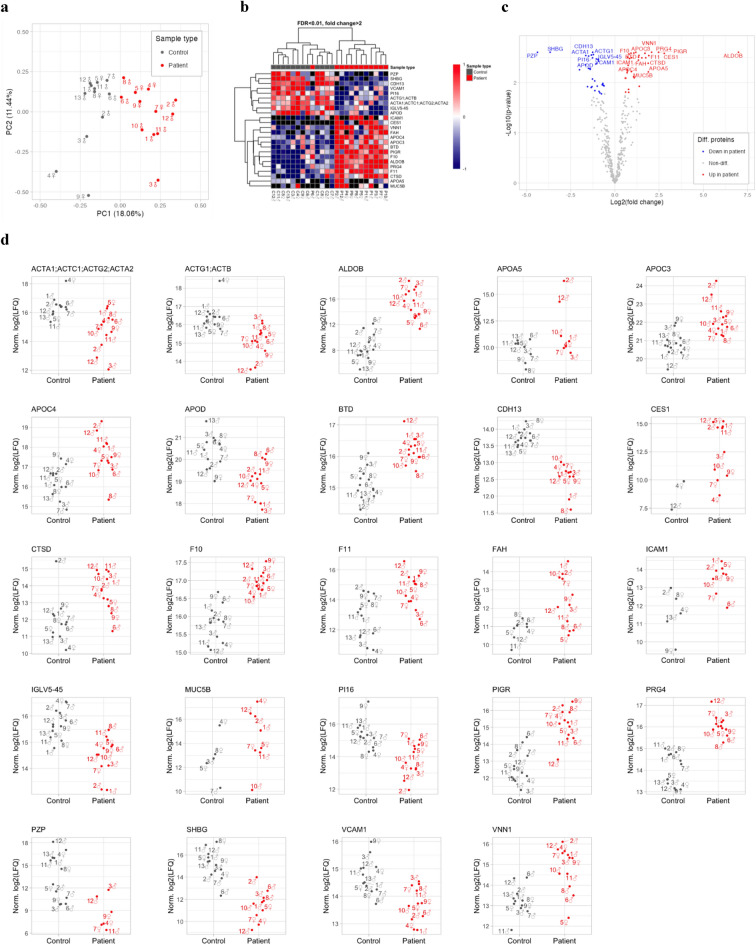
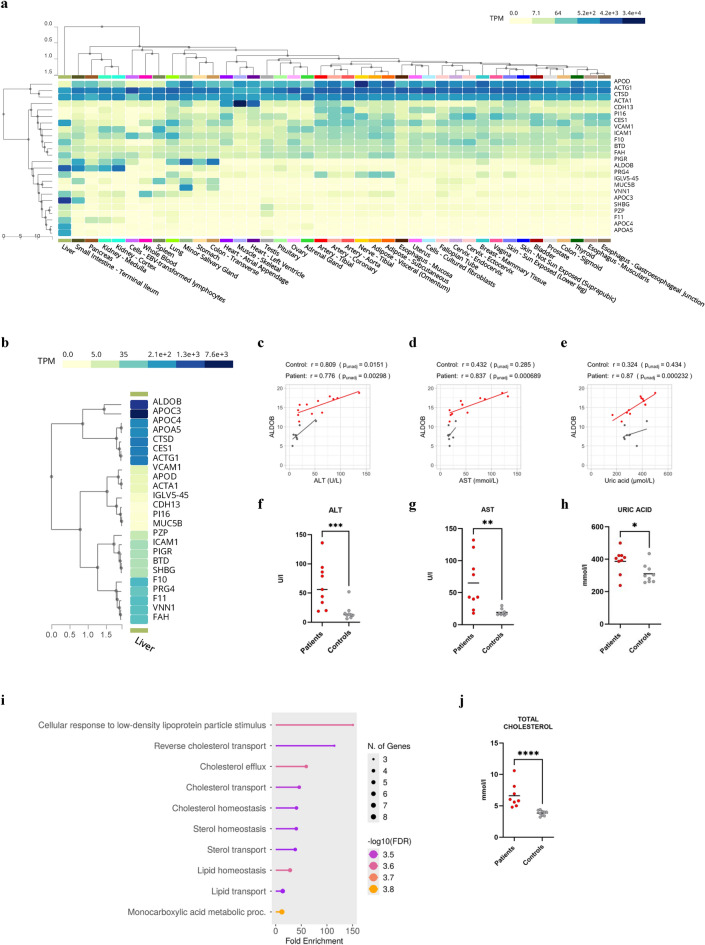
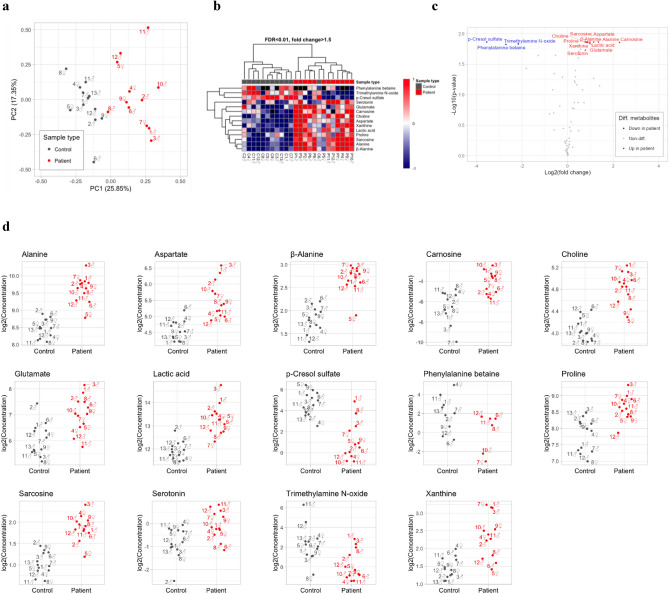
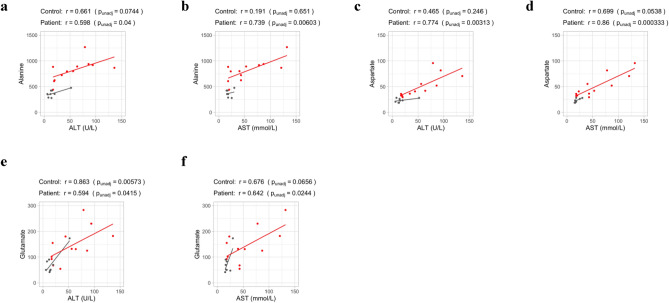
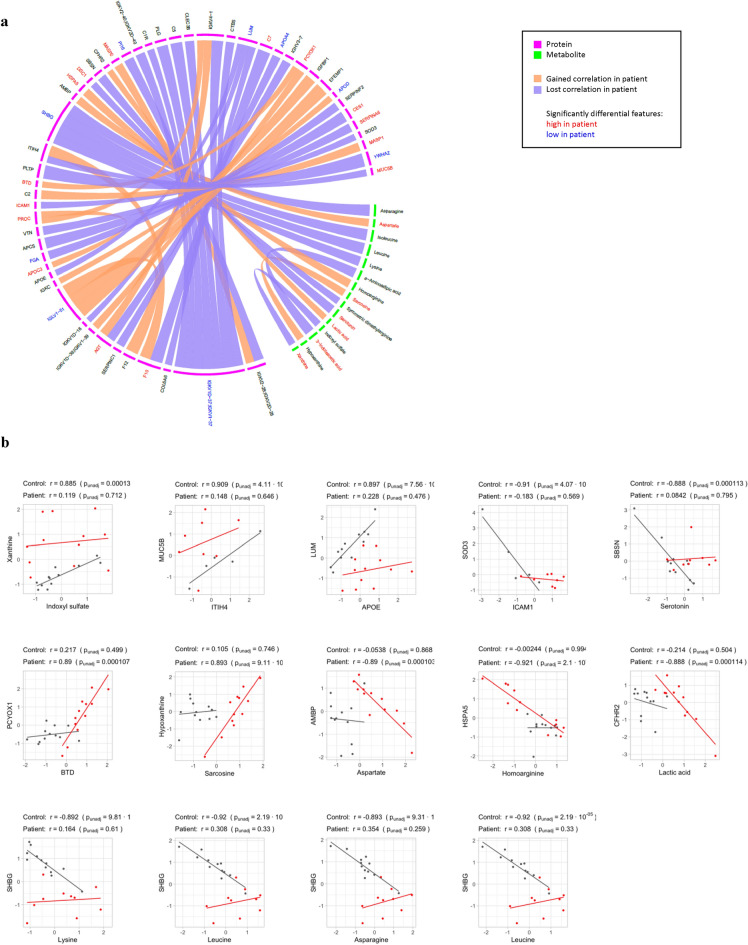
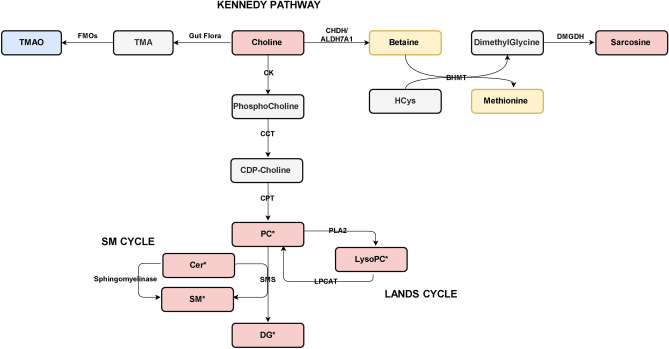
Glycogen storage disease type Ia (GSDIa) is an inherited disorder of carbohydrate metabolism. Patients present with excessive storage of glycogen and fat in the liver and kidneys and are potentially at risk of developing long-term complications. Currently, the mainstay of treatment is highly tailored dietary regimens aimed at improving metabolic control. In the present study, to better elucidate the mechanisms potentially involved in the development of long-term complications, a mass spectrometry-based strategy was employed for an in-depth characterization of the serum proteomic and metabolomic profile of n.12 GSDIa patients. The detection of differential abundance of highly liver-specific circulating proteins and choline-related metabolites in patients provides new insights into the extent of liver damage and dysregulation of lipid metabolism in GSDIa. Specifically, the differential abundance of serum aldolase B and its positive correlation with traditional liver function markers supports its role as a potential biomarker for long-term monitoring of GSDIa liver injury.

Keywords: ALDOB; Glycogen storage disease type Ia; Lipid metabolism; Liver injury; Multiomics; Serum biomarkers.


Conflict of interest statement

Declarations. Competing interests: The authors declare no competing interests.

Figures

Fig. 1
Fig. 1
Serum proteomic profile of patients with GSDIa. (a) Principal component analysis (PCA). The first principal component (PC1) explains 18.06% and the second principal component (PC2) explains 11.44% of the total variance in the data between patients and HC. (b) Hierarchical clustering with heat map visualization of differential proteins for adj. p < 0.01 and |FC|> 2. Heat map colour coding represents relative protein abundance: red and blue represent increased and decreased levels of each protein in patients compared to HC. (c) Volcano plot of differential proteins for adj. p < 0.05 and |FC|> 1.5. Labels only for significantly different proteins with adj. p < 0.01 and |FC|> 2. Blue and red dots refer to significantly decreased and increased proteins, respectively, in patients compared to HC. (d) Scatter plots of all differential proteins with adj. p < 0.01 and |FC|> 2 in terms of log2(LFQ) normalized values. Each dot is annotated with patient number and sex (♂ represents male, ♀ represents female). Missing values, imputed for the differential analysis are not shown. The corresponding tabular data are presented in Supplementary Table 1.
Fig. 2
Fig. 2
Investigation of differential serum protein content of patients with GSDIa. (a) Heatmap of tissue gene expression profile of differential proteins in GSDIa. Heatmap color coding represents different transcript distribution values in different tissues, expressed as TPM. Clustering of liver proteins was observed. (b) Extrapolation of liver-specific tissue gene expression profile from (a). (c–e) Simple linear regression analysis between log2(LFQ) normalized ALDOB values and serum levels of ALT (c) and AST (d), and uric acid I in patients with GSDIa. Solid lines represent the result of the linear fit. Solid line colour code represents patient (red) and HC (grey) trend. R: Pearson’s correlation. Punadj: uncorrected p value. Missing values, imputed for the differential analysis are not shown. (f–h) Plots of differential serum ALT (f), AST (g), and uric acid (h) levels, expressed as (means ± SEM) in GSDIa patients versus HC. The significant difference (*p < 0.05, **p < 0.01, ***p < 0.001) was evaluated by performing Mann–Whitney comparison test. (i) Lollipop charts of the top 10 biological processes enriched from the input data list of differentially expressed proteins in the serum of patients with GSDIa. The −log10(FDR) values for each pathway were expressed on a color scale between orange and purple. (j) Plot of differential serum total cholesterol levels, expressed as (means ± SEM) in GSDIa patients versus HC. The significant difference (*p < 0.05, **p < 0.01, ***p < 0.001) was evaluated by performing Mann–Whitney comparison test.
Fig. 3
Fig. 3
Serum metabolomics profile of patients with GSDIa. (a) Principal component analysis (PCA). The first principal component (PC1) explains 25.85% and the second principal component (PC2) explains 17.35% of the total variance in the data between patients and HC. (b) Hierarchical clustering with heat map visualization of differential metabolites for adj. p < 0.01 and |FC|> 1.5. Heat map colour coding represents relative metabolite abundance: red and blue represent increased and decreased levels of each metabolite in patients compared to HC. (c) Volcano plot of differential metabolites for adj. p < 0.01 and |FC|> 1.5. Blue and red dots refer to significantly decreased and increased metabolites, respectively, in patients compared to HC. (d) Scatter plots of the significantly differential metabolites in terms of log2 raw concentration. Missing values, imputed for the differential analysis are not shown. The corresponding tabular data are presented in Supplementary Table 2.
Fig. 4
Fig. 4
Relevant clinical correlations between differential serum metabolites and traditional parameters of liver function in GSDIa patients. (a–f) Simple linear regression plots of significant correlations found between differential serum Ala, Asp, Glu levels and serum ALT, AST levels in patients with GSDIa. Solid lines represent the result of the linear fit. Solid line colour code represents patient (red) and HC (grey) trend. R: Pearson’s correlation. Punadj: uncorrected p value. Missing values, imputed for the differential analysis are not shown.
Fig. 5
Fig. 5
Multiomics correlation changes in GSDIa. (a) Selected lost or gained significant Pearson’s correlations in patients with respect to HCs (adjusted p-value < 0.1) with |corr.coeff patient – corr.coeff. HC|> 0.6 and at least one of the connected features significantly different between patients and HCs. Pink circular sectors correspond to proteins, green to metabolites. The width of the circular sectors is proportional to |corr. Coeff. Patient – corr. Coeff. HC|. The orange and purple edge colours indicate gained and lost correlations in patients. Molecules highlighted in red are significantly increased in patients, those highlighted in blue are decreased. (b) Scatter plot of z-scores of the indicated features with significant correlation difference between control and patient. Solid lines represent the result of the linear fit. Solid line colour code represents patient (red) and HC (grey) trend. R: Pearson’s correlation. Punadj: uncorrected p value. Missing values, imputed for the differential analysis are not shown.
Fig. 6
Fig. 6
Proposed pathomechanisms involving choline metabolism in GSDIa. The increase in choline and the decrease in the choline-related metabolite TMAO, in parallel with an increase in the choline-related metabolite sarcosine, and the higher levels of PC, LysoPC, DG, SM and Cer obtained in our previous serum lipidomics study on the same cohort of patients with GSDIa, suggest an increased rate of the Kennedy pathway and, simultaneously, of the SM and Lands cycles in GSDIa. In this context, the role of PC in the Cer/SM balance is crucial: phosphocholine is transferred from PC to Cer via SMS and subsequently released as diacylglycerols. This process is coupled to the hydrolysis of SM to Cer by sphingomyelinase. In addition, PC promotes the increase of LysoPC in the Lands cycle through its hydrolysis mediated by PLA2. Choline is also a methyl group donor in homocysteine metabolism through its conversion to betaine and its metabolism to dimethylglycine. The increase in serum sarcosine levels from dimethylglycine can be explained as compensation for the increased levels of choline converted to PC in the Kennedy pathway. Metabolites detected and identified as elevated are shown in red; those detected and identified as decreased are shown in blue. The presence of an asterisk refers to metabolites that were found to be differentially abundant in our previous lipidomics study18 performed on the same cohort of GSDIa patients. Metabolites that were measured and found not to be differentially abundant are indicated by a yellow colouring. Abbreviations. ALDH7A1, betaine aldehyde dehydrogenase; BHMT, betaine-homocysteine S-methyltransferase; CCT, phosphocholine cytidylyltransferase; CHDH, choline dehydrogenase; CK, choline kinase; CPT, cholinephosphotransferase; DMGDH, dimethylglycine dehydrogenase; FMOs, flavin monooxygenase enzymes; LPCAT, Lysophosphatidylcholine acyltransferase; PLA2, Phospholipase A2; SMS, sphingomyelin synthase.

Similar articles

References

    1. Hannah, W. B. et al. Glycogen storage diseases. Nat. Rev. Dis. Primers9, 46. 10.1038/s41572-023-00456-z (2023). - PubMed
    1. Molares-Vila, A., Corbalán-Rivas, A., Carnero-Gregorio, M., González-Cespón, J. L. & Rodríguez-Cerdeira, C. Biomarkers in glycogen storage diseases: An update. Int. J. Mol. Sci.22, 4381. 10.3390/ijms22094381 (2021). - PMC - PubMed
    1. Kanungo, S., Wells, K., Tribett, T. & El-Gharbawy, A. Glycogen metabolism and glycogen storage disorders. Ann. Transl. Med.6, 474 (2018). - PMC - PubMed
    1. Chou, J. Y., Jun, H. S. & Mansfield, B. C. Type I glycogen storage diseases: disorders of the glucose-6-phosphatase/glucose-6-phosphate transporter complexes. J. Inherit. Metab. Dis.38, 511–519 (2015). - PubMed
    1. Froissart, R. et al. Glucose-6-phosphatase deficiency. Orphanet. J. Rare Dis.6, 1–12. 10.1186/1750-1172-6-27 (2011). - PMC - PubMed

LinkOut - more resources