Comparative Study
. 2025 Jul 1;8(1):974.
doi: 10.1038/s42003-025-08297-0.

Higher dopamine D1 receptor expression in prefrontal parvalbumin neurons underlies higher distractibility in marmosets versus macaques

Affiliations
Comparative Study

Higher dopamine D1 receptor expression in prefrontal parvalbumin neurons underlies higher distractibility in marmosets versus macaques

Mary Kate P Joyce et al. Commun Biol. .

Abstract

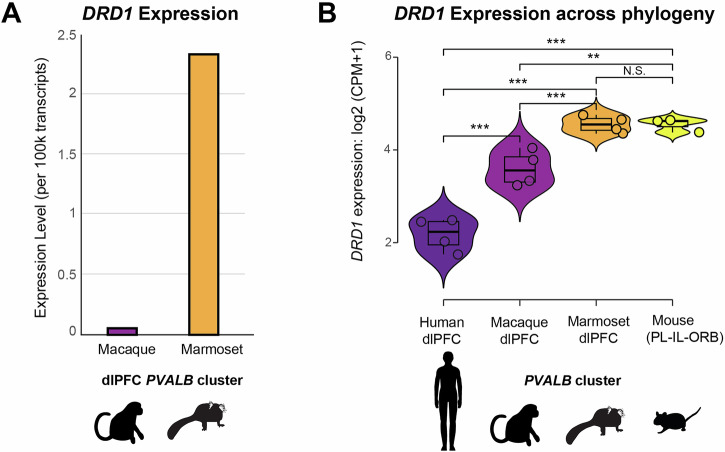
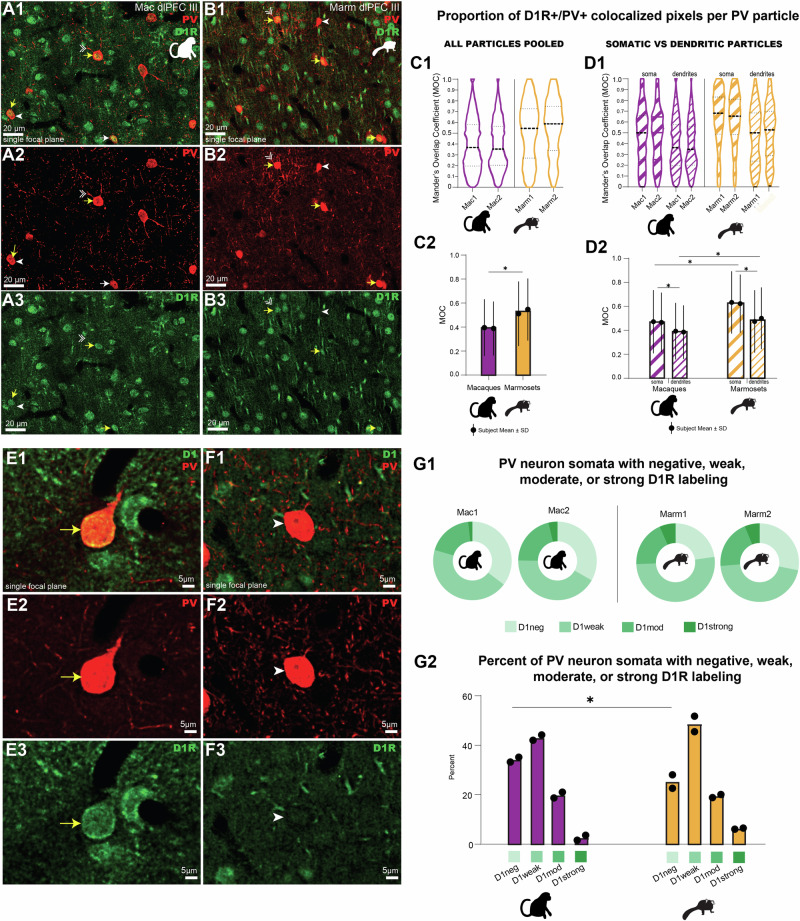
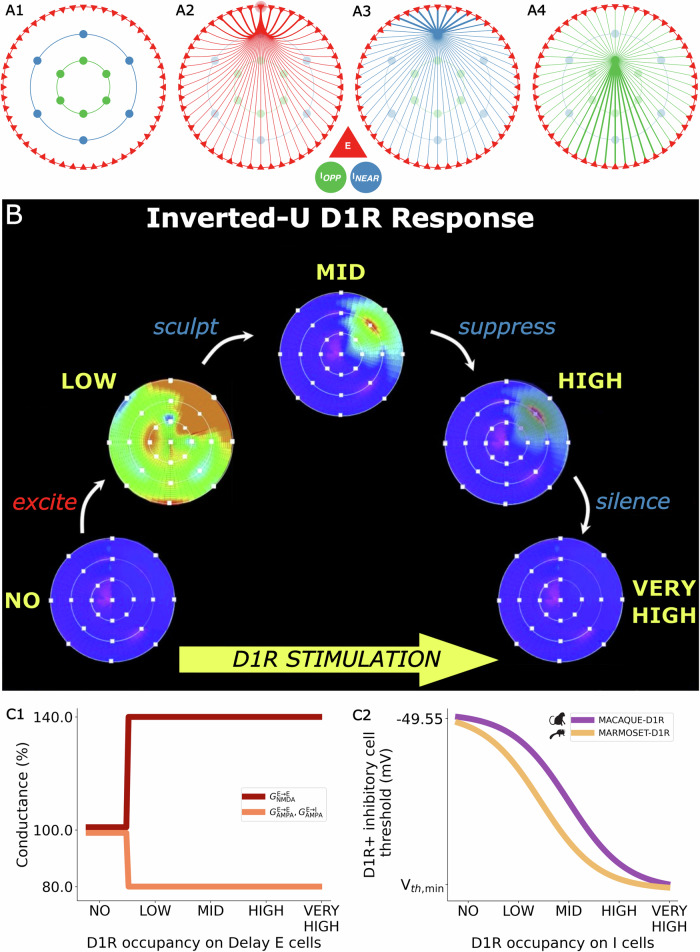
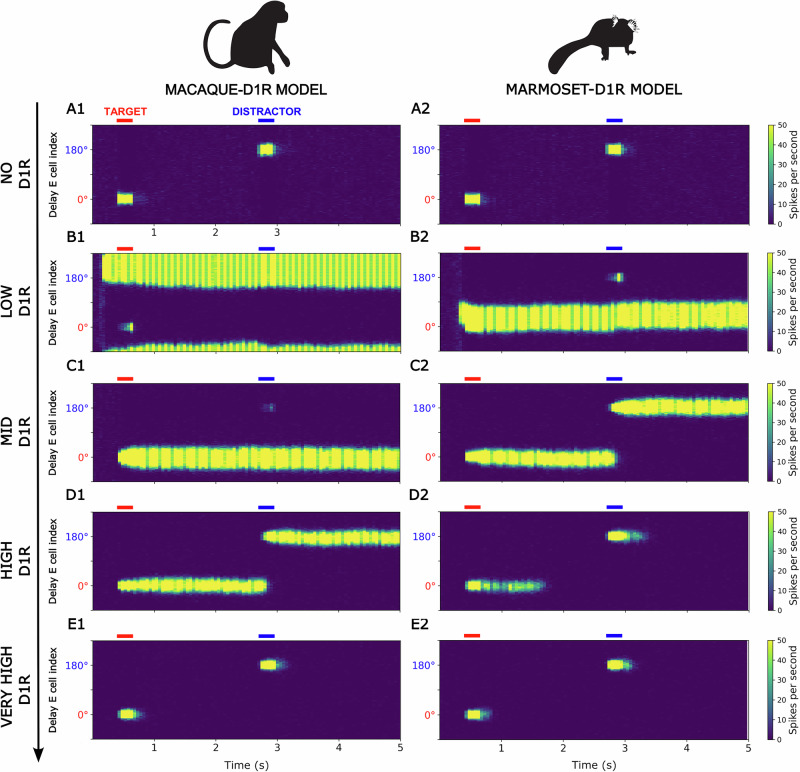
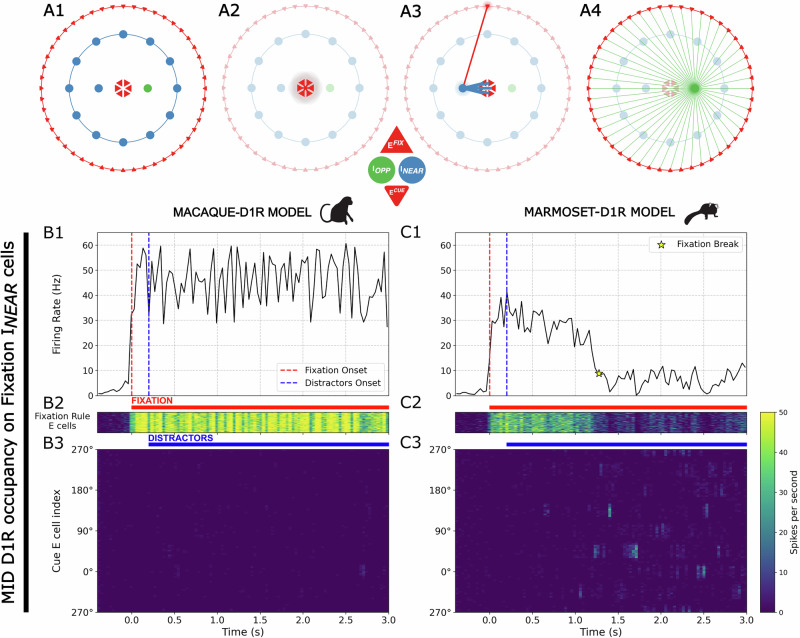
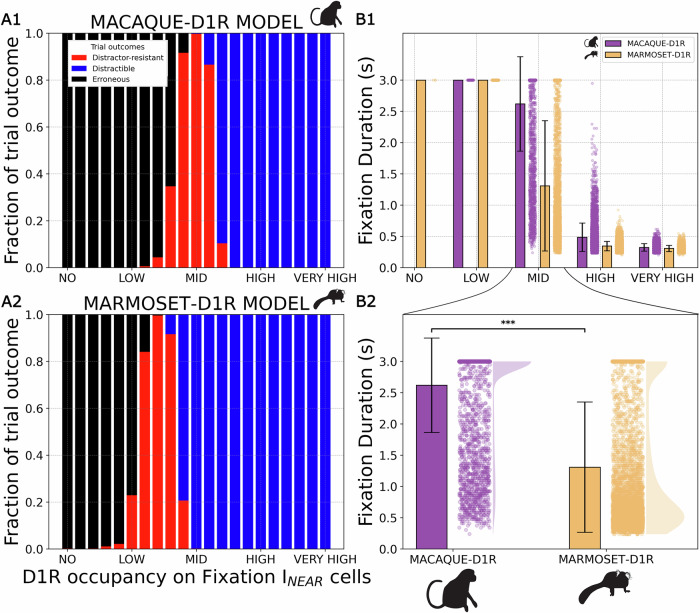
Marmosets and macaques are common nonhuman primate models of cognition, yet marmosets appear more distractible and perform worse in cognitive tasks. The dorsolateral prefrontal cortex (dlPFC) is pivotal for sustained attention, and research in macaques suggests that dopaminergic modulation and inhibitory parvalbumin (PV) neurons could influence distractor resistance. Here we compare the two species using a visual fixation task with distractors, perform molecular and anatomical analyses in dlPFC, and link functional microcircuitry with cognitive performance using computational modeling. We show that marmosets are more distractible than macaques, and that marmoset dlPFC PV neurons contain higher levels of dopamine D1 receptor (D1R) transcripts and protein, similar to levels in mice. Our modeling indicates that higher D1R expression in marmoset dlPFC PV neurons may increase distractibility by making dlPFC microcircuits more vulnerable to disruptions of their task-related persistent activity, especially when dopamine is released in dlPFC in response to unexpected salient stimuli.


Conflict of interest statement

Competing interests: The authors declare no competing interests.

Figures

Fig. 1
Fig. 1. Marmosets held central fixation in the presence of peripheral distractors for less than half as long as macaques.
A Schematic of the task setup. A macaque and a marmoset face a screen, and an eye tracker monitors their eye movements. Monkeys receive a juice reward for maintaining fixation at the central point in the presence of peripheral distractors. B Schematic of the task progression. A point appears at the center of the screen, and the monkey fixes its gaze (yellow) on the central point. Gabor stimuli flash in and out of the periphery, and the monkey is rewarded for maintaining its fixation on the central target (“Hit”) despite the distracting peripheral stimuli. A reward is withheld if the monkey breaks fixation (“Error”). C Time held fixating at a central point in the presence of visual distractors across species. Bars indicate group mean fixation duration for macaques (n = 2, purple) and marmosets (n = 8, orange). Thick black line on the marmoset bar depicts ±2 standard error of the mean (SEM); Black circles and thin lines depict individual subject mean fixation duration ± standard deviation (SD). *p < 0.05, two-tailed rank-sum test.
Fig. 2
Fig. 2. Marmoset dlPFC PVALB neurons have higher DRD1 expression than macaque PVALB neurons.
A DRD1 expression in PVALB clusters of the dlPFC in macaques (n = 2, purple) and marmosets (n = 12, orange), depicted as expression per 100,000 transcripts. B Library size-normalized expression of DRD1 in adult cortical PVALB neurons across human dlPFC (n = 4, dark purple), macaque dlPFC (n = 4, plum), marmoset dlPFC (n = 4, orange), and mouse prefrontal cortex (n = 3, yellow). Data mined from ref. and ref. . Due to the lack of dlPFC homology in mice, we included mouse PL-IL-ORB (prelimbic, infralimbic, and orbital regions, yellow) regions, which are analogous substrates for some primate dlPFC cognitive functions. Each dot represents a pseudobulk donor, and the significance of the gene expression differences was tested by edgeR. CPM counts per million; ***p < 0.001; **p < 0.01; NS not significant.
Fig. 3
Fig. 3. Marmosets have higher correlates of D1R protein expression in layer III dlPFC PV neurons than macaques.
A, B Confocal photomicrographs with brightness and contrast adjustments depicting a single focal plane imaged in layer III of the macaque (A) and marmoset (B) dlPFC labeled for PV (red) and D1R (green). Images depict some PV neurons robustly expressing D1R (yellow arrows) or not expressing D1R (white arrowhead). Double-headed white arrowheads depict proximal PV dendrites, defined by being traceable to a parent PV soma. C1 Violin plots with medians and quartiles, depicting kernel density of the Manders’ overlap coefficient (MOC) pooled across all PV particles per subject (n = 2 macaques, n = 2 marmosets). MOC roughly measures the proportion of D1R+/PV+ pixels in each PV particle. Macaques, purple; marmosets, orange. C2 Bars depict species mean MOC for PV particles depicted in C1 (macaques: 0.39 ± 0.01 standard deviation (SD); marmosets: 0.53 ± 0.03 SD; two-tailed t-test, t(2) = 7.283, p = 0.0183, R2 = 0.9637, difference between means = 0.1387 with 95% CI = [0.057, 0.22]). D1 Violin plots with medians and quartiles, depicting kernel density of the MOC across subjects for PV particles in (C), but segregated into two categories: somata and proximal dendrites (thick stripes) or other dendrites not traceable to a soma (thin stripes). D2 Bars depict species mean MOC across proximity to soma classification (macaques soma and proximal: 0.47 ± 0.004 SD; macaques other: 0.39 ± 0.01 SD; marmosets soma and proximal: 0.62 ± 0.01 SD; marmosets other: 0.47 ± 0.02 SD; two-way ANOVA, species F1,4 = 293.7, p < 0.0001, explaining 55% of total variation; proximity to soma F1,4 = 216.9, p = 0.0001, explaining 41% of total variation; interaction F1,4 = 16.27, p = 0.0157, explaining 3% of total variation); pairwise testing with Sidak’s correction confirmed significant effects within species (marm prox vs. marm other, p = 0.0011, mean difference 0.1403, 95% CI = [0.089, 0.19]; mac prox vs. mac other, p = 0.0098, mean difference 0.080, 95% CI = [0.029, 0.13]), and between species (marm prox vs. mac prox, p = 0.0007, mean difference 0.1583, 95% CI = [0.11, 0.21]; marm other vs. mac other, p = 0.0045, mean difference 0.098, 95% CI = [0.047, 0.15]). E, F Confocal photomicrographs of single focal planes imaged in layer III dlPFC labeled for PV (red) and D1R (green). Images depict exemplar PV neurons that fell in the D1R strong category (D1strong, yellow arrows, E), or D1R negative category (D1neg, white arrowheads, F) for analyses in (G). G1 Proportion of PV neurons falling into four D1R expression bins (D1neg, D1weak, D1moderate, and D1strong) by subject. Bins were determined objectively for each individual image by binning the image’s own D1R signal intensity range. To be classified as D1neg, D1R mean gray value (MGV) in the PV neuron was less than the average D1R MGV sampled in the immunonegative “neuropil”. To be classified as D1strong, the D1R MGV of the PV neuron was above the minimum MGV of the most “strongly” labeled D1R neurons in the image, which were typically pyramidal in morphology. Intermediate D1R expression categories D1weak and D1moderate are intermediate bins between D1neg and D1strong. G2 Species mean for each D1R expression category (two-way ANOVA, F3,8 = 215.4, p < 0.0001, with Sidak’s corrected multiple comparison test, mean D1neg macaques: 34 ± 1% SD, marmosets: 25 ± 4% SD, 95% CI for mean difference = [1.33, 16.43], p = 0.022). Macaques, purple; marmosets, orange. *p < 0.05; D1R dopamine D1 receptor, dlPFC dorsolateral prefrontal cortex, Mac macaque, Marm marmoset, MOC Manders’ overlap coefficient, PV parvalbumin, SD standard deviation.
Fig. 4
Fig. 4. Spiking network architecture and synaptic connectivity in the visuospatial working memory model, the inverted-U relationship between D1R stimulation and persistent activity during the delay period of visuospatial working memory tasks, and microcircuit effects of D1R occupancy.
A Simplified schematic representations of (A1) the functional architecture of the Delay cell microcircuit comprising 80% near feature-tuned E cells, 10% INEAR cells, and 10% IOPP cells, with example connectivity profiles for (A2) an E cell to each other E cell, (A3) an INEAR cell to all E cells, and (A4) an IOPP cell to all E cells, where the source cell is positioned at 0°. For each profile, a halo surrounds the cell from which the projections originate. Projection thickness indicates relative connection strength. E cells are arranged uniformly on a ring, in functional feature space, according to the angle of the visual stimuli for which they fire the most. Inhibitory cells are also arranged uniformly on a ring, based on the angular position of the E cells from which they receive the strongest excitation. The microcircuit features E → E, E → I, I → E, and I → I synapses. E cells send their strongest glutamatergic projections to all cells at the same angle as themselves. INEAR cells send their strongest GABAergic projections to all cells also at the same angle as themselves, while IOPP cells—to all cells positioned 180° away from them on the ring. B Diagram illustrating the idealized inverted-U response, characterized by the delay-period activity during visuospatial working memory maintenance in macaques under varying D1R stimulation conditions (adapted with permission from ref. ). At one extreme, no D1R stimulation means E cells cannot support persistent activity during the delay period, with only transient activity recorded during stimulus application. In the increasing phase of the inverted-U, low (suboptimal) D1R stimulation induces erroneous (here specifically, noise-evoked and/or spatially diffuse) persistent activity due to disinhibition. At the peak of the inverted-U, mid (optimal) D1R stimulation sculpts spatially precise, noise- and distractor-resistant persistent activity. Crucially, in the decreasing phase of the inverted-U, high (supraoptimal) D1R stimulation suppresses E cells, decreasing their firing rates, and thus increasing the susceptibility of the persistent activity for target stimuli to disruptions by distractors. Finally, at the other extreme of the inverted-U, very high D1R stimulation silences E cells completely, precluding the formation of persistent activity, again with only transient activity being recorded during stimulus application. C1 Step-like relationships between D1R occupancy and (1) GE→E, NMDA and (2) GE→E, AMPA and GE→I, AMPA, as percentages of their respective baseline values. From no to low D1R occupancy, specifically at x = 0.125, we increased GE→E, NMDA by 40% and decreased GE→E, AMPA and GE→I, AMPA by 20%. We applied the same D1R modulations of GE→E, NMDA, GE→E, AMPA, and GE→I, AMPA, in the marmoset-D1R model and the macaque-D1R model. C2, Sigmoidal relationship between D1R occupancy and the species-D1R model-specific firing thresholds of the D1R+ inhibitory cells across the microcircuit models (and the different networks of the working memory maintenance model). We decreased the firing thresholds of D1R+ inhibitory cells from their baseline (Vth, base) of −49.55 mV at no D1R occupancy, through the low, mid, and high levels, and to a minimum (Vth, min) at the very high level. Vth, min differed across networks.
Fig. 5
Fig. 5. Distractible, decreasing phase of inverted-U shifted to typical, mid D1R occupancy in the marmoset-D1R model.
Rastergrams represent the color-coded, unmanipulated spike time series of Delay E cells in Network 1 for the macaque-D1R model (A1E1) and the marmoset-D1R model (A2E2), during example 5-s trials of the simulated visuospatial working memory maintenance task across the five main D1R occupancy levels (AE). Delay E cells are indexed by the angular position from 0° to 360° of their preferred stimuli. The strength of the stimuli is 0.200 pA. For visualization purposes, the y-axis wraps around 270° to accentuate the target (0°) and distractor (180°) positions, and the color scale is capped to reduce the dominance of outliers in the heatmap, such that any firing rate of >50 Hz per s per neuron is plotted in the same color as firing rates of 50 Hz.
Fig. 6
Fig. 6. Progressively leftward shift of inverted-U with greater D1R stimulation in marmoset-D1R models of covert working memory maintenance, relative to the macaque-D1R model.
Fractions of classified outcomes of 1000 trials across the granulated D1R occupancy scale in the visuospatial working memory maintenance task with distractors presented only at 180° to Network 1 for the macaque-D1R model and the three cases of Vth sigmoid midpoint shift for the marmoset-D1R model. The strength of the stimuli is 0.200 pA. In the no D1R occupancy range, both species-D1R models (AD) show transient activity. In the low D1R occupancy range, the macaque-D1R model (A) exhibits predominantly erroneous persistent activity, while the base marmoset-D1R model case (B) transitions from the erroneous to the noise- and distractor-resistant persistent activity regime, the medium marmoset-D1R model case (C) transitions from the noise- and distractor-resistant to the distractible persistent activity regime, and the extreme marmoset-D1R model case (D) exhibits predominantly distractible persistent activity. In the mid D1R occupancy range, the macaque-D1R model (A) overwhelmingly exhibits noise- and distractor-resistant persistent activity. The base marmoset-D1R model case (B) transitions to the distractible persistent activity regime, with a decreasing fraction of noise- and distractor-resistant persistent activity. The medium marmoset-D1R model case (C), transitions to transient activity, with a decreasing fraction of distractible persistent activity and a significant fraction of erroneous persistent activity (indicating persistent activity that is disrupted before the readout due to overinhibition). The extreme marmoset-D1R model case (D), which predominantly exhibits transient activity. In the high D1R occupancy range, the macaque-D1R model (A) reliably exhibits a distractible persistent activity regime, while the base marmoset-D1R model case (B) transitions from the distractible persistent activity to the transient activity regime, with a significant fraction of erroneous persistent activity, and the medium and extreme marmoset-D1R model cases (C, D) exhibit transient activity. Finally, in the very high D1R occupancy range, both species-D1R models (AD) settle into a transient activity regime. Notably, as the shift increases across the marmoset-D1R model cases, the range of D1R occupancies which can support persistent activity decreases.
Fig. 7
Fig. 7. Spiking network architecture and synaptic connectivity in the visual fixation model, and example trials in the simulated task.
Simplified schematic representations of A1 the functional architecture of the microcircuit, comprising 71.11% near feature-tuned Cue E (ECUE) cells, 17.78% Cue INEAR cells, 8.89% identically tuned Fixation Rule E (EFIX) cells, 1.11% Fixation INEAR cells, and 1.11% Fixation IOPP cells, A2 all Fixation Rule E cells fully connected with each other with equal synaptic strengths, A3 the local feedforward inhibitory motif where an example Cue E cell positioned at 0° excites a Fixation INEAR cell, which in turn inhibits the Fixation Rule E cells, A4 the local top-down inhibitory motif where an example Fixation IOPP cell, driven by the Fixation Rule E cells (Fig. S7), inhibits the Cue E cells. Projection thickness indicates relative connection strength. Cue E cells are arranged uniformly on a ring, in functional feature space, according to the angle of the visual distractor stimuli for which they fire the most. Cue INEAR cells are also arranged uniformly on a ring, based on the angular position of the Cue E cells from which they receive the strongest excitation. Fixation Rule E cells represent the central fixation rule and have no angular position selectivity. The Fixation INEAR cells are co-tuned with the Fixation Rule E cells. Histograms represent the average firing rate in the Fixation Rule E population in the macaque-D1R model (B1) and the marmoset-D1R model (C1), during example three-second trials of the simulated visual fixation task at the typical, mid level of D1R occupancy on Fixation INEAR cells. The red dashed line at 0 s indicates the onset of the fixation cue. The blue dashed line at 0.2 s indicates the onset of the distractor cues. The yellow star indicates the time point when the average firing rate in the Fixation Rule E population for the marmoset-D1R model dropped to ≤10 Hz, indicating a fixation break. Rastergrams represent the color-coded, unmanipulated spike time series of Fixation Rule E cells and Cue E cells in the macaque-D1R model (B2-3) and the marmoset-D1R model (C2-3). Cue E cells are indexed by the angular position from 0° to 360° of their preferred stimuli. The strength of the stimuli is 0.200 pA. For visualization purposes, the y-axis wraps around 270° to be consistent with Fig. 5, and the color scale is again capped to reduce the dominance of outliers in the heatmap, such that any firing rate of >50 Hz per s per neuron is plotted in the same color as firing rates of 50 Hz.
Fig. 8
Fig. 8. Marmoset-D1R and macaque-D1R models of sustained attention reproduce differences in behavioral performance during visual fixation between the species.
A Fractions of classified outcomes of 1000 trials across the granulated scale of D1R occupancy on Fixation INEAR cells for each species-D1R model. The strength of the stimuli is 0.200 pA. In the no and low ranges of D1R occupancy on Fixation INEAR cells, the macaque-D1R model (A1) exhibits predominantly erroneous persistent activity, while the marmoset-D1R model (A2) transitions from the erroneous to the noise- and distractor-resistant persistent activity regime. In the mid D1R occupancy range, the macaque-D1R model overwhelmingly exhibits noise- and distractor-resistant persistent activity, while the marmoset-D1R model transitions to the distractible persistent activity regime, with a decreasing fraction of noise- and distractor-resistant persistent activity. Finally, in the high and very high D1R occupancy ranges, both species-D1R models reliably exhibit a distractible persistent activity regime. B Bars indicate the mean fixation duration in the visual fixation task within each of the five main ranges of D1R occupancy on Fixation INEAR cells, and for each species-D1R model. Until the optimal, mid range of D1R occupancy, the mean fixation duration from fixation cue onset was 3 s, indicating complete trials without fixation breaks, for both species-D1R models. Within the mid D1R occupancy range, the mean fixation duration began to decrease for both species-D1R models. The decreases were consistently greater for the marmoset-D1R model. Within the very high D1R occupancy range, the mean fixation duration reached approximately 0.30 s for both species-D1R models (B1). Notably, when estimating the mean fixation durations, we excluded trials where the species-D1R models exhibited erroneous persistent activity because these involved noise-evoked activations due to disinhibition in the Fixation Rule E cell population before the onset of any external stimuli (fixation or distractor cues). Thus, the number of non-erroneous trials for each main D1R occupancy range and species-D1R model were n = 3 (NO D1R, MARM-D1R), n = 0 (NO D1R, MAC-D1R), n = 2099 (LOW D1R, MARM-D1R), n = 52 (LOW D1R, MAC-D1R), n = 5000 (MID D1R, MARM-D1R), n = 4263 (MID D1R, MAC-D1R), n = 5000 (HIGH D1R, MARM-D1R), n = 5000 (HIGH D1R, MAC-D1R), n = 3000 (VERY HIGH D1R, MARM-D1R), n = 3000 (VERY HIGH D1R, MAC-D1R). Finally, we compared the mean fixation durations between the species-D1R models within the mid D1R occupancy range by performing a permutation test (B2). Colored circles represent fixation durations for individual non-erroneous trials, while half-violin plots visualize their distribution. Error bars depict ±SD. ***p < 0.001.

Similar articles

Cited by

References

    1. Kumita, W. et al. Efficient generation of knock-in/knock-out marmoset embryo via CRISPR/Cas9 gene editing. Sci. Rep.9, 12719 (2019). - PMC - PubMed
    1. Oikonomidis, L. et al. A dimensional approach to modeling symptoms of neuropsychiatric disorders in the marmoset monkey. Dev. Neurobiol.77, 328–353 (2017). - PMC - PubMed
    1. Glavis-Bloom, C., Vanderlip, C. R. & Reynolds, J. H. Age-related learning and working memory impairment in the common marmoset. J. Neurosci.42, 8870–8880 (2022). - PMC - PubMed
    1. Nakamura, K. et al. A method to train marmosets in visual working memory task and their performance. Front. Behav. Neurosci.12, 46 (2018). - PMC - PubMed
    1. Easton, A., Parker, K., Derrington, A. M. & Parker, A. Behaviour of marmoset monkeys in a T-maze: comparison with rats and macaque monkeys on a spatial delayed non-match to sample task. Exp. Brain Res.150, 114–116 (2003). - PubMed

Publication types

LinkOut - more resources