. 2025 Jul 1;15(1):20367.
doi: 10.1038/s41598-025-08345-z.

A bitopic mTORC inhibitor reverses phenotypes in a tuberous sclerosis complex model

Affiliations

A bitopic mTORC inhibitor reverses phenotypes in a tuberous sclerosis complex model

Sulagna Mukherjee et al. Sci Rep. .

Abstract

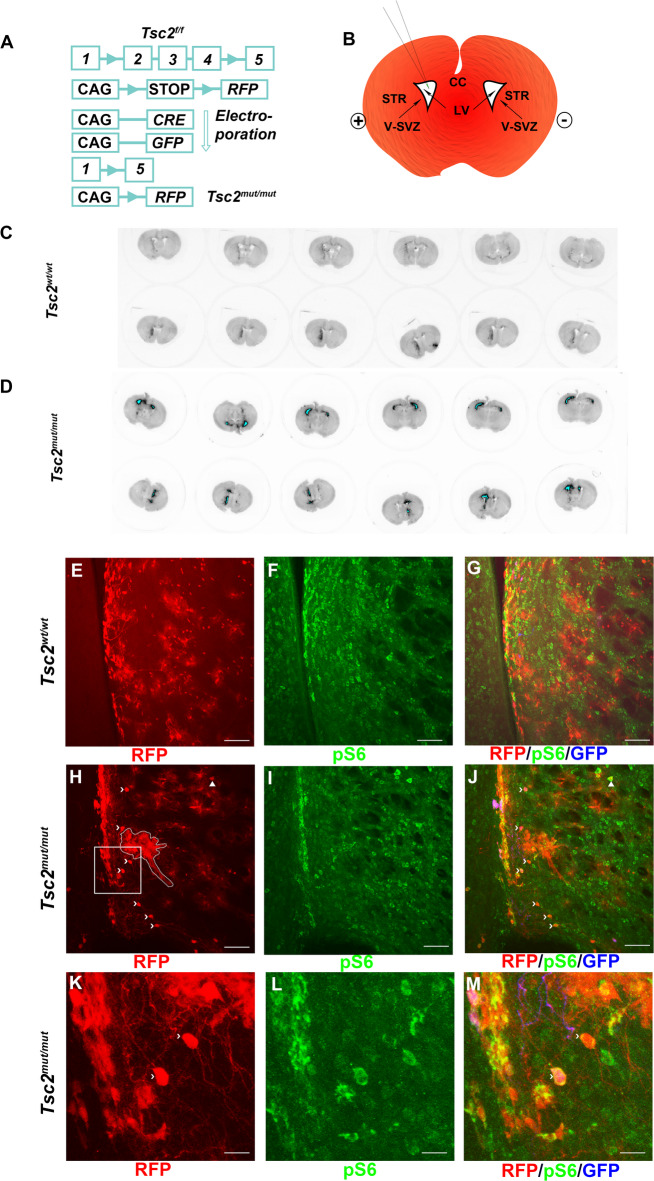
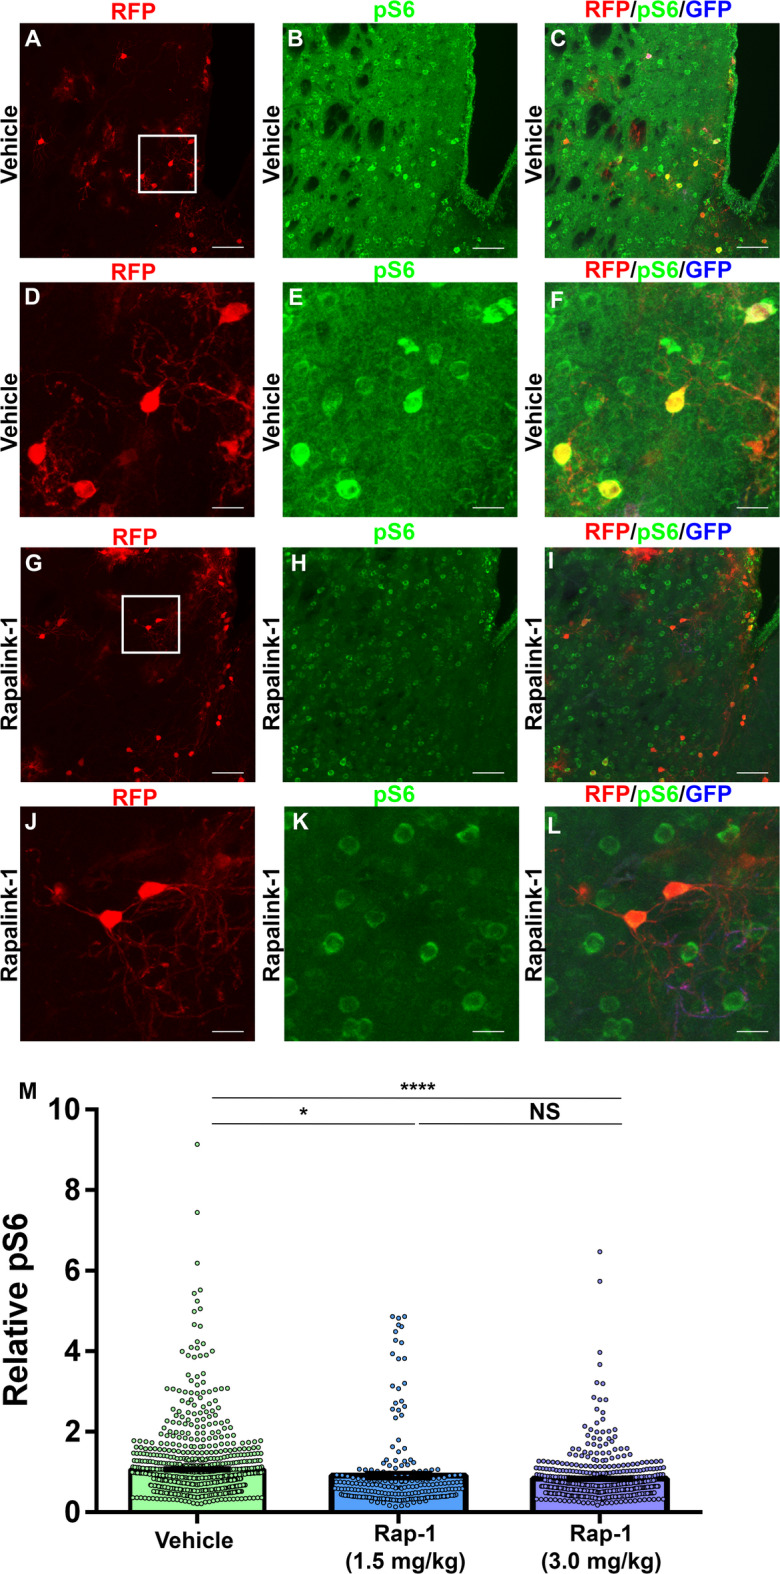
Neural stem cells (NSCs) of the ventricular-subventricular zone (V-SVZ) generate diverse cell types including striatal glia during the neonatal period. NSC progeny uncouple stem cell-related mRNA transcripts from being translated during differentiation. We previously demonstrated that Tsc2 inactivation, which occurs in the neurodevelopmental disorder Tuberous Sclerosis Complex (TSC), prevents this from happening. Loss of Tsc2 causes hyperactivation of the protein kinase mechanistic target of rapamycin complex 1 (mTORC1), altered translation, retention of stemness in striatal glia, and the production of misplaced cytomegalic neurons having hypertrophic dendrite arbors. These phenotypes model characteristics of TSC hamartomas called subependymal giant cell astrocytomas (SEGAs). mTORC1 inhibitors called rapamycin analogs (rapalogs) are currently used to treat TSC and to assess the role of mTORC1 in regulating TSC-related phenotypes. Rapalogs are useful for treating SEGAs. However, they require lifelong application, have untoward side effects, and resistance may occur. They also incompletely inhibit mTORC1 and have limited efficacy. Rapalink-1 is a bitopic inhibitor that links rapamycin to a second-generation mTOR ATP competitive inhibitor, MLN0128. Here we explored the effect of Rapalink-1 on a TSC hamartoma model. The model is created by neonatal electroporation of mice having conditional Tsc2 genes. Prolonged Rapalink-1 treatment could be achieved with 1.5 or 3.0 mg/Kg injected intraperitoneally every five days. Rapalink-1 inhibited the mTORC1 pathway, decreased cell size, reduced neuron dendrite arbors, and reduced hamartoma size. In conclusion, these results demonstrate that cellular phenotypes in a TSC SEGA model are reversed by Rapalink-1 which may be useful to resolve TSC brain hamartomas.

Keywords: MTORC1; Neurogenesis; Rapalink-1; SEGA; Subependymal giant cell Astrocytoma; Subependymal nodule; TSC; Tsc2; Tuberous sclerosis complex.


Conflict of interest statement

Declarations. Competing interests: The authors declare no competing interests. Conflict of interest: The authors declare that the researchers have no competing financial interests.

Figures

Fig. 1
Fig. 1
Rapalink-1 Treatment in a TSC Mouse Model. (A) Schematic diagram of conditional Tsc2 and inducible RFP genes. CRE recombinase causes Tsc2 exons 2–4 to recombine, and RFP to be expressed. (B) Schematic diagram of CAG-CRE and CAG-GFP (Green) plasmid electroporation. Plasmid is injected intraventricularly into P0-1 mice. Electrodes placed on the head of the pup subsequently cause plasmids to be taken up by NSCs lining the lateral ventricles when an electrical field is applied. C, D) Macroscopic images of coronal sections of P60 mice following electroporation. Black indicates RFP expression whereas blue indicates RFP saturation. E-G) Images of 20× Tsc2wt/wt coronal section demonstrating induction of RFP (red, E), pS6 staining (green, F), and composite with GFP expression (blue, G). H-J) Images of 20× Tsc2mut/mut coronal section demonstrating induction of RFP (red, H), pS6 staining (green, I), and composite with GFP expression (blue, J). K-L) 4× digital zoom of H-I showing cells with neuronal morphology and high pS6. Chevrons indicate macroscopic neurons, and arrowhead indicates a giant cell. E-J) Scale bar = 75 μm. K-M) Scale bar = 75 μm.
Fig. 2
Fig. 2
(A) Dose schedule. (B) Kaplan-Meier survival curve of control and Rapalink-1 treated mice. (C) Weights of control and Rapalink-1 treated mice. Data is represented as mean ± SEM.
Fig. 3
Fig. 3
Rapalink-1 Inhibits mTORC1 Activity. A-C) 20× images of RFP (red, A), pS6 (green, B), and composite with GFP (blue, C) in a coronal section of a Tsc2mut/mut P90 vehicle treated mouse brain. Rectangle denotes magnified region in D-F. D-F) 4× digital zoomed in images of A-C demonstrating neuronal morphology. G-I) 20× images of RFP (red, G), pS6 (green, H), and composite with GFP (blue, I) in a coronal section of a brain from a Tsc2mut/mut P90 Rapalink-1 (3 mg/kg) treated mouse. J-L) 4× digital zoomed in images of G-I demonstrating neuronal morphology. M) Quantification of pS6 in RFP positive cells. *=p < 0.05, ****=p < 0.0001. Data is represented as mean ± SEM. A-C and G-I scale bar = 75 μm. D-F and J-L scale bar = 18.75 μm.
Fig. 4
Fig. 4
Rapalink-1 Reduces Cell Size. A-D) 20× images of GFP (blue, A), RFP (red, B), pS6 (green, C), and composite (D) in Tsc2mut/mut P90 control brains. E-H) 20× images of GFP (blue, E), RFP (red, F), pS6 (green, G), and composite (H) in Tsc2mut/mut P90 Rapalink-1 (3 mg/kg) brains. I, J) Images from D and H magnified 400% showing examples of giant cells. K) Quantification of neuron soma size relative to controls. Data is represented as mean ± SEM. Scale bar = 75 μm. ****=p < 0.0001.
Fig. 5
Fig. 5
Rapalink-1 Reduces Dendrite Arbors in a TSC Model. (A) 20× image of RFP from a vehicle treated Tsc2mut/mut P90 mouse brain. (B) 20× image of RFP from a Tsc2mut/mut P90 3.0 mg/kg Rapalink-1 treated mouse brain. (C) Zoomed in image with a neuron in square of A subjected to tracing (green highlight). (D) Zoomed in image with a neuron in square of B subjected to tracing (green highlight). (E) Sholl Analysis demonstrating the effect of Rapalink-1 on dendrite arbors. (F) The total number of dendrite crossings in each neuron of control and Rapalink-1 treated mice. One-way analysis of variance (ANOVA) with Tukey’s multiple comparisons test. Data is represented as mean ± SEM. Scale bar = 75 μm (A, B) or 37.5 μm (C, D). **=p < 0.01.
Fig. 6
Fig. 6
Rapalink-1 Reduces Hamartoma Size. A-D) 20× images of GFP (blue), pS6 (green), and RFP (red) in Tsc2mut/mut P90 brains treated with vehicle or E-H) 20× images of GFP (blue), pS6 (green), and RFP (red) in Tsc2mut/mut P90 3.0 mg/kg Rapalink-1 treated brains. I) Quantification of lesion area. J) Schematic diagram of molecular pathways regulated by Tsc1/Tsc2 in TSC model in control and Rapalink-1 treated brains. Tsc1/Tsc2 turn off mTORC1 pathway under normal conditions. However, in the TSC SEGA model (left), Tsc1/Tsc2 encoded protein products cannot turn mTORC1 off leading to ectopic/cytomegalic neurons with excessive mTORC1 activity, hypertrophic dendrites, giant cells, and SEGA-like lesions (i.e. striatal hamartomas). Rapalink-1 appears to partially rescue these changes with mTORC1 inhibited, neuron size decreased, and reduced SEGA-like lesions. Data are represented as mean ± SEM. Scale bar = 150 μm (A, B) or 37.5 μm (C, D). *=p < 0.05.

References

    1. Northrup, H. et al. Updated international tuberous sclerosis complex diagnostic criteria and surveillance and management recommendations. Pediatr. Neurol.12310.1016/j.pediatrneurol.2021.07.011 (2021). - PubMed
    1. The European Chromosome 16 Tuberous Sclerosis Consortium. Identification and characterization of the tuberous sclerosis gene on chromosome 16. Cell75, 1305–1315. 10.1016/0092-8674(93)90618-Z (1993). - PubMed
    1. Van Slegtenhorst, M. et al. Identification of the tuberous sclerosis gene TSC1 on chromosome 9q34. Science277, 805–808. 10.1126/science.277.5327.805 (1997). - PubMed
    1. Feliciano, D. M. Modeling genetic mosaicism of the mammalian target of rapamycin pathway in the cerebral cortex. Front. Mammal Sci. 2. (2023). 10.3389/fmamm.2023.1231778
    1. Inoki, K., Li, Y., Xu, T. & Guan, K. L. Rheb GTpase is a direct target of TSC2 GAP activity and regulates mTOR signaling. Genes Dev.17, 1829–1834. 10.1101/gad.1110003 (2003). - PMC - PubMed

MeSH terms

LinkOut - more resources