. 2025 Jul 1;15(1):20848.
doi: 10.1038/s41598-025-06596-4.

Impact of low-intensity 463 nm blue light on proliferation and adaptive mutation of Escherichia coli DH5α cells

Affiliations

Impact of low-intensity 463 nm blue light on proliferation and adaptive mutation of Escherichia coli DH5α cells

Nagomi Matsumoto et al. Sci Rep. .

Abstract

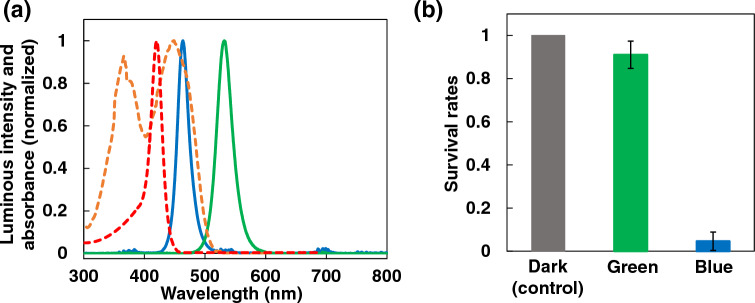
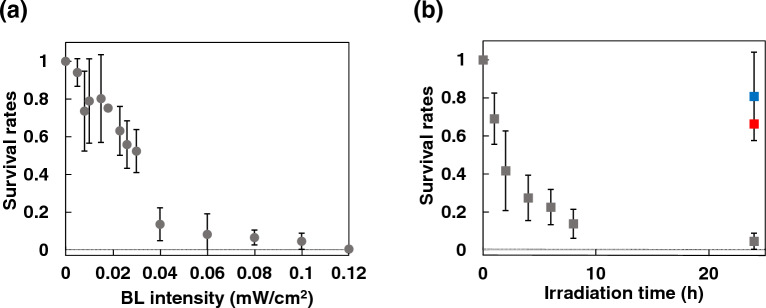
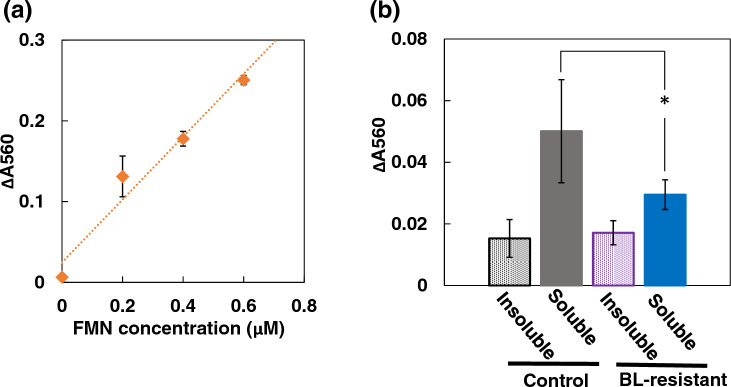
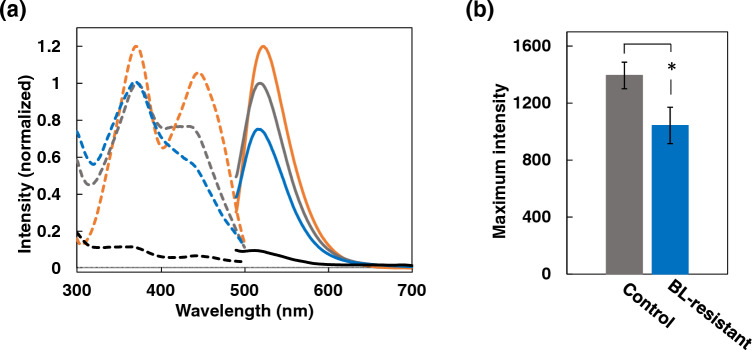
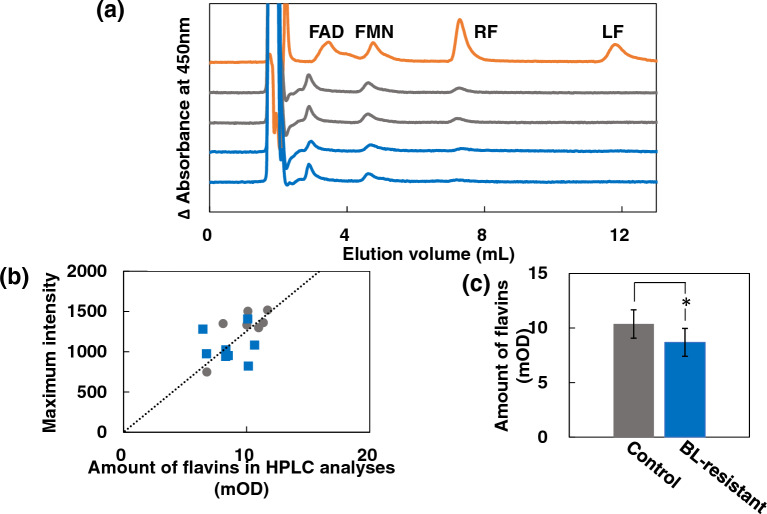
The growth rate of many microorganisms decreases when exposed to blue light (BL) at around 450 nm. This growth retardation is likely caused by the photosensitivity of endogenous photosensitizers, flavins, which absorb BL and generate reactive oxygen species (ROS) that cause inactivation and mutations of microorganisms. In this study, the effect of weak (0-0.12 mW/cm2) 463 nm BL on E. coli (DH5α) cell proliferation was investigated. Surprisingly, BL of only 0.03 mW/cm2 reduced the DH5α colony number by 52%, and about 5% of cells (BL-resistant cells) formed colonies under 0.1 mW/cm2 BL. Five-generation subculturing suggested that the BL-resistant cells underwent mutation(s) and adapted to grow under a BL environment. Fewer superoxide anion radicals were generated by BL irradiation in BL-resistant cells than in control DH5α cells because of the lower amount of intracellular flavins in BL-resistant cells. Our data suggest that the main photosensitizer of 463 nm BL is flavins, and ROS generated by BL-activated flavins induces inactivation and mutation(s) of DH5α cells. BL-resistant mutant cells with low amounts of intracellular flavins may reproducibly be generated by mutation(s) and preferentially proliferate under BL conditions.

Keywords: E. coli (DH5α); Blue light; Flavins; Reactive oxygen species (ROS); Stress-induced adaptive mutation.


Conflict of interest statement

Declarations. Competing interests: The authors declare no competing interests. Supplementary Information: Correspondence and requests for materials should be addressed to O.H.

Figures

Fig. 1
Fig. 1
Irradiation systems and the effects of visible light. (a) The emission spectra of blue (blue solid line) and green (green solid line) LED systems, and the absorption spectra of FMN (orange dashed line) and uroporphyrin (red dashed line). (b) The survival rates (S) under dark (gray bar) and green (green bar) or blue (blue bar) lights (0.1 mW/cm2).
Fig. 2
Fig. 2
Survival rates of DH5α cells under BL irradiation. (a) Survival rates of control DH5α cells under BL irradiation of 0–0.12 mW/cm2 for 24 h. (b) Survival rates under 0.1 mW/cm2 BL irradiation for 0–24 h for control DH5α cells (gray squares), BL-tolerant cells (blue square), and fifth-generation BL-resistant cells (red square).
Fig. 3
Fig. 3
BL-induced production of O₂•–. (a) Relationship between ΔA560 and concentration of FMN under 2 mW/cm2 BL for 5 min. (b) ΔA560 before and after incubation under 2 mW/cm2 BL for 5 min for insoluble (dotted black bar) and soluble (gray bar) fractions of control DH5α cells and for insoluble (dotted purple bar) and soluble (blue bar) fractions of BL-resistant cells. The asterisk indicates a statistically significant difference (p < 0.05).
Fig. 4
Fig. 4
Degradation of O₂•– by SOD activity. (a) Relationship between ΔA560FMN and SOD concentration (U/mL) in the presence of 0.4 µM FMN under 2 mW/cm2 BL for 5 min. (b) ΔA560FMN before and after 2 mW/cm2 BL for 5 min in the presence of 0.4 µM FMN with no cellular fraction (orange bar), with insoluble (dotted black bar) and soluble (gray bar) fractions of control DH5α cells and insoluble (dotted purple bar) and soluble (blue bar) fractions of BL-resistant cells. The asterisk indicates a statistically significant difference (p < 0.05).
Fig. 5
Fig. 5
Analyses of flavins by fluorescent spectra. (a) Representative fluorescence spectra excited at 460 nm (solid lines), and excitation spectra monitored by the fluorescence at 550 nm (dashed lines) of FMN (orange lines), insoluble (black lines) and soluble (gray lines) fractions of control DH5α cells and soluble fractions of BL-resistant cells (blue lines). (b) The maximum fluorescence intensities for soluble fractions of control (gray bar) and BL-resistant (blue bar) cells. The asterisk indicates a statistically significant difference (p < 0.05).
Fig. 6
Fig. 6
Analyses of flavins by HPLC. (a) Representative elution profiles of the four flavin standards (orange line), and control (gray lines) and BL-resistant (blue lines) cells monitored at 450 nm. The elution peak volumes of FAD in soluble fractions are shifted to the left, probably because of the presence of large amounts of hydrophilic components. (b) The correlation of flavin amounts estimated from HPLC analyses and the maximum fluorescence intensities of soluble fractions of control (gray circles) and BL-resistant (blue squares) cells. (c) The total amounts of flavins estimated from HPLC analyses. The asterisk indicates a statistically significant difference (p < 0.05, n = 8).

Similar articles

References

    1. Liang, J.-Y., Cheng, C.-W., Yu, C.-H. & Chen, L.-Y. Investigations of blue light-induced reactive oxygen species from flavin mononucleotide on inactivation of E. coli. J. Photochem. Photobiol. B.143, 82–88 (2015). - PubMed
    1. Abana, C. M. et al. Characterization of blue light irradiation effects on pathogenic and nonpathogenic Escherichia coli. Microbiol. Open.6, e466. 10.1002/mbo3.466 (2017). - PMC - PubMed
    1. Lawrence, C., Waechter, S. & Alsanius, B. W. Blue light inhibits E. coli, but decisive parameters remain hidden in the dark: Systematic Review and Meta-Analysis. Front. Microbiol.13, 867865. 10.3389/fmicb.2022.867865 (2022). - PMC - PubMed
    1. Huang, S., Qin, H. & Liu, M. Photoinactivation of Escherichia coli by 405 nm and 450 nm light-emitting diodes: Comparison of continuous wave and pulsed light. J. Photochem. Photobiol. B.248, 112799. 10.1016/j.jphotobiol.2023.112799 (2023). - PubMed
    1. Pham, T. T. et al. Inactivating Escherichia coli using hexagonal array of narrow bandwidth of violet-blue light emitting diode. Case Studies in Chemical and Environmental Engineering (CSCEE).8, 100389. 10.1016/j.cscee.2023.100389 (2023).

MeSH terms

LinkOut - more resources