. 2025 Jul 1;8(1):969.
doi: 10.1038/s42003-025-08371-7.

Site- and cell-type-specific miRNA and mRNA genes and networks across the cortex, striatum, and hypothalamus

Affiliations

Site- and cell-type-specific miRNA and mRNA genes and networks across the cortex, striatum, and hypothalamus

Amanda M Zacharias et al. Commun Biol. .

Abstract

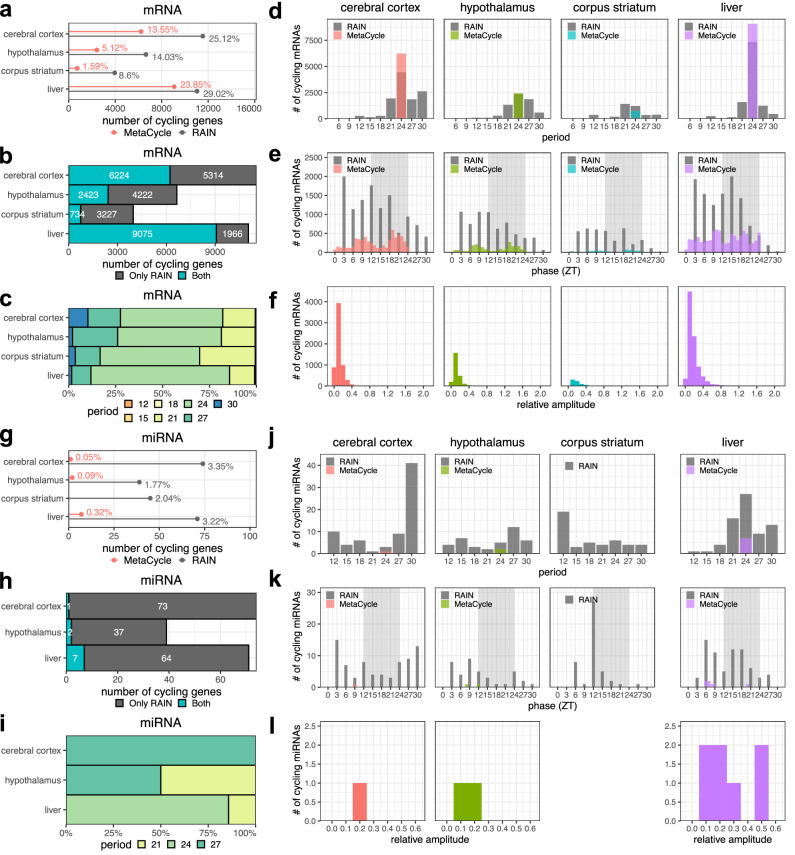
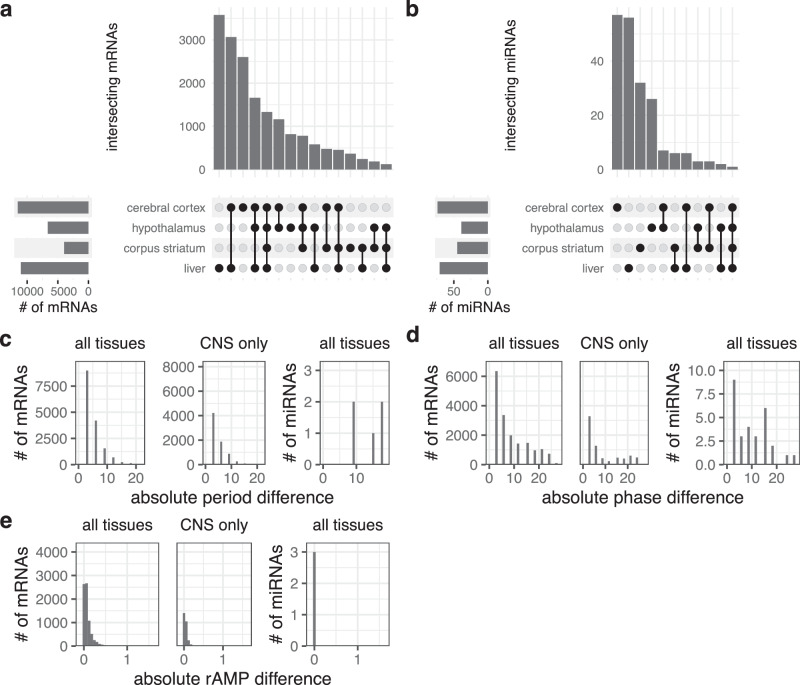
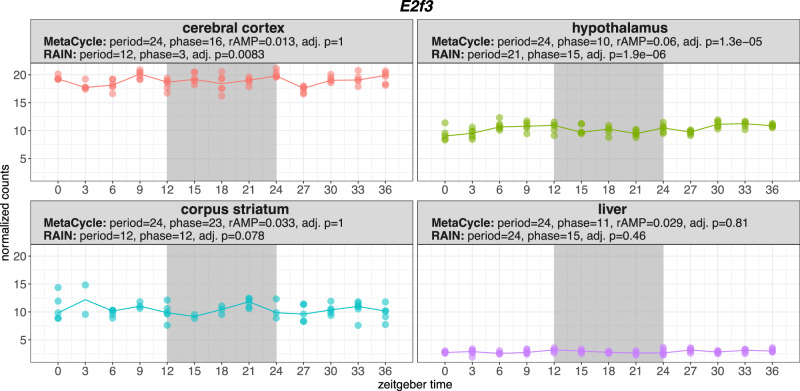
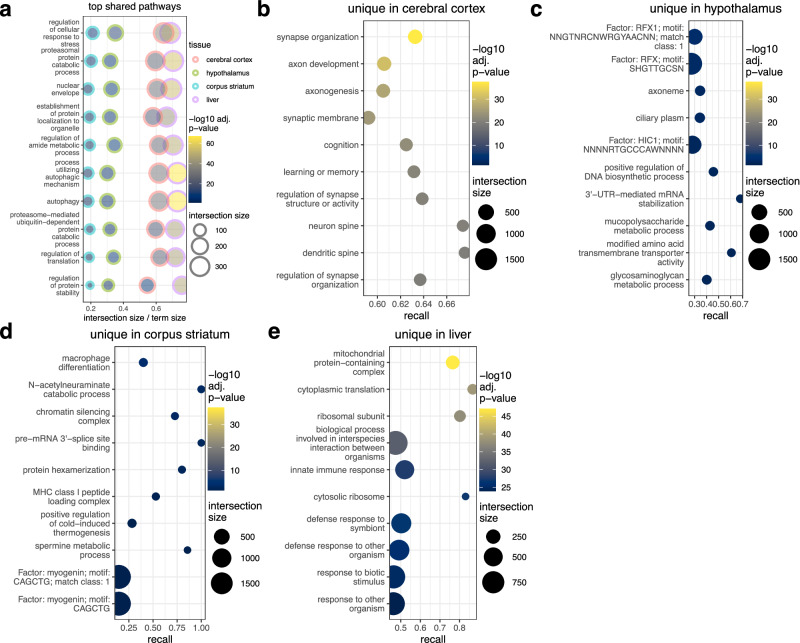
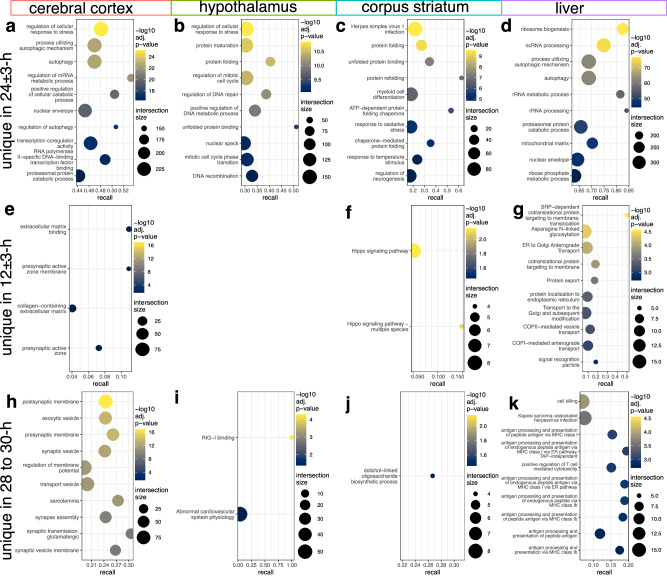
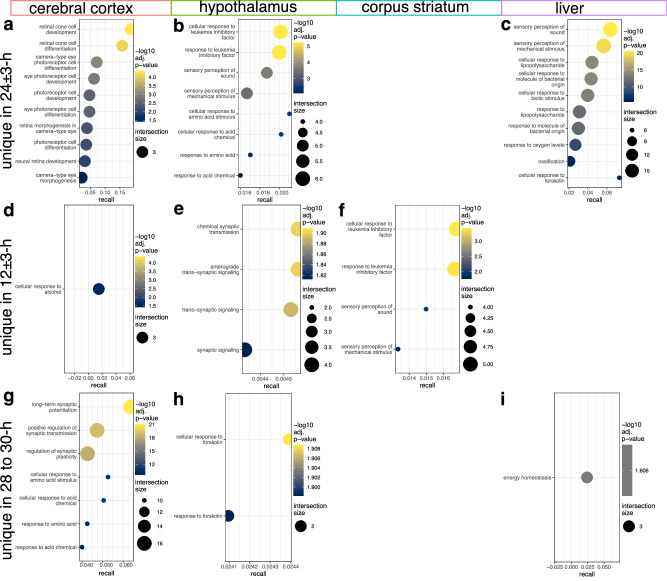
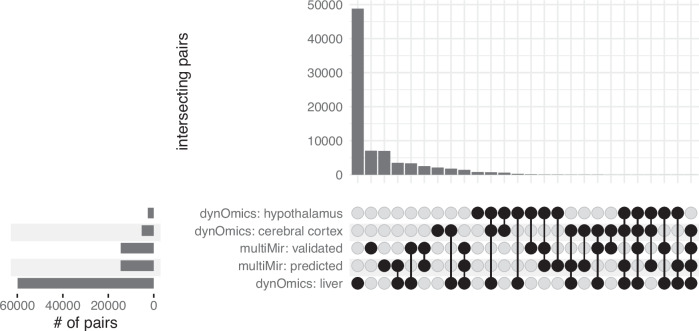
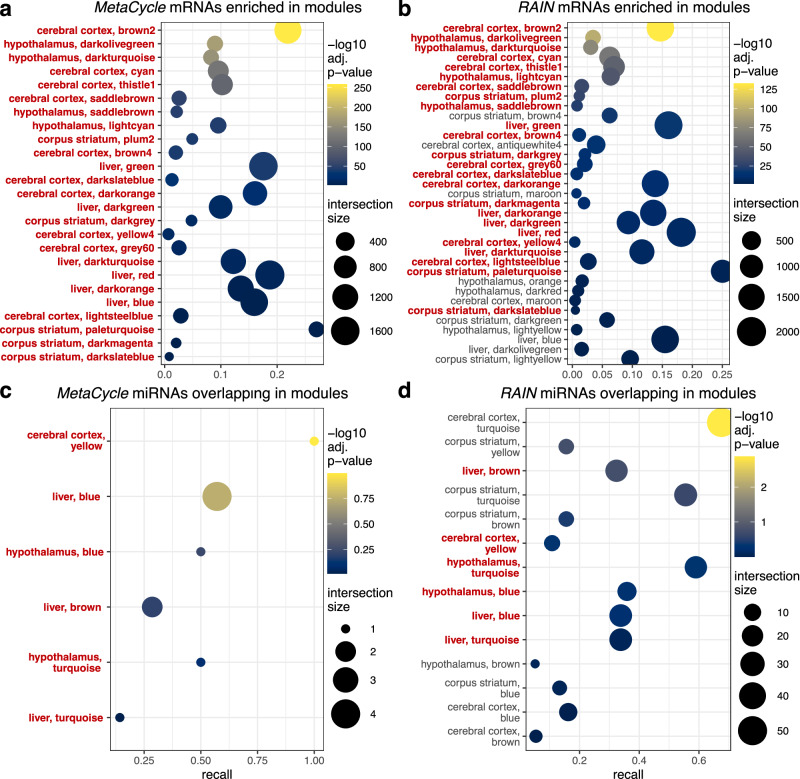
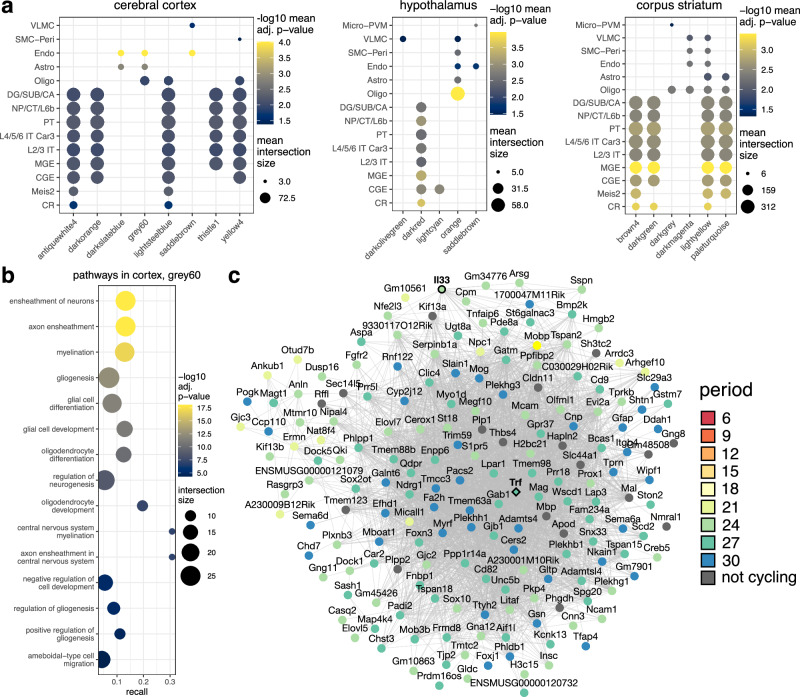
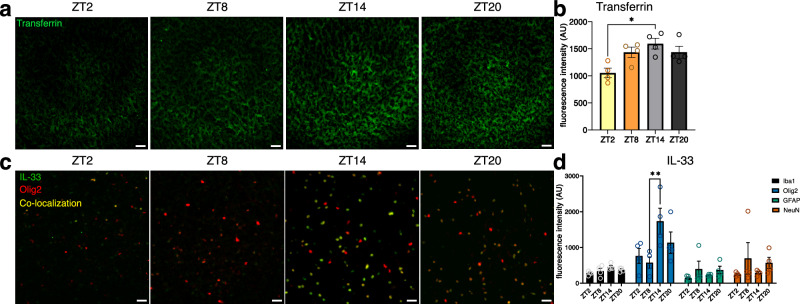
Biological rhythms control gene expression, but effects on central nervous system (CNS) cells and structures remain poorly defined. While circadian (24-hour) rhythms are most studied, many genes have periods of greater and less than 24-hours; these fluctuations can be both site- and cell-specific. Identifying patterns of gene rhythmicity across the CNS is necessary for both the study of chronobiology and to make sense of data obtained in the laboratory. We now identify cycling mRNAs, miRNAs, gene networks and mRNA-miRNA co-expression pairs in the cortex, hypothalamus, and corpus striatum of male C57BL/6J mice using high-dimensional datasets. A searchable catalogue ( https://www.ghasemloulab.ca/chronoCNS ) helps refine the analysis of cellular and molecular rhythmicity across the CNS (using the liver as a control). Immunofluorescence confirms the rhythmicity of key targets across cells in these structures, with strong cycling signatures in resting oligodendrocytes. Our study sheds light on the contribution of diurnal, ultradian, and infradian rhythms and mRNA-miRNA interactions to CNS function.


Conflict of interest statement

Competing interests: D.G.T. is currently an employee of Olink Proteomics AB, however, the published work was done prior to this employment and does not involve/promote any of Olink’s materials or point of view. H.C. is currently an employee of Geneseeq Technology Inc., however, the published work was done prior to this employment and does not involve/promote any of Geneseeq’s materials or points of view. H.G. is currently an employee at Caruta Therapeutics, however, the published work was done prior to this employment and does not involve/promote any of Caruta’s materials or points of view. All other authors declare no competing interests.

Figures

Fig. 1
Fig. 1. Variability in the number, period, phase, and relative amplitude of cycling mRNAs and miRNAs across CNS tissues.
af mRNAs, gl miRNAs. a, g The number (x-axis; PBH < 0.05) and percentage (listed in plots) of cycling genes in each CNS tissue, with results using both MetaCycle (red) and RAIN (grey). b, h Overlap of the numbers of genes detected by only RAIN (grey) or both MetaCycle and RAIN (turquoise). c, i The distribution of period lengths (hours) predicted by RAIN amongst cycling genes also detected by MetaCycle. Cycling parameters estimated in the cerebral cortex (red), hypothalamus (green), corpus striatum (turquoise), and liver (purple) using MetaCycle and RAIN (grey). d, j Distribution of period lengths between 6 and 30-h. e, k Distribution of phases between Zeitgeber Time 0 and 30, with entrained darkness highlighted with a grey background. f, l The distribution of relative amplitudes from 0.015 to 2.03.
Fig. 2
Fig. 2. Comparison of cycling genes across tissues.
a Intersections of cycling mRNAs from RAIN across cycles. b Intersections of cycling miRNAs from RAIN across cycles. Distributions of cycling parameter differences between tissues. c, d Period and phase estimated by RAIN. e Relative amplitude estimated by MetaCycle.
Fig. 3
Fig. 3. Expression and cycling parameters of the transcription factor gene E2f3.
Sampling timepoints represented in Zeitgeber time are on the x-axis. Normalized gene expression counts are on the y-axis. Data points represent the normalized counts of E2f3 at each timepoint and tissue. Panel titles indicate the tissue, MetaCycle results, and RAIN results.
Fig. 4
Fig. 4. Comparison of pathways enriched in cycling genes across tissues.
a Top pathways that are enriched in all 4 tissues (Pg:SCS < 0.05; 10 ≤ term size ≤ 500). Intersection size is the number of genes that are both cycling and in a pathway. Recall is the intersection size divided by the size of a term/pathway. be Top pathways uniquely enriched in their respective tissues (Pg:SCS < 0.05; 10 ≤ term size ≤ 500).
Fig. 5
Fig. 5. Comparison of pathways enriched in cycling mRNAs across period length categories (24-h, 12-h, and 28- to 30-h).
Top pathways that are uniquely enriched in the three period categories for each tissue (Pg:SCS < 0.05; 10 ≤ term size ≤ 500). Intersection size is the number of genes that are both cycling and in a pathway. Recall is the intersection size divided by the size of a term/pathway. a, e, h Comparison of pathways within the cerebral cortex. b, i Comparison of pathways within the hypothalamus. No pathways were unique to the period category 12 ± 3-h. For i, results are not filtered by term size. c, f, j Comparison of pathways within the corpus striatum. d, g, k Comparison of pathways within the liver.
Fig. 6
Fig. 6. Comparison of pathways enriched in cycling miRNAs across period length categories (24-h, 12-h, and 28- to 30-h).
Top pathways that are uniquely enriched in the 3 period categories for each tissue (Pg:SCS < 0.05; 10 ≤ term size ≤ 500). Intersection size is the number of genes that are both cycling and in a pathway. Recall is the intersection size divided by the size of a term/pathway. a, d, g Comparison of pathways within the cerebral cortex. b, e, h Comparison of pathways within the hypothalamus. For e, results are not filtered by term size. f Comparison of pathways within the corpus striatum. No pathways were unique to the period category 24 ± 3-h nor 28- to 30-h. c, i Comparison of pathways within the liver. No pathways were unique to the period category 12 ± 3-h.
Fig. 7
Fig. 7. mRNA–miRNA association analysis.
Intersections between mRNA–miRNA pairs associated (PBH < 0.05) across tissues and previously reported pairs from multiMir.
Fig. 8
Fig. 8. Network analysis and enrichment of cycling genes.
Overlap between gene modules and cycling genes. Intersection size is the number of genes that are both cycling and in a module. Recall is the intersection size divided by the total number of cycling genes considered. Datapoints are colored by the –log10(PPH) of cycling gene enrichment in a module. a, b mRNA modules enriched with cycling genes (PBH < 0.05). c, d miRNA modules that contain at least one cycling gene. a, c Analysis of MetaCycle cycling genes in modules. b, d Analysis of RAIN cycling genes in modules. Modules that occur in both MetaCycle and RAIN results are emphasized by bold red text.
Fig. 9
Fig. 9. Enrichment of cell-type marker genes in cycling mRNA modules.
a Cell type clusters (n = 387) are collapsed into previously defined neighborhoods (MGE, DR/SUB/CA, CGE, L2/3 IT, L4/5/6 IT Car 3, NP/CT/L6b, PT, and Other). The “Other” neighborhood clusters were collapsed into their respective subclasses (Meis2, Oligo, CR, Astro, SMC-Peri, Micro-PVM, Endo, and VLMC). RAIN cycling mRNA modules enriched in cell-type marker genes and their respective cell-type subclasses are shown (PBH < 0.05). The size of datapoints represents the mean number of genes that are both a cell subclass marker gene and in a module, i.e., mean intersection size. Datapoints are colored by the mean −log10(PPH) of a cell type subclass’s marker genes enrichment in a cycling module. b Pathways enriched in the cortical grey60 module (Pg:SCS < 0.05; 10 ≤ term size ≤ 500). c mRNAs with an adjacency ≥0.03 are visualized (n = 180 of 290). mRNAs (circle nodes) are arranged based on co-expression adjacency (grey edges). Nodes of cycling genes are colored by period category. If a gene is not cycling, its node is colored grey. The hub gene has a diamond node. Genes that underwent immunohistochemistry analysis, Trf and Il33, have their nodes outlined in black and labels bolded.
Fig. 10
Fig. 10. Rhythmic expression of extracellular transferrin and oligodendrocyte-specific IL-33 in the naïve CNS.
a Representative images of transferrin staining in the cortex of brains collected at ZT2, ZT8, ZT14, and ZT20. Scale bar, 25 µm. b Quantification of fluorescence intensity of the transferrin signal in the cortex. One-way ANOVA with Tukey’s post hoc test, n = 4 animals for each timepoint. Transferrin ZT2 versus ZT14, *P = 0.0106, q = 5.457, d.f. = 12. c Representative images of cortical oligodendrocytes (labeled with Olig2), IL-33, and their co-localization at ZT2, ZT8, ZT14, and ZT20. Scale bar, 25 µm. d Quantification of fluorescence intensity of IL-33 signal co-localized in the cortex with Iba1 (microglia), Olig2 (oligodendrocyte marker), GFAP (astrocytes), and NeuN (neurons). Two-way ANOVA, with Tukey’s post hoc test, n = 4 animals for each timepoint. IL-33 with Olig2, ZT8 versus ZT14, **P = 0.0070, q = 6.093, d.f. = 48. All data presented as mean ± s.e.m.

Similar articles

References

    1. Fagiani, F. et al. Molecular regulations of circadian rhythm and implications for physiology and diseases. Signal Transduct. Target. Ther.7, 41 (2022). - PMC - PubMed
    1. Jones, J. R., Chaturvedi, S., Granados-Fuentes, D. & Herzog, E. D. Circadian neurons in the paraventricular nucleus entrain and sustain daily rhythms in glucocorticoids. Nat. Commun.12, 5763 (2021). - PMC - PubMed
    1. Smarr, B. L., Jennings, K. J., Driscoll, J. R. & Kriegsfeld, L. J. A time to remember: the role of circadian clocks in learning and memory. Behav. Neurosci.128, 283–303 (2014). - PMC - PubMed
    1. de Zavalia, N. et al. Bmal1 in the striatum influences alcohol intake in a sexually dimorphic manner. Commun. Biol.4, 1227 (2021). - PMC - PubMed
    1. Yao, Z. et al. A high-resolution transcriptomic and spatial atlas of cell types in the whole mouse brain. Nature624, 317–332 (2023). - PMC - PubMed

LinkOut - more resources