. 2025 Aug;5(8):1619-1636.
doi: 10.1038/s43587-025-00897-z. Epub 2025 Jul 1.

DunedinPACNI estimates the longitudinal Pace of Aging from a single brain image to track health and disease

Affiliations

DunedinPACNI estimates the longitudinal Pace of Aging from a single brain image to track health and disease

Ethan T Whitman et al. Nat Aging. 2025 Aug.

Abstract

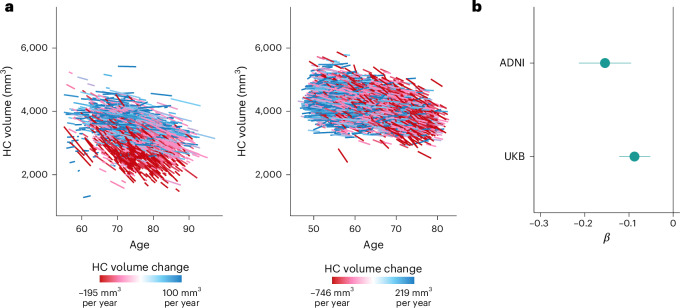
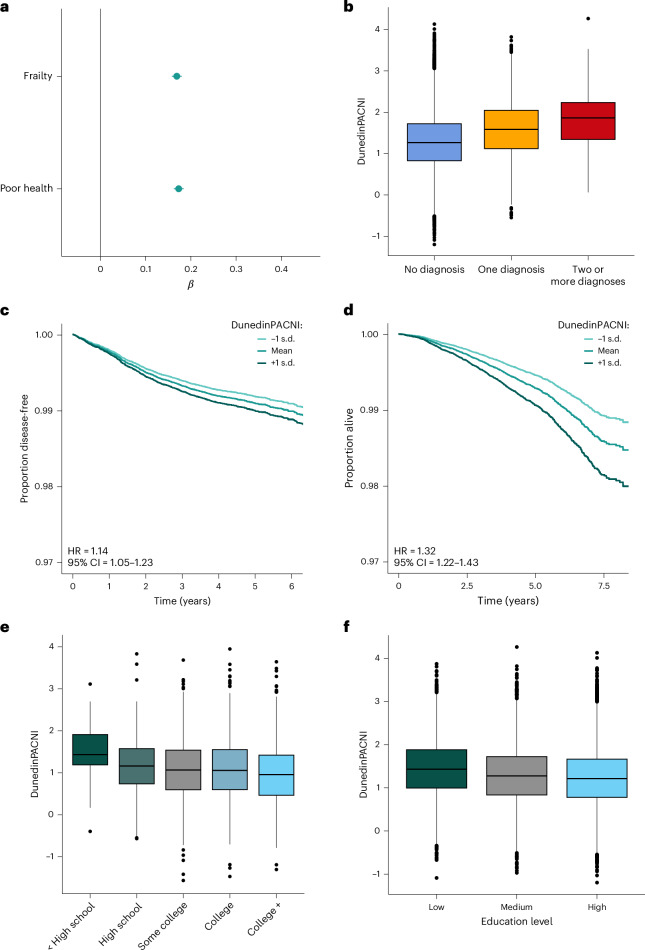
To understand how aging affects functional decline and increases disease risk, it is necessary to develop measures of how fast a person is aging. Using data from the Dunedin Study, we introduce an accurate and reliable measure for the rate of longitudinal aging derived from cross-sectional brain magnetic resonance imaging, that is, the Dunedin Pace of Aging Calculated from NeuroImaging (DunedinPACNI). Exporting this measure to the Alzheimer's Disease Neuroimaging Initiative, UK Biobank and BrainLat datasets revealed that faster DunedinPACNI predicted cognitive impairment, accelerated brain atrophy and conversion to diagnosed dementia. Faster DunedinPACNI also predicted physical frailty, poor health, future chronic diseases and mortality in older adults. When compared to brain age gap, DunedinPACNI was similarly or more strongly related to clinical outcomes. DunedinPACNI is a next-generation brain magnetic resonance imaging biomarker that can help researchers explore aging effects on health outcomes and evaluate the effectiveness of antiaging strategies.


Conflict of interest statement

Competing interests: K.S., A.C. and T.E.M. are listed as inventors of DunedinPACE, a Duke University and University of Otago invention licensed to TruDiagnostic for commercial uses; however, the DunedinPACE algorithm is open access for research purposes. The other authors declare no competing interests.

Figures

Fig. 1
Fig. 1. Schematic overview of the study methods.
a, Plot of mean scores for all 19 biomarkers comprising the Pace of Aging across four waves of observation at ages 26, 32, 38 and 45 years in the Dunedin Study. Hypothetical individual trajectories are shown for people with relatively slow, average and fast Pace of Aging from ages 26 to 45 years. b, Distribution of Pace of Aging scores in Dunedin Study members at age 45. Warmer colors represent a faster Pace of Aging; cooler colors represent a slower Pace of Aging. c, A single T1-weighted MRI scan collected from 860 Dunedin Study members at age 45 years was used to train an elastic net regression model to predict the Pace of Aging. We call the resulting measure DunedinPACNI. d, Regression weights from the DunedinPACNI model developed in the Dunedin Study were applied to T1-weighted MRI scans collected in the ADNI and UKB datasets to derive DunedinPACNI scores. Those scores were then related to aging-related phenotypes. AL, attachment loss; Apo, apolipoprotein; BMI, body mass index; FEV1, forced expiratory volume in 1 s; eGFR, estimated glomerular filtration rate; HbA1c, glycated hemoglobin; HDL, high-density lipoprotein; hsCRP, high sensitivity C-reactive protein; VO2max, maximal oxygen uptake. Source data
Fig. 2
Fig. 2. DunedinPACNI model validation and feature importance.
a, In-sample correlation between Pace of Aging and DunedinPACNI. Warmer colors represent a faster Pace of Aging and cooler colors represent a slower Pace of Aging. The regression error band represents the 95% CI. b, Comparison of absolute effect sizes for associations between DunedinPACNI and Pace of Aging with physical functioning, cognition and subjective aging measures in 860 members of the Dunedin Study. Effects are presented as standardized β coefficients with the error bars as the 95% CIs. c, Covariance between MRI-derived brain features and Pace of Aging. Of the 315 brain features used in model training, 216 were set equal to zero because of the high correlation between brain measures and to reduce overfitting. The 99 features included in the final model are visualized in Supplementary Fig. 1. Warmer colors represent features that positively covaried with DunedinPACNI scores (that is, a larger value indicates faster aging), while cooler colors represent features that negatively covaried with DunedinPACNI scores (that is, a larger value indicates slower aging). Features that did not contribute to the estimation of DunedinPACNI predictions are shown in gray. CC, corpus callosum; DC, diencephalon; IQ, intelligence quotient; L, left; R, right. Source data
Fig. 3
Fig. 3. DunedinPACNI predicts cognition, cognitive impairment and conversion to dementia.
a,b, Cross-sectional associations between DunedinPACNI and cognitive test scores in ADNI (a) and UKB (b). a,b, Effects are presented as standardized β coefficients with the error bars as the 95% CIs. We visualized the absolute effect sizes to aid visual comparison and clarity (see Supplementary Tables 2 and 3 for the raw effect sizes). The exact sample sizes for each test in a and b are reported in Supplementary Tables 2 and 3. c, Group differences in DunedinPACNI scores in 1,737 ADNI participants according to cognitive status at scanning. The center lines represent the median. The lower and upper hinges represent the 25th and 75th percentiles. The whiskers extend 1.5 times the interquartile range (IQR) from the hinges. Data beyond the whiskers are plotted as individual outliers. d, Survival curve of the relative proportion of CN ADNI participants at baseline who remained CN during the follow-up window, grouped according to slow, average and fast baseline DunedinPACNI scores. Note that although the maximum follow-up length is 16 years, we chose to visualize only 9 years of follow-up because of high amounts of censoring after 9 years. A plot with the full 16 years of follow-up and points marking censoring is presented in Extended Data Fig. 4. ADAS-Cog, Alzheimer’s Disease Assessment Scale-Cognitive Subscale 13; DSST, Digit Symbol Substitution Task; FAQ, Functional Activities Questionnaire; LogMemory, Logical Memory test; Matrix, Matrix Pattern Completion; MMSE, Mini-Mental State Examination; RAVLT, Rey Auditory Visual Learning Test; Tower, Tower Rearranging; TrailsA, Trail Making Test Part A; TrailsB, Trail Making Test Part B; VM, visual memory; WM, working memory. Source data
Fig. 4
Fig. 4. DunedinPACNI predicts accelerated hippocampal atrophy.
a, Individualized trajectories of hippocampal atrophy in ADNI (left) and UKB (right). Warmer colors represent accelerated atrophy. b, Forest plot of associations between baseline DunedinPACNI scores and accelerated hippocampal atrophy in 1,302 ADNI participants and 4,601 UKB participants. Effects are presented as standardized β coefficients with the error bars as the 95% CIs. HC, hippocampus. Source data
Fig. 5
Fig. 5. DunedinPACNI predicts frailty, poor health, multimorbidity, future chronic diseases and mortality, and reflects social gradients of health inequities.
a, Forest plot of absolute associations between DunedinPACNI and frailty (n = 42,583) and self-rated health (n = 42,235) in UKB. Effects are presented as standardized β coefficients with the error bars as the 95% CIs. b, Group differences in DunedinPACNI scores according to the lifetime number of aging-related chronic disease diagnoses, including myocardial infarction, chronic obstructive pulmonary disease, dementia and stroke in 42,583 UKB participants. c, Survival curve of the relative proportion of disease-free UKB participants at the time of MRI who remained disease-free during the follow-up window, grouped according to slow, average and fast baseline DunedinPACNI scores. We excluded participants who had chronic disease before scanning from this analysis. d, Survival curve of the relative proportion of UKB participants who remained alive during the follow-up window grouped according to baseline DunedinPACNI scores. e, Group differences in DunedinPACNI according to education level in 1,734 ADNI participants. f, Group differences in DunedinPACNI according to education level in 38,297 UKB participants. b,e,f, The center lines represent the median. The lower and upper hinges represent the 25th and 75th percentiles. The whiskers extend 1.5 times the IQR from the hinges. Data beyond the whiskers are plotted as individual outliers. Source data
Fig. 6
Fig. 6. DunedinPACNI is similarly associated with dementia and cognitive impairment in a sample of BrainLat participants.
a, Group differences in DunedinPACNI scores according to cognitive diagnosis in 369 BrainLat participants. The center lines represent the median. The lower and upper hinges represent the 25th and 75th percentiles. The whiskers extend 1.5 times the IQR from the hinges. Data beyond the whiskers are plotted as individual outliers. b, Forest plot of standardized mean differences in DunedinPACNI between participants with dementia and CN controls in BrainLat (orange; n = 369) and ADNI (dark green; n = 1,201) while controlling for age and sex. DunedinPACNI was similarly accelerated in dementia in a sample of Latin Americans (BrainLat) and North Americans (ADNI). Effects are presented as standardized β coefficients with the error bars as the 95% CIs. c, Scatter plot of associations between MoCA scores and DunedinPACNI in BrainLat (orange; n = 191) and ADNI (dark green, n = 1,206) participants. The regression error bands represent the 95% CIs. DunedinPACNI scores were residualized for age and sex. The linear associations between MoCA scores and DunedinPACNI scores were similar in a sample of Latin Americans (BrainLat) and North Americans (ADNI). Source data
Fig. 7
Fig. 7. Comparison of DunedinPACNI and brain age gap associations with aging-related phenotypes.
a, Forest plots of DunedinPACNI and brain age gap absolute effect sizes in ADNI (left) and UKB (right). Effects are presented as standardized β coefficients with the error bars as the 95% CIs. Note that for visualization, the signs of some outcomes were flipped, such that higher scores for all outcomes reflected worse performance or health. Raw effect sizes are presented in Supplementary Tables 2, 3, 7 and 9. b, Forest plots of DunedinPACNI and brain age gap HRs in ADNI and UKB. Effects are presented as HRs with the error bars as the 95% CIs. a,b, Exact sample sizes for each test are reported in Supplementary Tables 2, 3 and 7–9). Lighter shades represent the effect size for each measure while controlling for the other measure (that is, the effect of DunedinPACNI when controlling for brain age gap and vice versa). ADAS-Cog, Alzheimer’s Disease Assessment Scale-Cognitive Subscale 13; DSST, Digit Symbol Substitution Task; FAQ, Functional Activities Questionnaire; LogMemory, Logical Memory test; Matrix, Matrix Pattern Completion; MMSE, Mini-Mental State Examination; RAVLT, Rey Auditory Visual Learning Test; Tower, Tower Rearranging; TrailsA, Trail Making Test Part A; TrailsB, Trail Making Test Part B; VM, visual memory; WM, working memory. Source data
Extended Data Fig. 1
Extended Data Fig. 1. Dunedin Study attrition analysis using IQ.
No significant differences in childhood IQ were found between the full cohort, those still alive, those seen at Phase 45, or those scanned at Phase 45. Those who were deceased by the Phase 45 data collection had significantly lower childhood IQ’s than those who were still alive (t = 2.09, p = 0.04). Center lines of boxes represent the median. Lower and upper hinges of boxes represent the 25th and 75th percentiles. Whiskers show the range. The red line connects the means of each distribution. We report childhood IQ because it is known to be a strong predictor of late-life health outcomes, as shown by many cohort studies from many nations. Childhood IQ predicts health and social outcomes in adulthood, and these outcomes include physical functions, cognitive decline, mental health, inflammation, metabolic syndrome, disease incidence, dementia, mortality, and also neuroimaging-based, genomic, and epigenetic indicators of health. Based on the literature, we report three groups: study members who died before age 45, and thus could not have taken part in data collection, study members who were alive and thus could take part, and study members who actually did take part. We compared these three groups to the original birth cohort. The figure shows that the small group of study members who had died before age 45 had significantly lower mean childhood IQ as a group. Some of the early deaths were Dunedin Study members who had more disadvantages in their lives leading to poorer health and increased risk of early mortality. Study members who died of childhood diseases may have been already unwell at the time of IQ testing, which could have lowered their scores. However, cohort members who are still alive and cohort members who took part in data collection did not differ from the full original cohort on their mean childhood IQ; they still represent population variation on this key health risk factor. Abbreviations: IQ = intelligence quotient. Source data
Extended Data Fig. 2
Extended Data Fig. 2. Dunedin Study attrition analysis using SES.
No significant differences were found between the full cohort, those deceased, those alive, those seen at Phase 45, or those scanned at Phase 45 on childhood SES. Center lines of boxes represent the median. Lower and upper hinges of boxes represent the 25th and 75th percentiles. Whiskers show the range. The red line connects the means of each distribution. We report childhood SES because it is known to be a strong predictor of late-life health outcomes, as shown by many cohort studies from many nations. Childhood SES separately predicts health and social outcomes in adulthood, and these outcomes include physical functions, cognitive decline, mental health, inflammation, metabolic syndrome, disease incidence, dementia, mortality, and also neuroimaging-based, genomic, and epigenetic indicators of health. Based on the literature, we report three groups: study members who died before age 45, and thus could not have taken part in data collection, study members who were alive and thus could take part, and study members who actually did take part. We compared these three groups to the original birth cohort. The figure shows that the small group of study members who had died before age 45 had somewhat lower mean childhood SES as a group. Some of the early deaths were Dunedin Study members who had more disadvantages in their lives leading to poorer health and increased risk of early mortality. However, cohort members who are still alive and cohort members who took part in data collection did not differ from the full original cohort on their mean childhood SES; they still represent population variation on this key health risk factor. Abbreviations: SES = socioeconomic status. Source data
Extended Data Fig. 3
Extended Data Fig. 3. Associations with DunedinPACNI while excluding participants who go on to have cognitive decline or have high genetic risk for Alzheimer’s Disease in the UK Biobank.
a. Forest plot of associations between cognitive, frailty, health, and social class measures and DunedinPACNI with and without inclusion of participants who later develop dementia or who carry two APOE E4 risk alleles. Effects are presented as standardized beta coefficients with error bars as 95% confidence intervals. Note that for visualization, the signs of some outcomes were flipped, such that higher scores for all outcomes reflected worse performance or health. b. Forest plot of DunedinPACNI hazard ratios for chronic disease and mortality with and without inclusion of participants who develop dementia or carry two APOE E4 risk alleles. Effects are presented as hazard ratios with error bars as 95% confidence intervals. Exact sample sizes for all tests are presented in Supplementary Table 4. Abbreviations: DSST = Digit Symbol Substitution Task, HR = hazard ratio, IQ = intelligence quotient, Matrix = Matrix Pattern Completion, RT = Reaction Time, Tower = Tower Rearranging, TrailsA = Trail Making Test Part A, TrailsB = Trail Making Test Part B, VM = Visual Memory, WM = Working Memory. Source data
Extended Data Fig. 4
Extended Data Fig. 4. DunedinPACNI prediction of cognitive decline in ADNI with full follow-up window.
Survival curve of the relative proportion of 624 cognitively normal ADNI participants at baseline who remained cognitively normal during the follow-up window grouped by slow, average, and fast baseline DunedinPACNI scores. Censored timepoints (that is, points when participants either converted to MCI/dementia or were lost to follow-up) are shown with cross marks. Note that relatively few participants have >9 years of follow-up. Abbreviations: ADNI = Alzheimer’s Disease Neuroimaging Initiative, SD = standard deviation.
Extended Data Fig. 5
Extended Data Fig. 5. Comparison of DunedinPACNI and brain age gap associations with clinical outcomes in BrainLat.
a. Forest plots of DunedinPACNI and brain age gap standardized mean differences between dementia groups and healthy controls in BrainLat. Error bars represent 95% confidence intervals. Lighter shades represent the effect size for each measure while controlling for the other measure (that is, effect of DunedinPACNI when controlling for brain age gap, and vice versa). b. Forest plots of DunedinPACNI and brain age gap absolute standardized association effect sizes with the MoCA. Error bars represent 95% confidence intervals. Lighter shades represent the effect size for each measure while controlling for the other measure (that is, effect of DunedinPACNI when controlling for brain age gap, and vice versa). c. Forest plot of absolute standardized associations between DunedinPACNI alone, brain age gap alone, and their combined associations with MoCA scores in BrainLat. Error bars represent 95% confidence intervals. Exact sample sizes for all tests are presented in Supplementary Tables 10, 11). Abbreviations: AD = Alzheimer’s dementia, FTD = frontotemporal dementia, MoCA = Montreal Cognitive Assessment, SDs = standard deviations. Source data
Extended Data Fig. 6
Extended Data Fig. 6. Combined effects of DunedinPACNI and brain age gap were generally more sensitive to clinical outcomes.
a. Forest plots for effect sizes for DunedinPACNI alone, brain age gap alone, and their combined associations with clinical outcomes. Combined effects were considered to be the sum of beta coefficients when both DunedinPACNI and brain age gap were included in a model while controlling for age and sex. Error bars represent 95% confidence intervals. Note that for visualization, the signs of some outcomes were flipped, such that higher scores for all outcomes reflected worse performance or health. b. Forest plots of hazard ratios for risk of cognitive decline, dementia, chronic disease, and death. Combined effects were considered to be the products of respective hazard ratios for DunedinPACNI and brain age gap included in a model while controling for age and sex. Error bars represent 95% confidence intervals. Exact sample sizes for each test in a. and b. are reported in Supplementary Tables 2, 3, 7–9). Note that for cognitive tests in ADNI, only baseline observations were used in this analysis to facilitate combination of effects. Thus, sample sizes for these tests are reflected by the number of individuals, not observations, in the sample. This information is provided in Supplementary Table 2. Abbreviations: ADAS-Cog = Alzheimer’s Disease Assessment Scale – Cognitive Subscale 13, ADLs = activities of daily living, ADNI = Alzheimer’s Disease Neuroimaging Initiative, CI = confidence interval, CN = cognitively normal, Cog. = cognitive, DSST = Digit Symbol Substitution Task, FAQ = Functional Activities Questionnaire, Hipp. = hippocampal, HR = hazard ratio, IQ = intelligence quotient, LogMemory = Logical Memory, Matrix = Matrix Pattern Completion, MCI = mild cognitive impairment, MMSE = Mini-Mental State Exam, MoCA = Montreal Cognitive Assessment, RT = Reaction Time, RAVLT = Rey Auditory Visual Learning Test, SD = standard deviation, Tower = Tower Rearranging, TrailsA = Trail Making Test Part A, TrailsB = Trail Making Test Part B, VM = Visual Memory, WM = Working Memory. Source data
Extended Data Fig. 7
Extended Data Fig. 7. Cross-sectional cognitive associations with DunedinPACNI, hippocampal volume, and ventricular volume in the UK Biobank.
a. Forest plot of associations between cognitive measures and DunedinPACNI and hippocampal volume. Effects are presented as standardized beta coefficients with error bars as 95% confidence intervals. Note that we flipped the direction of hippocampal associations to match the direction of DunedinPACNI. b. Forest plot of associations between cognitive measures and DunedinPACNI and ventricular volume. Effects are presented as standardized beta coefficients with error bars as 95% confidence intervals. Lighter shades represent the effect size for each measure while controlling for the other measure (that is, effect of DunedinPACNI when controlling for hippocampal or ventricular volume, and vice versa). Note that for visualization, the signs of some outcomes were flipped, such that higher scores for all outcomes reflected worse performance or health. Exact effect sizes and sample sizes for each test are presented in Supplementary Table 12, 13). Abbreviations: DSST = Digit Symbol Substitution Task, Hipp. = hippocampus, IQ = intelligence quotient, Matrix = Matrix Pattern Completion, RT = Reaction Time, Tower = Tower Rearranging, TrailsA = Trail Making Test Part A, TrailsB = Trail Making Test Part B, Vent. = ventricle, vol. = volume, VM = Visual Memory, WM = Working Memory. Source data
Extended Data Fig. 8
Extended Data Fig. 8. Cross-sectional frailty and health associations with DunedinPACNI, hippocampal volume, and ventricular volume in the UK Biobank.
a. Forest plot of associations between frailty and health measures and DunedinPACNI and hippocampal volume. Effects are presented as standardized beta coefficients with error bars as 95% confidence intervals. Note that we flipped the direction of hippocampal associations to match the direction of DunedinPACNI. b. Forest plot of associations between frailty and health measures and DunedinPACNI and ventricle volume. Effects are presented as standardized beta coefficients with error bars as 95% confidence intervals. Lighter shades represent the effect size for each measure while controlling for the other measure (that is, effect of DunedinPACNI when controlling for hippocampal or ventricular volume, and vice versa). Exact sample sizes for each test are presented in Supplementary Table 12, 13). Abbreviations: Hipp. = hippocampus, Vent. = ventricle, vol. = volume. Source data
Extended Data Fig. 9
Extended Data Fig. 9. Cognitive decline, disease, and mortality prediction by DunedinPACNI, hippocampal volume, and ventricular volume.
a. Cognitive decline prediction among cognitively normal ADNI participants, b. Chronic disease prediction in UK Biobank. C. Mortality prediction in UK Biobank. Gray points indicate hazard ratios for each brain measure while covarying for sex and age at scan. The blue point indicates the DunedinPACNI hazard ratio while also covarying for hippocampal volume. The pink point indicates the DunedinPACNI hazard ratio while covarying for ventricular volume. The orange points indicate the hippocampal and ventricular volume hazard ratios while covarying for DunedinPACNI. Note that we flipped the direction of hippocampal associations to match the direction of DunedinPACNI. Error bars on all plots represent 95% confidence intervals. Exact sample sizes for each test are presented in Supplementary Table 14). Abbreviations: ADNI = Alzheimer’s Disease Neuroimaging Initiative, Hipp. = hippocampus, HR = hazard ratio, UKB = UK Biobank, Vent. = ventricle, vol. = volume. Source data

References

    1. Belsky, D. W. et al. Quantification of biological aging in young adults. Proc. Natl Acad. Sci. USA112, E4104–E4110 (2015). - PMC - PubMed
    1. Elliott, M. L. et al. Disparities in the pace of biological aging among midlife adults of the same chronological age have implications for future frailty risk and policy. Nat. Aging1, 295–308 (2021). - PMC - PubMed
    1. Kuo, P.-L. et al. Longitudinal phenotypic aging metrics in the Baltimore Longitudinal Study of Aging. Nat. Aging2, 635–643 (2022). - PMC - PubMed
    1. Moqri, M. et al. Biomarkers of aging for the identification and evaluation of longevity interventions. Cell186, 3758–3775 (2023). - PMC - PubMed
    1. Moqri, M. et al. Validation of biomarkers of aging. Nat. Med.30, 360–372 (2024). - PMC - PubMed