. 2025 Jul 1;15(1):22113.
doi: 10.1038/s41598-025-06640-3.

Alterations in static and dynamic functional network connectivity in subcortical vascular cognitive impairment

Affiliations

Alterations in static and dynamic functional network connectivity in subcortical vascular cognitive impairment

Haixia Mao et al. Sci Rep. .

Abstract

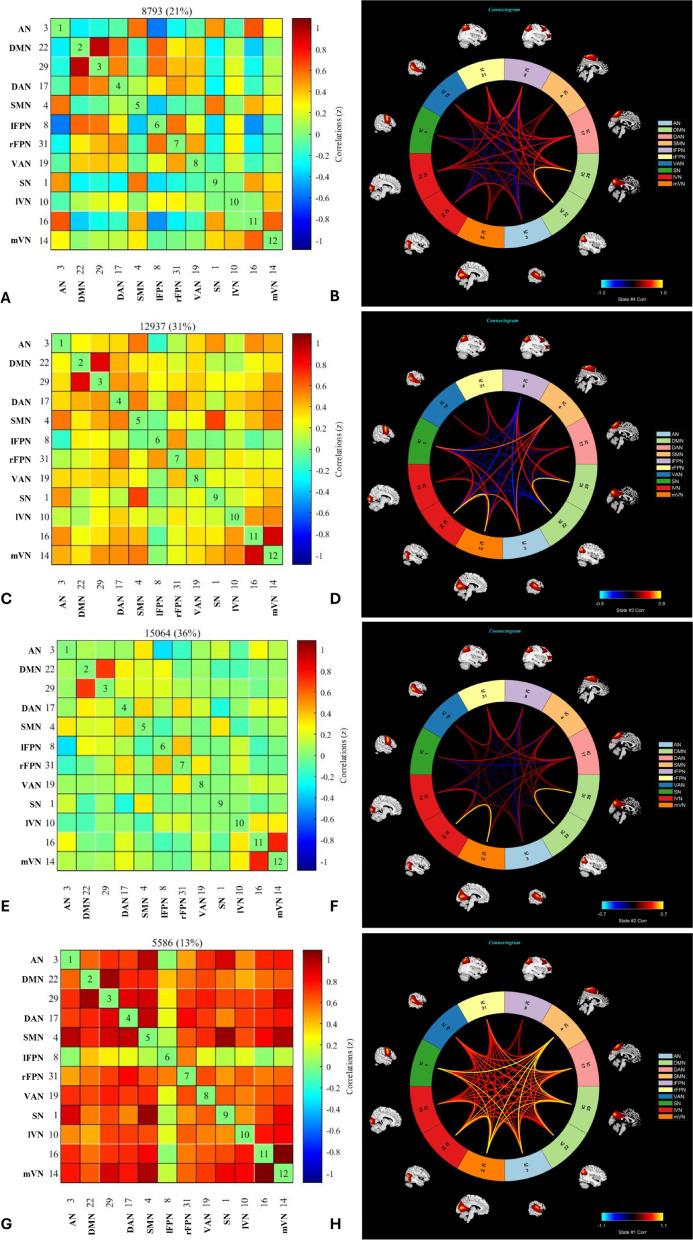
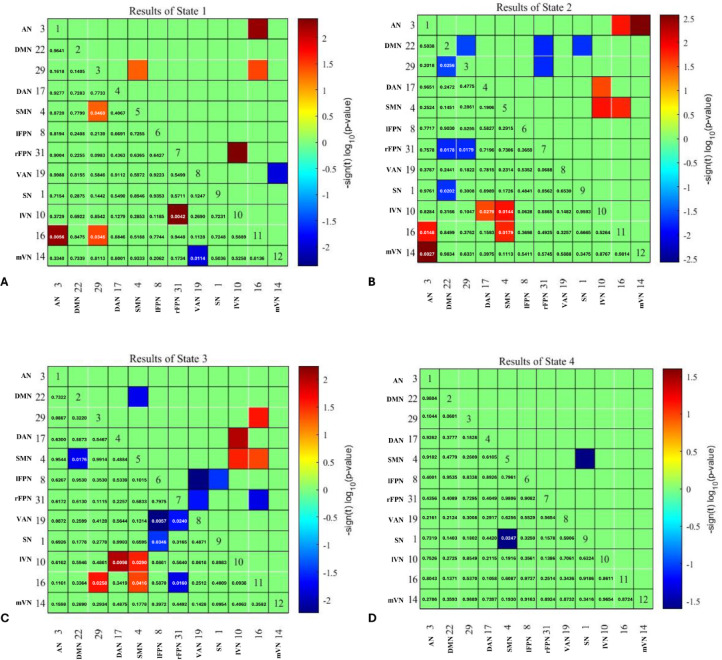
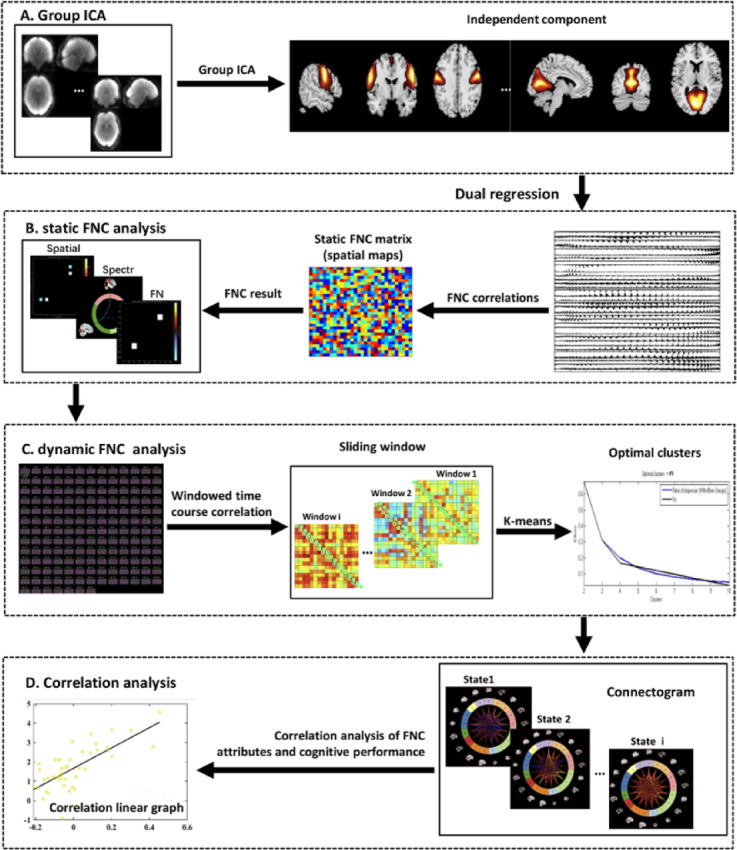
The current study integrated static (sFNC) and dynamic (dFNC) functional network connectivity to investigate the neurobiological mechanisms underlying alterations in static and dynamic functional network connectivity in subcortical vascular cognitive impairment (SVCI). We recruited 80 patients with SVCI (39 males, 41 females) and 83 healthy controls (32 males, 51 females). Clinical and imaging data, including clinical history, neuropsychological assessments, and Magnetic Resonance Imaging (MRI) scans, were collected. We extracted network independent components for sFNC and dFNC using independent component analysis with resting-state functional MRI data. Firstly, changes in sFNC in SVCI were comparatively analyzed. Subsequently, dynamic connectivity was examined using the sliding time window technique and cluster analysis to assess brain functional activity states and temporal properties. Differences in dFNC temporal properties (fractional occupancy, mean dwell time, and number of transitions) and functional connectivity across different time domains between groups were assessed with two sample t-tests. Spearman correlation analyses were performed to explore relationships between sFNC and dFNC changes and cognitive function. In the sFNC analysis, the SVCI group showed significantly decreased interactions between the sensorimotor network and lateral visual network, which was negatively associated with executive function (r = - 0.248, p = 0.027). In the dFNC analysis, brain functional activity was grouped into four highly structured functional connection states. The results revealed one connected state dominated by an increased connectivity pattern, two moderately connected states primarily characterized by increased connectivity with moderate decreases, and one weakly connected state exhibiting a modular connectivity pattern. These findings illustrate the progression in SVCI from connectivity disruption to compensation, eventually leading to a diminished compensatory response. Fractional occupancy and mean dwell time of states were correlated with cognitive function (all p < 0.05). SVCI patients exhibit impairments in both sFNC and dFNC, linked to cognitive decline. Connectivity dynamics reflect the brain's adaptive capacity in response to cognitive impairment.

Keywords: Dynamic; Functional network connectivity; MRI; Subcortical vascular cognitive impairment.


Conflict of interest statement

Declarations. Competing interests: The authors declare no competing interests.

Figures

Fig. 1
Fig. 1
Static functional network connectivity. The image is a connectogram graph which shows decreased interactions of SMN (IC 4) and lVN (IC 10) (SVCI: − 0.0108 ± 0.3522; HC: 0.1973 ± 0.3314; t = − 3.8856, FDR-adjusted p values = 0.0001) in the internetwork of sFNC in SVCI compared to HC group. The image was generated using GroupICATv4.0b (https://github.com/trendscenter/gift).
Fig. 2
Fig. 2
Matrices and connectograms of four highly structured functional connection states and corresponding cluster centers. States 1 (21%) and 2 (31%) were moderately connected, primarily characterized by increased connectivity with moderate decreases (AD). State 3, the most frequent (36%), showed predominantly weak connectivity, but with a modular pattern—marked by enhanced connectivity within the DMN and mVN (E and F). State 4, the least frequent (13%), exhibited strong connectivity patterns (G and H).
Fig. 3
Fig. 3
Differences in dFNC between SVCI and HCs of four highly structured functional connection states. (A) In State 1, the SVCI group showed reduced connectivity between the mVN and the VAN, while the overall pattern demonstrated a relatively greater increase in global connectivity. (B) In State 2, reduced connectivity was observed primarily among the DMN, FPN, and SN, while connectivity between the VN and other networks was enhanced. (C) In State 3, decreased connectivity was mainly observed between the FPN and other networks, accompanied by increased connectivity between the VN and several other networks. (D) In State 4, the SVCI group demonstrated reduced connectivity between the SN and SMN compared to the HC group.
Fig. 4
Fig. 4
Comparison of fractional occupancy, mean dwell time and number of transitions between the two groups for each state. (A) Fractional occupancy in dynamic states of SVCI group was longer than HCs group in state 3. (B) Mean dwell time of SVCI group was longer than HCs group in state 3. (C) Number of transitions in dynamic state had no group difference.
Fig. 5
Fig. 5
The correlation between functional connectivity and cognitive function in SVCI. (A) The correlations of decreased interactions with cognitive performance of SVCI group in sFNC. (B) The correlation of the fractional occupancy in four highly structured functional connection states, with cognitive performance of SVCI group. (C) The correlation of the mean dwell time in four highly structured functional connection states, with cognitive performance of SVCI group. * indicates p < 0.05, indicating statistical significance of the correlation.
Fig. 6
Fig. 6
The processing flowchart of functional MRI data analysis. (A) All patient data are concatenated in time and ICA analysis is done to identify Resting-State Networks (RSN) spatial maps. Patient-specific time courses of each RSN are estimated using dual regression (image generated using GroupICATv4.0b, GitHub: https://github.com/trendscenter/gift). (B) sFNC analysis done by calculating the correlation between each pair of RSNs using the entire time course. (C) dFNC was analyzed using sliding window approach and K-means clustering. (D) Correlation analysis of dFNC properties and clinical variables was done by linear regression.

Similar articles

References

    1. Hosoki, S. et al. Molecular biomarkers for vascular cognitive impairment and dementia. Nat. Rev. Neurol.19, 737–753 (2023). - PubMed
    1. Duering, M. et al. Neuroimaging standards for research into small vessel disease-advances since 2013. Lancet Neurol.22, 602–618 (2023). - PubMed
    1. Kim, J. et al. Distinct spatiotemporal patterns of cortical thinning in Alzheimer’s disease-type cognitive impairment and subcortical vascular cognitive impairment. Commun. Biol.7, 198 (2024). - PMC - PubMed
    1. Román, G. C., Erkinjuntti, T., Wallin, A., Pantoni, L. & Chui, H. C. Subcortical ischaemic vascular dementia. Lancet Neurol.1, 426–436 (2002). - PubMed
    1. Kang, S. H. et al. Independent effects of amyloid and vascular markers on long-term functional outcomes: An 8-year longitudinal study of subcortical vascular cognitive impairment. Eur. J. Neurol.29, 413–421 (2022). - PubMed

LinkOut - more resources