

Use of a sperm morphology assessment standardisation training tool improves the accuracy of novice sperm morphologists
- PMID: 40595188
- PMCID: PMC12215844
- DOI: 10.1038/s41598-025-07515-3
Use of a sperm morphology assessment standardisation training tool improves the accuracy of novice sperm morphologists
Abstract
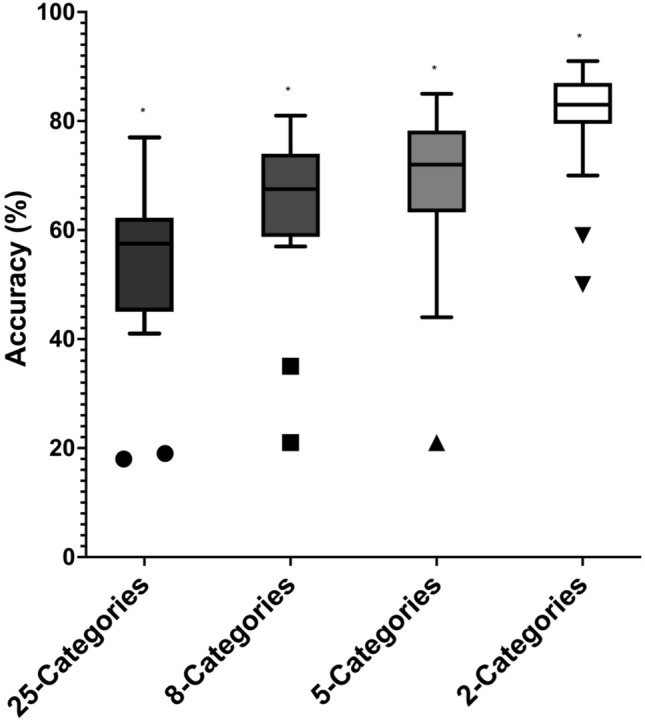
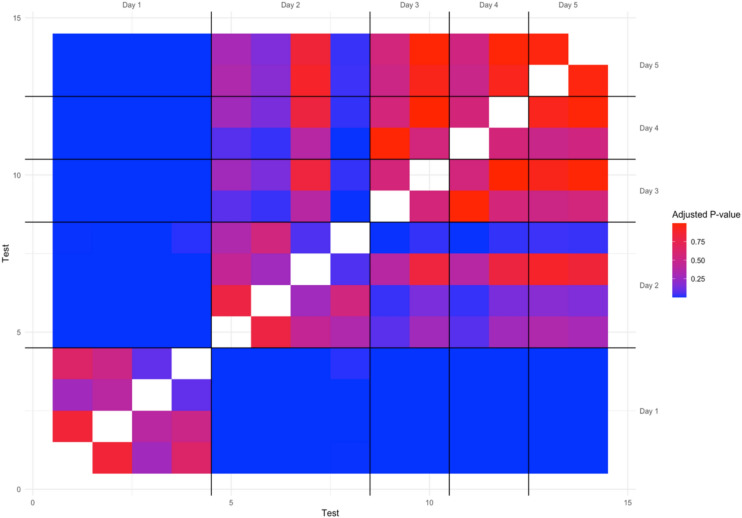
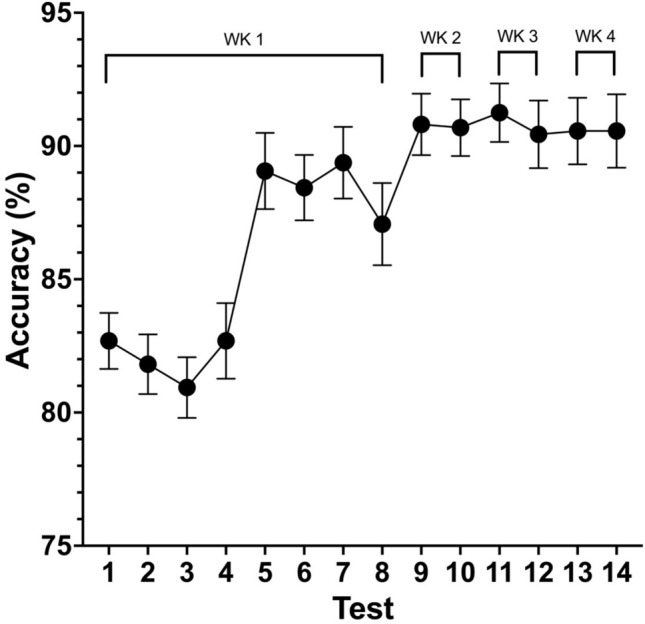
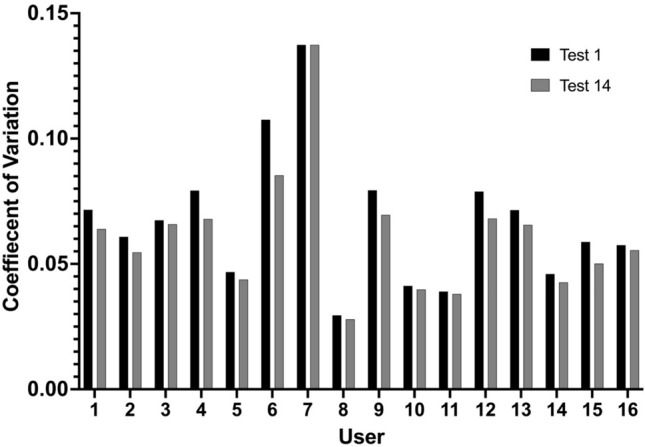
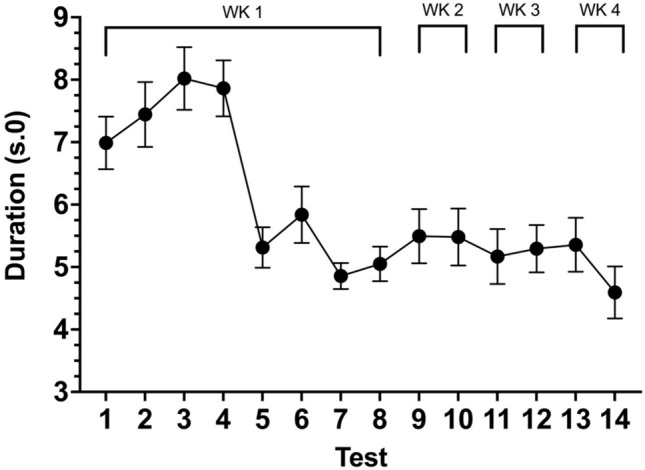
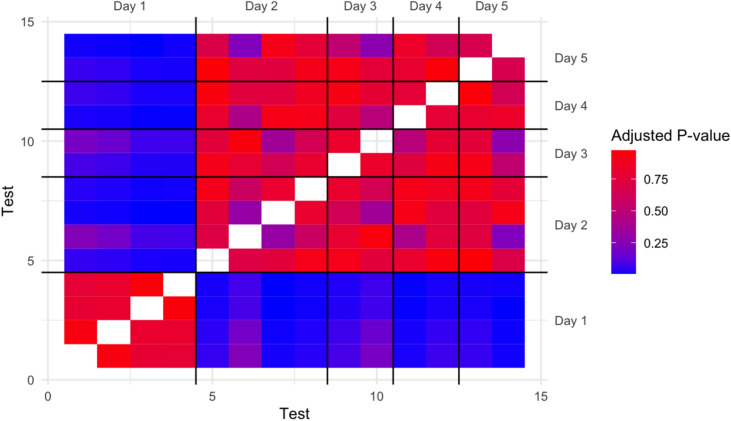
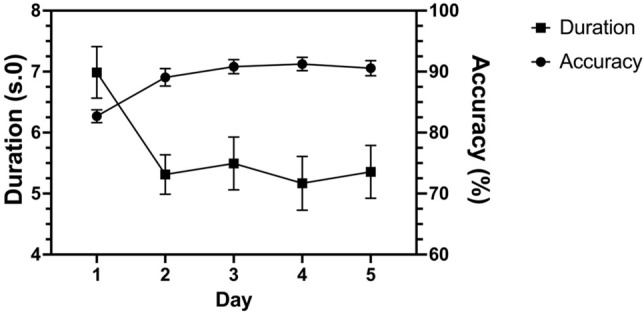
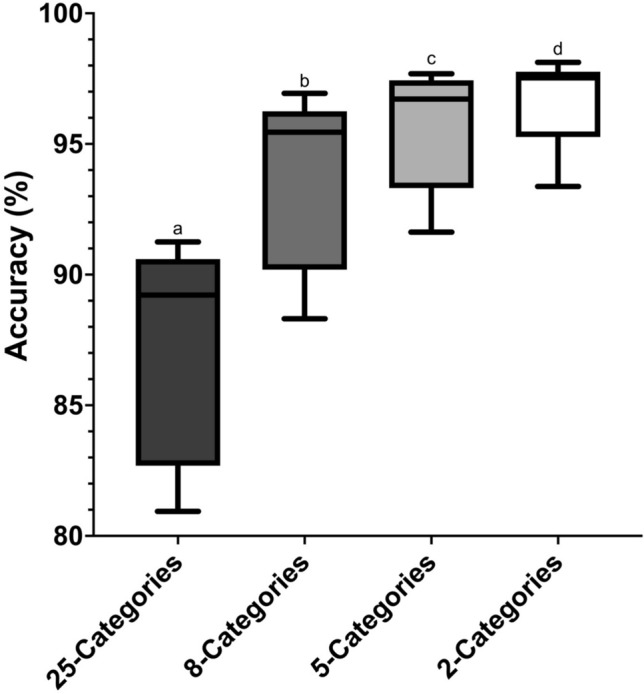
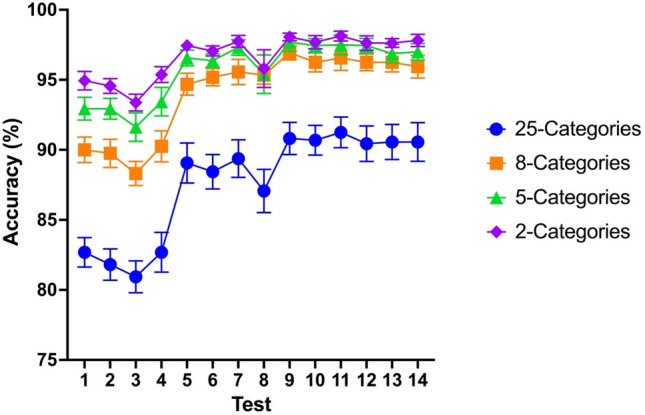
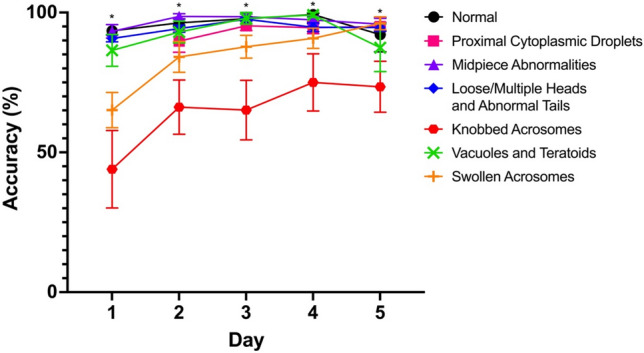
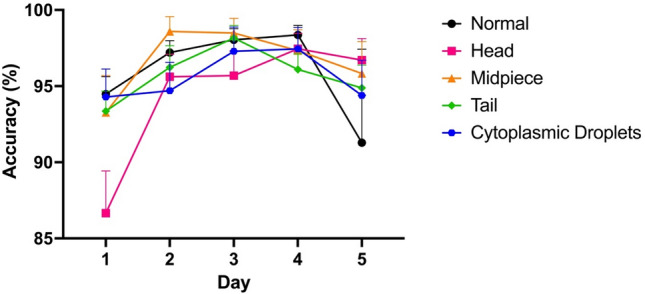
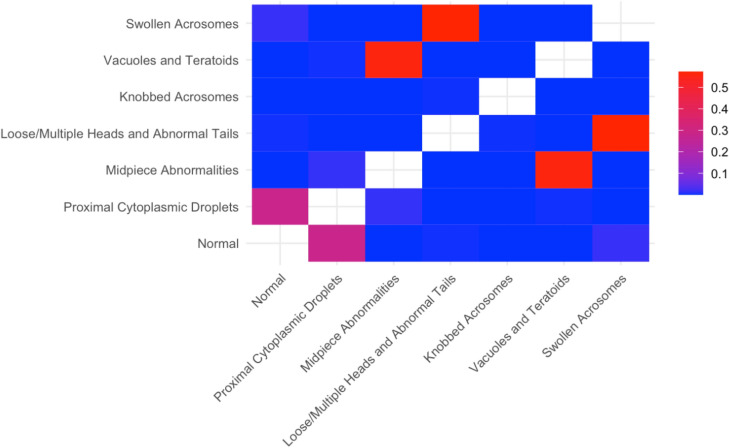
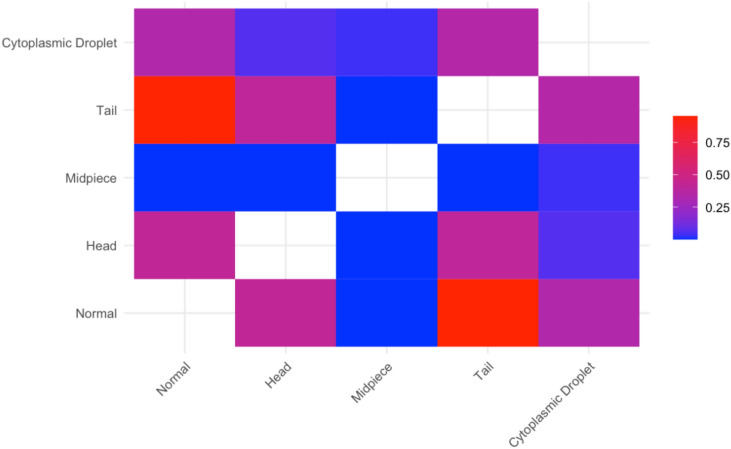
Sperm morphology assessment is recognised as a critical, yet variable, test of male fertility. This variability is due in part to the lack of standardised training for morphologists. This study utilised a bespoke 'Sperm Morphology Assessment Standardisation Training Tool' to train novice morphologists using machine learning principles and consisted of two experiments. Experiment 1 assessed novice morphologists' (n = 22) accuracy across 2- category (normal; abnormal), 5- category (normal; head defect, midpiece defect, tail defect, cytoplasmic droplet), 8- category (normal; cytoplasmic droplet; midpiece defect; loose heads and abnormal tails; pyriform head; knobbed acrosomes; vacuoles and teratoids; swollen acrosomes), and 25- category (normal; all defects defined individually) classification systems, with untrained users achieving 81.0 ± 2.5%, 68 ± 3.59%, 64 ± 3.5%, and 53 ± 3.69%, respectively. A second cohort (n = 16) exposed to a visual aid and video significantly improved first-test accuracy (94.9 ± 0.66%, 92.9 ± 0.81%, 90 ± 0.91% and 82.7 ± 1.05, p < 0.001). Experiment 2 evaluated repeated training over four weeks, resulting in significant improvement in accuracy (82 ± 1.05% to 90 ± 1.38%, p < 0.001) and diagnostic speed (7.0 ± 0.4s to 4.9 ± 0.3s, p < 0.001). Final accuracy rates reached 98 ± 0.43%, 97 ± 0.58%, 96 ± 0.81%, and 90 ± 1.38% across classification systems 2-, 5-, 8- and 25-categories respectively. Significant differences in accuracy and variation were observed between the classification systems. This tool effectively standardised sperm morphology assessment. Future research could explore its application in other species, including in human andrology, given its accessibility and adaptability across classification systems.
Keywords: Advanced semen assessment; Ram sperm morphology; Reproduction; Sperm morphology assessment; Standardised training tool; Subjective assessment.
© 2025. The Author(s).
Conflict of interest statement
Declarations. Competing interests: The authors declare no competing interests.
Figures
Similar articles
-
Intra-cytoplasmic sperm injection versus partial zona dissection, subzonal insemination and conventional techniques for oocyte insemination during in vitro fertilisation.Cochrane Database Syst Rev. 2000;(2):CD001301. doi: 10.1002/14651858.CD001301. Cochrane Database Syst Rev. 2000. Update in: Cochrane Database Syst Rev. 2003;(2):CD001301. doi: 10.1002/14651858.CD001301. PMID: 10796764 Updated.
-
Cigarette Smoking and Semen Quality: A New Meta-analysis Examining the Effect of the 2010 World Health Organization Laboratory Methods for the Examination of Human Semen.Eur Urol. 2016 Oct;70(4):635-645. doi: 10.1016/j.eururo.2016.04.010. Epub 2016 Apr 21. Eur Urol. 2016. PMID: 27113031
-
Temporal trends in sperm count: a systematic review and meta-regression analysis.Hum Reprod Update. 2017 Nov 1;23(6):646-659. doi: 10.1093/humupd/dmx022. Hum Reprod Update. 2017. PMID: 28981654 Free PMC article.
-
Evaluation of an artificial intelligence system for bull sperm morphology evaluation.Theriogenology. 2025 Oct 1;245:117504. doi: 10.1016/j.theriogenology.2025.117504. Epub 2025 May 29. Theriogenology. 2025. PMID: 40466209
-
Sperm mitochondrial DNA copy numbers in normal and abnormal semen analysis: A systematic review and meta-analysis.BJOG. 2022 Aug;129(9):1434-1446. doi: 10.1111/1471-0528.17078. Epub 2022 Jan 18. BJOG. 2022. PMID: 34954901
References
-
- Mallidis, C. et al. Ten years’ experience with an external quality control program for semen analysis. Fertil. Steril.98(3), 611-616.e614 (2012). - PubMed
-
- Matson, P. L. Andrology: External quality assessment for semen analysis and sperm antibody detection: Results of a pilot scheme. Hum. Reprod.10(3), 620–625 (1995). - PubMed
-
- Keel, B. A. Quality control, quality assurance, and proficiency testing in the andrology laboratory. Arch. Androl.48(6), 417–431 (2002). - PubMed
-
- Barratt, C. L. R., Björndahl, L., Menkveld, R. & Mortimer, D. Eshre special interest group for andrology basic semen analysis course: A continued focus on accuracy, quality, efficiency and clinical relevance†. Hum. Reprod.26(12), 3207–3212 (2011). - PubMed
MeSH terms
LinkOut - more resources
Full Text Sources
