. 2025 Jul 1;15(1):21207.
doi: 10.1038/s41598-025-08251-4.

Analysis of 2-dimensional regional differences in the peripapillary scleral fibroblast cytoskeleton of normotensive and hypertensive mouse eyes

Affiliations

Analysis of 2-dimensional regional differences in the peripapillary scleral fibroblast cytoskeleton of normotensive and hypertensive mouse eyes

Ann Mozzer et al. Sci Rep. .

Abstract

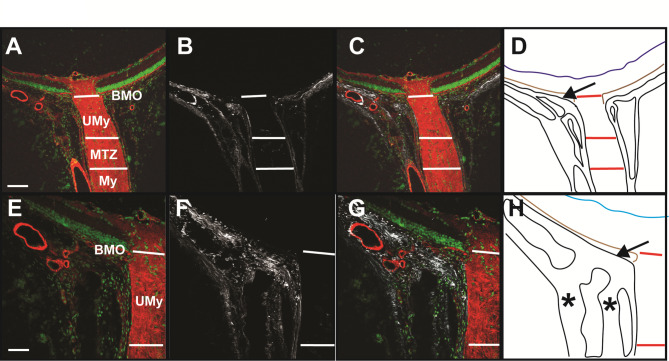
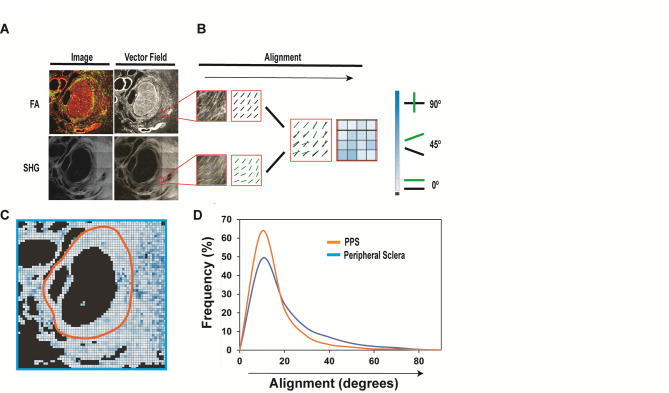
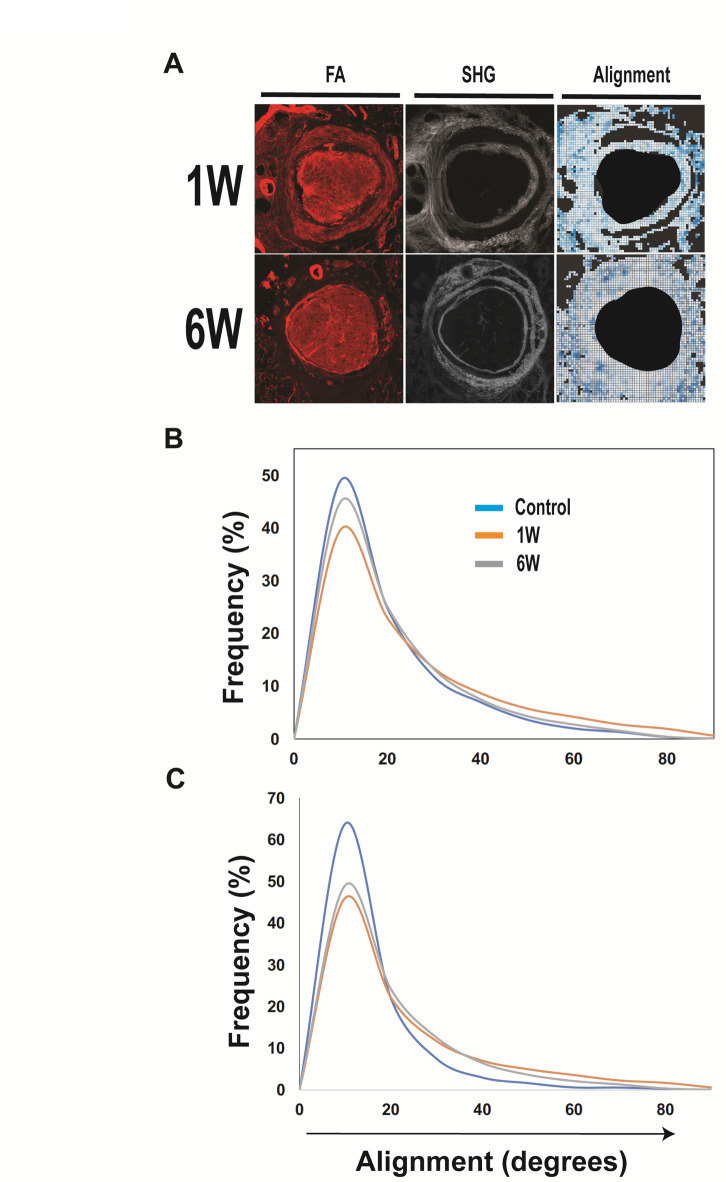
These studies aimed to study the mechanisms of glaucomatous peripapillary scleral (PPS) remodeling by investigating IOP-induced changes in fibroblast actin-collagen alignment and nuclear morphology in mouse PPS. Cryosections from the optic nerve heads (ONH) of eyes isolated 1- and 6-weeks after bead-induced IOP elevation were imaged for nuclei, fibrillar actin (FA), and collagen (second harmonic generation, SHG). Two-dimensional nuclear morphology was analyzed using VAMPIRE machine-learning image analysis and FA-collagen alignment was determined by comparing vector fields of FA and SHG images. Nuclear morphology was regionally defined with the internal (pial) PPS (iPPS) containing nuclei with higher aspect ratios than the peripheral PPS (outer PPS, oPPS) and peripheral sclera. FA-collagen alignment was higher in the PPS than in the peripheral sclera (7.1 ± 2.5° versus 10.0 ± 1.4°, p = 0.05, n = 6). One and six weeks after BI, there were non-significant nuclear morphologic changes reflecting a transition to a rounder shape in all scleral regions and persistently reduced FA-collagen alignment in the PPS regions. This study therefore concludes that chronic IOP elevation is associated with persistent alterations in FA-collagen alignment that indicate sustained cellular responses to tissue stress.


Conflict of interest statement

Competing interests: The authors declare no competing interests.

Figures

Fig. 1
Fig. 1
ONH anatomy. Low (A-D, scale bar = 100 μm) and high (E-H, scale bar = 50 μm) magnification longitudinal sections through the ONH with fibrillar actin (FA, red) and nuclear (green) labels. (B, F) SHG imaging for collagen visualization, and (C, G) merged images. (D, H) An illustration outlining scleral (black), retinal (blue), and choroidal (brown) boundaries. White and red lines demarcate the Bruch’s membrane opening (BMO), unmyelinated (UMy), myelin transition zone (MTZ), and myelinated (My) landmarks. Arrows demarcate region of the scleral flange; asterisks demarcate the dural strut.
Fig. 2
Fig. 2
Serial axial-sections through the ONH. Serial sections of a single mouse eye progressing from the optic nerve (ON)(A, E) to the PPS and scleral flange (L, P) labelled for FA (red) and nuclear structures (green)(A-D and I-L). The inferior nerve (left of each image) contains numerous blood vessels. SHG imaging of the same sections for collagen visualization (E-H and M-P). The collagenous iPPS can be followed through the images to the PPS (arrows). The asterisk in (P) demarcates the level of the scleral flange which contains the oPPS and peripheral sclera.
Fig. 3
Fig. 3
Scleral flange regions. Images of a single scleral flange section with nuclei and FA labelling (A) and SHG/collagen (B). The optic nerve (ON) (inside the white border), iPPS (green border), and oPPS (yellow border) regions are outlined with the peripheral sclera outside the yellow border. (C) Diagram showing the outer borders of the ON, iPPS, and oPPS.
Fig. 4
Fig. 4
VAMPIRE analysis of PPS and peripheral scleral nuclei. (A) Images of ONH nuclei shown prior to segmentation (green), after nuclear segmentation, and after segmentation into iPPS (green border), oPPS (yellow border), and peripheral sclera (red border) regions. Nuclei within the white border were from the optic nerve and excluded from analysis. (B) Overlay of 20 randomly selected raw shapes in each shape mode after VAMPIRE training. (C) Dendrogram of mean shape modes with a heatmap showing the frequency (%) of each shape mode in the iPPS, oPPS, and peripheral sclera (n = number of nuclei).
Fig. 5
Fig. 5
Fibrillar actin-collagen alignment in the PPS and peripheral sclera. (A) 64 × 64 vector fields of FA and SHG images from the same ONH section. (B) Magnified view of the red box in each region with nine FA (black) and SHG (green) vectors overlaid, calculation of alignment in degrees, and alignment heatmap of the nine regions. (C) Alignment heatmap of FA and SHG images shown in (A) with 4,096 regions of alignment. The orange circle demarcates the separation of PPS (inside) and peripheral (outside) regions. (D) Histogram showing the distribution of alignment values (n = 6 eyes from 6 animals).
Fig. 6
Fig. 6
VAMPIRE analysis after IOP elevation. Dendrogram and shape modes with frequency (%) of each mode in the iPPS, oPPS, and peripheral sclera under baseline conditions and following one and six weeks of IOP elevation (n = number of nuclei).
Fig. 7
Fig. 7
FA-collagen alignment after IOP elevation. (A) FA, SHG, and alignment heatmap images from 2 eyes after one and six weeks of IOP elevation with the optic nerve region blacked out in the heatmap images. (B, C) Histogram of alignment values in peripheral sclera (B) and PPS (C) (n = 6 control; n = 5 1 W glaucoma; n = 6 6 W glaucoma).

Similar articles

References

    1. Tham, Y. C. et al. Global prevalence of glaucoma and projections of glaucoma burden through 2040: a systematic review and meta-analysis. Ophthalmology121 (11), 2081–2090. 10.1016/j.ophtha.2014.05.013 (2014). - PubMed
    1. Quigley, H. A., Addicks, E. M., Green, W. R. & Maumenee, A. E. Optic nerve damage in human glaucoma. II. The site of injury and susceptibility to damage. Arch. Ophthalmol.99 (4), 635–649. 10.1001/archopht.1981.03930010635009 (1981). - PubMed
    1. Quigley, H. & Anderson, D. R. The dynamics and location of axonal transport Blockade by acute intraocular pressure elevation in primate optic nerve. Invest. Ophthalmol.15 (8), 606–616 (1976). - PubMed
    1. Burgoyne, C. F., Downs, J. C., Bellezza, A. J., Suh, J. K. & Hart, R. T. The optic nerve head as a Biomechanical structure: a new paradigm for Understanding the role of IOP-related stress and strain in the pathophysiology of glaucomatous optic nerve head damage. Prog Retin Eye Res.24 (1), 39–73 (2005). - PubMed
    1. Sigal, I. A., Flanagan, J. G. & Ethier, C. R. Factors influencing optic nerve head biomechanics. Invest. Ophthalmol. Vis. Sci.46 (11), 4189–4199. 10.1167/iovs.05-0541 (2005). - PubMed

MeSH terms

LinkOut - more resources