Comparative Study
. 2025 Jul 2;15(1):22738.
doi: 10.1038/s41598-025-08192-y.

Comparison of sepsis-associated acute kidney injury with different degrees and causes reveals patterns in mitochondrial metabolism and immune infiltration changes

Affiliations
Comparative Study

Comparison of sepsis-associated acute kidney injury with different degrees and causes reveals patterns in mitochondrial metabolism and immune infiltration changes

Nan Yuan et al. Sci Rep. .

Abstract

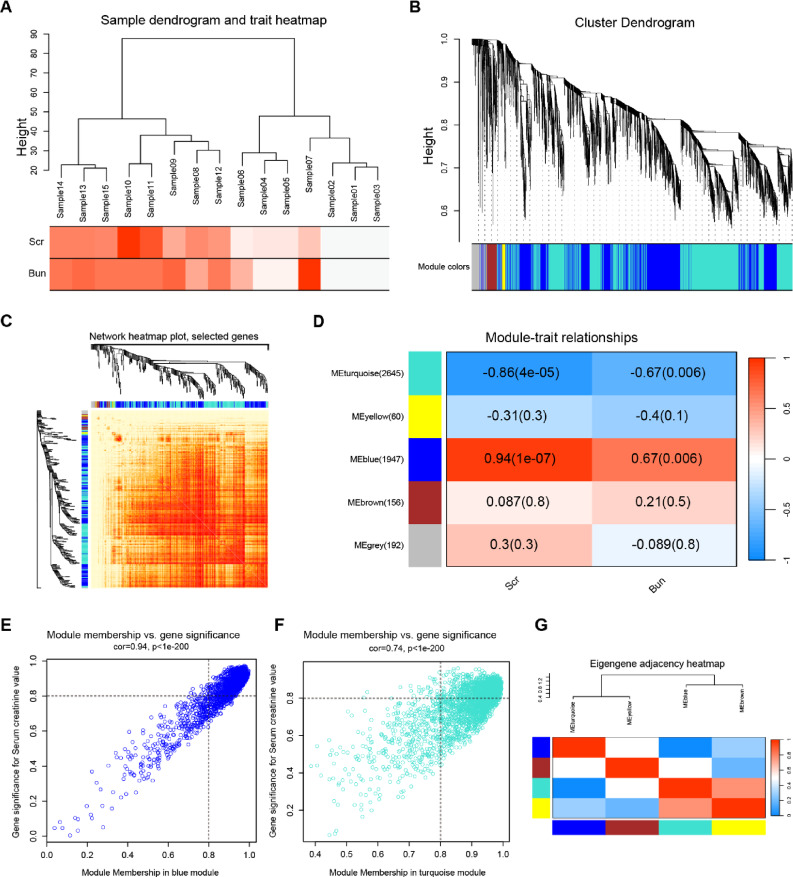
Sepsis-associated acute kidney injury (SA-AKI) is a common complication in critically ill patients, characterized by high morbidity and mortality rates. It remains primarily treated with supportive and nonspecific therapies because of the absence of effective diagnostic biomarkers and therapeutic targets. This study utilized cecal ligation and puncture (CLP) and intraperitoneal injection of lipopolysaccharide (LPS) to create a murine model of SA-AKI, simulating various degrees of severity and aetiologies. Renal transcriptome sequencing was performed, followed by extensive bioinformatic analyses, including gene expression trend analysis using the Mfuzz package, weighted gene co-expression network analysis (WGCNA), protein-protein interaction (PPI) networks, and Cibersort immune infiltration analysis, to uncover key molecular changes in SA-AKI. Transcriptome analysis revealed that SA-AKI induces mitochondrial dysfunction and metabolic disturbances. As the severity of SA-AKI increases, immune-inflammatory activity becomes more pronounced, along with significant metabolic dysfunction. Variations in immune cell infiltration between different aetiologies of SA-AKI suggest distinct immune response patterns and timing. Six hub mitochondrial differentially expressed genes (MitoDEGs) related to SA-AKI severity were identified and validated, showing significant associations with immune cell infiltration. These findings provide valuable insights into SA-AKI pathogenesis and the exploration of therapeutic targets.

Keywords: Bioinformatics analysis; Immune infiltration; Metabolism; Mitochondria; Molecular mechanism; Sepsis-associated acute kidney injury.


Conflict of interest statement

Declarations. Competing interest: The authors declare no competing interests. Ethical approval: The animal study was reviewed and approved by the Institutional Animal Care and Use Committee (IACUC) of the Chinese PLA General Hospital, and the permit number is 2019-X15-97. This study was also conducted in accordance with the guidelines of the Animal Research: Reporting of In Vivo Experiments (ARRIVE).

Figures

Fig. 1
Fig. 1
Flowchart of multistep analysis and validation strategy for bioinformatics data. This figure was created by Figdraw.
Fig. 2
Fig. 2
Injury conditions among different SA-AKI groups. (AH) Representative micrographs of PAS staining showed the pathological features of kidney injury at different group. Scale bars: 50 μm. The arrow showed the brush border of normal tubule, the asterisk (*) showed infiltrated inflammatory cell, the triangle showed tubular dilation or loss of the brush border, and the well sign (#) showed tubular epithelial cell vacuolation or rupture. (E, F) Scr and Bun levels in the SA-AKI group. (GL) The mRNA expression of IL6 (G), Lcn2 (H), IL-1β (I), MCP-1 (J), TNF-α (K) and Kim1 (L) in renal tissues in different SA-AKI groups. Unpaired t-test, n = 3–5 per group, * indicates comparisons of all groups with the Sham group, # indicates a comparison between the CLPseve and CLPmild groups, * or #p < 0.05, ** or ##p < 0.01, *** or ###p < 0. 001,**** or ####p < 0. 0001. SA-AKI, Sepsis-associated acute kidney injury; CLP, cecal ligation and puncture.
Fig. 3
Fig. 3
DEGs in SA-AKI and results of GSEA analysis. (A) The number of DEGs in different groups of SA-AKI. (B) Venn diagram of DEGs in distinct SA-AKI groups. (CF) Volcano plot of DEGs in different groups of SA-AKI. (GN) GSEA analysis of DEGs between different groups of SA-AKI, and presentation of the top 5 upregulated and downregulated pathways for each group. DEGs, differentially expressed genes; SA-AKI, Sepsis-associated acute kidney injury; GSEA, Gene set enrichment analysis.
Fig. 4
Fig. 4
GO and KEGG enrichment analyses of DEGs from different groups. (AD) The enriched GO terms of DEGs in different groups. (EH) KEGG pathway enrichment results in different groups. GO, gene ontology; KEGG, Kyoto Encyclopedia of Genes and Genomes; BP biological process, CC cellular component, MF molecular function.
Fig. 5
Fig. 5
The gene expression patterns of genes in union DEGs set. The Mfuzz R package produced a collective of differentially expressed genes, from which we identified five clusters based on their gene expression. Blue curves represent genes with low membership values, and red curves indicate genes with high membership levels. Clustering heatmaps for each group are presented, with color gradients representing the changes in Z-score values for each gene. The functional annotation results under biological processes (BP) are displayed, with different colors used to distinguish the results for each group. DEGs, differentially expressed genes.
Fig. 6
Fig. 6
Enrichment levels in genomic weighted gene co-expression network analysis. (A) Sample clustering dendrogram with tree leaves representing each sample. (B) Initial and merged modules within the clustering tree. (C) The heatmap of gene network visualization and the dendrogram branches correlate to gene modules. (D) The correlation coefficient and the accompanying p-value between groups. (E) The scatter plot of gene membership in blue module. (F) The scatter plot of gene membership in turquoise module. (G) The heatmap of the relationship between each module.
Fig. 7
Fig. 7
MitoDEGs in SA-AKI; PPI network analysis and hub MitoDEGs identification. (A) Venn diagrams showed the number of MitoDEGs that overlap between Mfuzz key DEGs, WGCNA key DEGs, Mitogenes; (B) PPI network of MitoDEGs; (C) A key cluster with 7 genes was further chosen as hub genes by MCODE; (D) Top 10 hub genes explored by CytoHubba. (E) The expression of 6 hub MitoDEGs in RNA microarray data. (F) GO analysis of the hub MitoDEGs. SA-AKI, Sepsis-associated acute kidney injury; Mito-DEGs, mitochondrial differentially expressed genes; WGCNA, weighted gene co-expression network analysis; PPI, protein–protein interaction; MCODE, molecular complex detection; GO, gene ontology.
Fig. 8
Fig. 8
Immune cell infiltration analysis among different SA-AKI groups. (A) The heatmap depicting the expression of different immune cells in each sample. (B) Correlation of the compositions of 22 immune cell types. (C) The bar plot illustrates the distribution of 22 types of immune cells across several samples. (D) Comparison of various types of immune cells across distinct SA-AKI groups. (E) The correlation between hub MitoDEGs and immune cells. SA-AKI, Sepsis-associated acute kidney injury; MitoDEGs, mitochondrial differentially expressed genes.
Fig. 9
Fig. 9
Validation of expression patterns of 6 hub MitoDEGs. (A) Cells from sham and CLP mice were annotated using Cell Marker and singleR. (B) Dot plot shows the expression levels of hub genes in each cell cluster. (C) Feature Plots showing the expression pattern of Mrps28, Mrps18b, Mrps15, Mrpl28, Mrps21 and Tufm in kidney cells from SA-AKI and sham groups. (D) mRNA expression of the hub MitoDEGs among different mouse SA-AKI groups. Unpaired t-test, n = 3 per group, *p < 0.05, **p < 0.01, ***p < 0.001, ****p < 0.0001 compared to Sham group. Sepsis-associated acute kidney injury; CLP, cecal ligation and puncture; MitoDEGs, mitochondrial differentially expressed genes.

Similar articles

References

    1. Zarbock, A. et al. Sepsis-associated acute kidney injury: Consensus report of the 28th acute disease quality initiative workgroup. Nat. Rev. Nephrol.19(6), 401–417. 10.1038/s41581-023-00683-3 (2023). - PubMed
    1. Hoste, E. A. J. et al. Epidemiology of acute kidney injury in critically ill patients: The multinational AKI-EPI study. Intensive Care Med.41(8), 1411–1423. 10.1007/s00134-015-3934-7 (2015). - PubMed
    1. Peerapornratana, S., Manrique-Caballero, C. L., Gómez, H. & Kellum, J. A. Acute kidney injury from sepsis: Current concepts, epidemiology, pathophysiology, prevention and treatment. Kidney Int.96(5), 1083–1099. 10.1016/j.kint.2019.05.026 (2019). - PMC - PubMed
    1. Chang, Y. M., Chou, Y. T., Kan, W. C. & Shiao, C. C. Sepsis and acute kidney injury: A review focusing on the bidirectional interplay. IJMS23(16), 9159. 10.3390/ijms23169159 (2022). - PMC - PubMed
    1. Gómez, H., Kellum, J. A. & Ronco, C. Metabolic reprogramming and tolerance during sepsis-induced AKI. Nat. Rev. Nephrol.13(3), 143–151. 10.1038/nrneph.2016.186 (2017). - PMC - PubMed

Publication types

Substances